The ALICE Collaboration has measured the azimuthal correlation between trigger isolated-prompt photons and associated charged hadrons in Pb$-$Pb collisions at the CERN LHC, at a centre-of-mass energy per nucleon pair of $\sqrt{\textit{s}_{\rm NN}} = 5.02$ TeV. The trigger isolated-prompt photons are measured in the transverse-momentum range $18<~ p_{\rm T}^γ <~ 40$ GeV/$c$ and pseudorapidity range $|η^γ| <~0.67$. The isolation selection is based on a charged particle isolation momentum threshold $p_{\rm T}^{\rm iso, ch} = 1.5$ GeV/$c$ within a cone of radius $R=0.2$. The associated charged particles are measured in the transverse-momentum ranges $p_{\rm T}^{\rm h} > 1.8$ GeV/$c$ and pseudorapidity $|η^{\rm h}| <~0.9$. The yield D$(z_{\rm T})$ of associated hadrons per trigger, with $z_{\rm T} = p_{\rm T}^{\rm h}/p_{\rm T}^γ$, is measured in three Pb$-$Pb collision centrality classes: central (0$-$30%), semicentral (30$-$50%), and peripheral (50$-$90%). An approximation to the standard $I_{\rm AA}$ is computed from the D$(z_{\rm T})$ conditional yields, using NLO pQCD predictions as pp reference. A strong suppression of this ratio is observed in central collisions compared to peripheral collisions. The result extends to a lower $p_{\rm T}^γ$ relative to those reported in previously published Pb$-$Pb collisions measurements at $\sqrt{s_{\rm NN}}=5.02$ TeV. The measurement is compared to NLO pQCD calculations that include energy loss, and to the CoLBT-hydro model. The results from central collisions are also compared with measurements of jets correlated with isolated-prompt photons and of hadrons correlated with Z$^0$ bosons, both reported by the CMS Collaboration at the LHC, as well as with direct photon$-$hadron correlation measurements reported by the PHENIX and STAR Collaborations at RHIC.
Submitted to: EPJC
e-Print: arXiv:2605.02342 | PDF | inSPIRE
CERN-EP-2026-127
Figure group
Figure 1
Azimuthal correlation distributions in the 30$-$50% centrality class of Pb$-$Pb collisions at $\sqrt{s_{\rm NN}} = 5.02$ $\mathrm{TeV}$ and for the interval $0.20< z_{\rm T}< 0.30$, for isolated-narrow clusters triggered in the range $20< p_{\rm T}^{\rm trig}< 25$ GeV/$c$, with charged-particle tracks in the same collision ("Same event", black-open circles) or in a different collision ("Mixed event", red without marker). The result of subtracting the mixed-event distribution is shown in blue-full circles. The vertical bars indicate the statistical uncertainties. |  |
Figure 2
Azimuthal correlation distributions in the 30$-$50% centrality class of Pb$-$Pb collisions at $\sqrt{s_{\rm NN}} = 5.02$ $\mathrm{TeV}$ for the intervals $0.20< z_{\rm T}< 0.30$ and $20< p_{\rm T}^{\rm trig}< 25$ GeV/$c$. Each marker corresponds to a different trigger: isolated-narrow clusters (blue-full circles), also shown in Fig. 1; isolated-wide clusters (violet-open squares), scaled by $1-P$, where $P$ is the purity; isolated-photon triggers (orange-empty crosses), calculated using the equation in the text. The vertical bars indicate the statistical uncertainties. The dashed-green line at $|\Delta \varphi|=3/5\pi$ indicates the lower limit of the integration used in the $D(z_{\rm T})$ calculation. |  |
Figure 3
$D(z_{\rm T})$ distributions for isolated-prompt photon-hadron correlations measured in Pb$-$Pb collisions at $\sqrt{s_{\rm NN}} = 5.02$ $\mathrm{TeV}$ for three centrality classes: 0$-$30% (left), 30$-$50% (middle), and 50$-$90% (right). The boxes and vertical lines represent the systematic and statistical uncertainties, respectively. Different theory predictions are shown: an NLO pQCD calculation including energy loss [75,76] (pink line and uncertainty band), and from CoLBT-hydro [83] (cyan-dashed line and uncertainty band). Also, an NLO pQCD prediction for pp collisions at $\sqrt{s_{\rm NN}}=5.02$ $\mathrm{TeV}$ is shown (green line and uncertainty band). |  |
Figure 4
Ratio of the measured $D(z_{\rm T})$ distributions in Pb$-$Pb collision at $\sqrt{s_{\mathrm{NN}}}=5.02$ $\mathrm{TeV}$ to the NLO pQCD predictions for pp collisions at $\sqrt{s}=5.02$ $\mathrm{TeV}$ , $I_{\rm pQCD}$, all distributions in denominator and numerator are shown in Fig. 3. Each panel shows a different centrality class: 0$-$30% (left), 30$-$50% (middle), and 50$-$90% (right). The grey-filled boxes and vertical-black lines represent the data systematic and statistical uncertainties, respectively. The green-open boxes represent the $\mu$ scale uncertainty for the denominator NLO pQCD calculation for pp collisions. Different theory predictions for the $I_{\mathrm{AA}}$, which include energy loss, are shown: an NLO pQCD calculation [75,76] (pink line and uncertainty band), and from a CoLBT-hydro calculation [83] (cyan-dashed line and uncertainty band, not for peripheral collisions). Also, an NLO pQCD prediction, which includes CNM effects only (no energy loss, no centrality dependence), is reported (light orange line and uncertainty bands). | 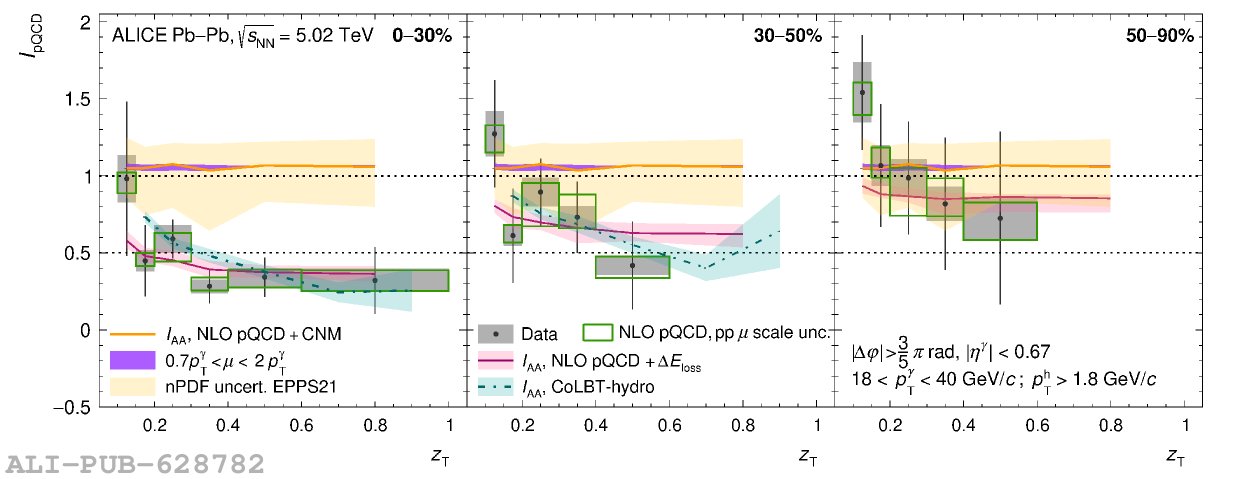 |
Figure 5
$I_{\rm{CP}}$ ratio of the $D(z_{\rm T})$ distributions for Pb$-$Pb collisions at $\sqrt{s_{\rm NN}}=5.02$ $\mathrm{TeV}$ in Fig. 3 for data: 0$-$30% over 50$-$90% (red squares), and 30$-$50% over 50$-$90% (violet bullets). The boxes represent the systematic uncertainties, while the vertical bars indicate the statistical uncertainties. Also, the equivalent ratios from the NLO pQCD calculation for Pb$-$Pb collisions, including energy loss, are shown as a band indicating the theory uncertainty. |  |
Figure 6
$I_{\rm pQCD}$ for central Pb$-$Pb collisions at $\sqrt{s_{\rm NN}}=5.02$ $\mathrm{TeV}$ measured in ALICE for isolated-prompt $\gamma-$hadron correlations, and $I_{\rm AA}$ measured in CMS for isolated-prompt $\gamma-$jet correlations [49] and Z$^{0}-$hadron correlations [52] also in central collisions. The boxes and vertical lines represent the systematic and statistical uncertainties, respectively. For ALICE, the blue-open boxes represent the $\mu$ scale uncertainty for the denominator NLO pQCD calculation for pp collisions. |  |
Figure 7
Isolated-prompt $\gamma-$hadron correlations $I_{\rm pQCD}$ for central Pb$-$Pb collisions at $\sqrt{s_{\rm NN}}=5.02$ $\mathrm{TeV}$ measured by the ALICE Collaboration, and $I_{\rm AA}$ for central Au$-$Au collisions at $\sqrt{s_{\rm NN}} = 200$ $\mathrm{GeV}$ measured by the PHENIX [48] and STAR [47] Collaborations at RHIC, also in central collisions. The boxes represent the systematic uncertainties, while the vertical bars indicate the statistical uncertainties. For ALICE, the blue-open boxes represent the $\mu$ scale uncertainty for the denominator NLO pQCD calculation for pp collisions. |  |
Figure P.N.2
The $D(z_{\rm T})$ distributions in 0$-$30% (full-red squares) Pb$-$Pb collisions, in pp (full-black circles), and in p$-$Pb (empty-black circles) collisions from Ref. [2] as a function of $z_{\rm T}$. The boxes and vertical lines represent the systematic and statistical uncertainties, respectively. The results are compared with an NLO pQCD D($z_{\rm T}$) theory estimation (light brown-dashed band). Note the selection criteria for the Pb$-$Pb measurements and theory, and pp and p$-$Pb collisions are different, as shown in the legend and discussed in the text. | 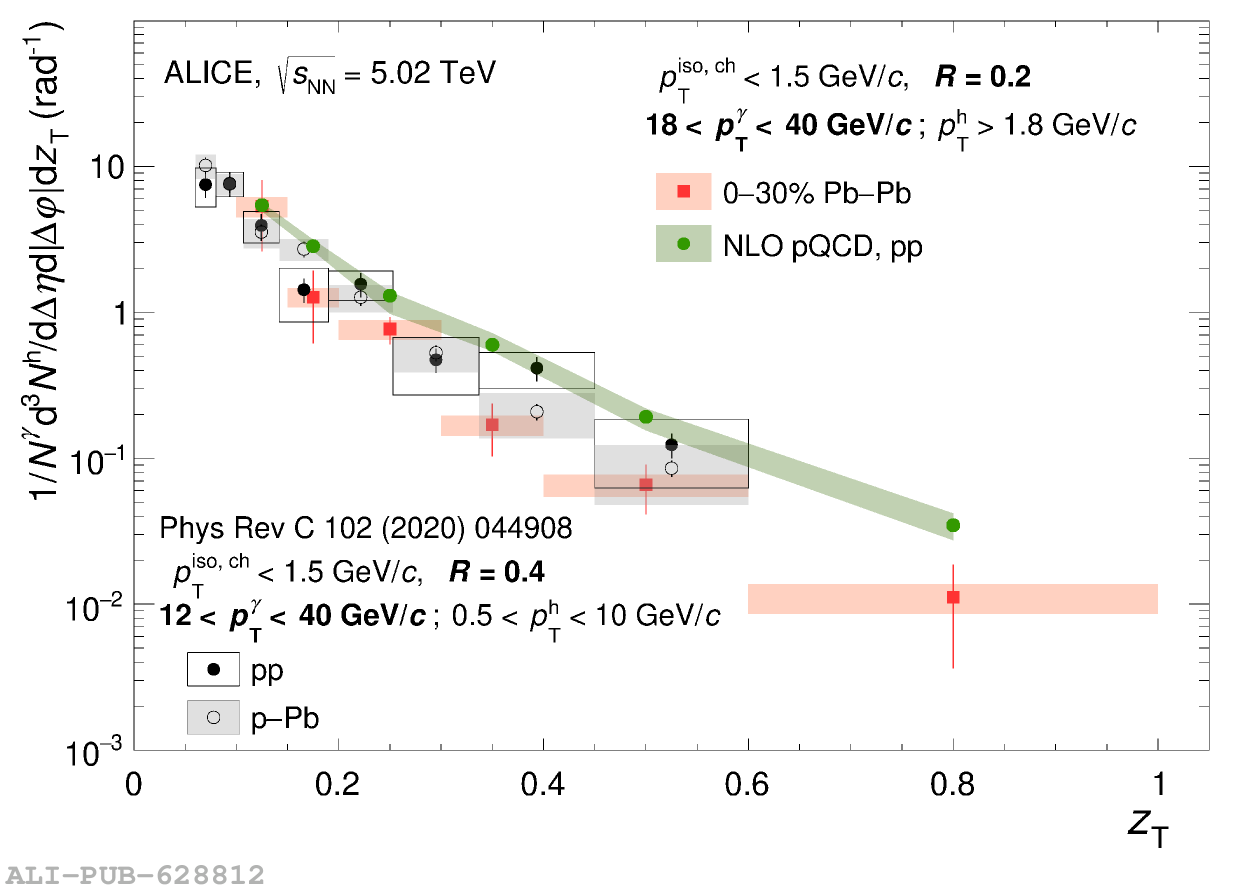 |
Figure P.N.4
The $I_{\rm pQCD}$ distribution for 0$-$30% Pb$-$Pb collisions (full-red square), and the measured $I_{\rm pA}$ from Ref. [2] (open-black squares) as a function of $z_{\rm T}$. The boxes and vertical lines represent the systematic and statistical uncertainties, respectively. For Pb$-$Pb collisions $\it{I}_{\rm{pQCD}}$, the green-open boxes represent the $\mu$ scale uncertainty for the denominator NLO pQCD calculation for pp collisions. The results are compared with a theory estimation for $\it{I}_{\rm{AA}}$ with CNM effects only (light orange-dashed line and uncertainty band). Note the selection criteria for the Pb$-$Pb measurements and theory, and pp and p$-$Pb collisions are different, as shown in the legend. The effects of the different selection criteria are expected to cancel in the ratio. | 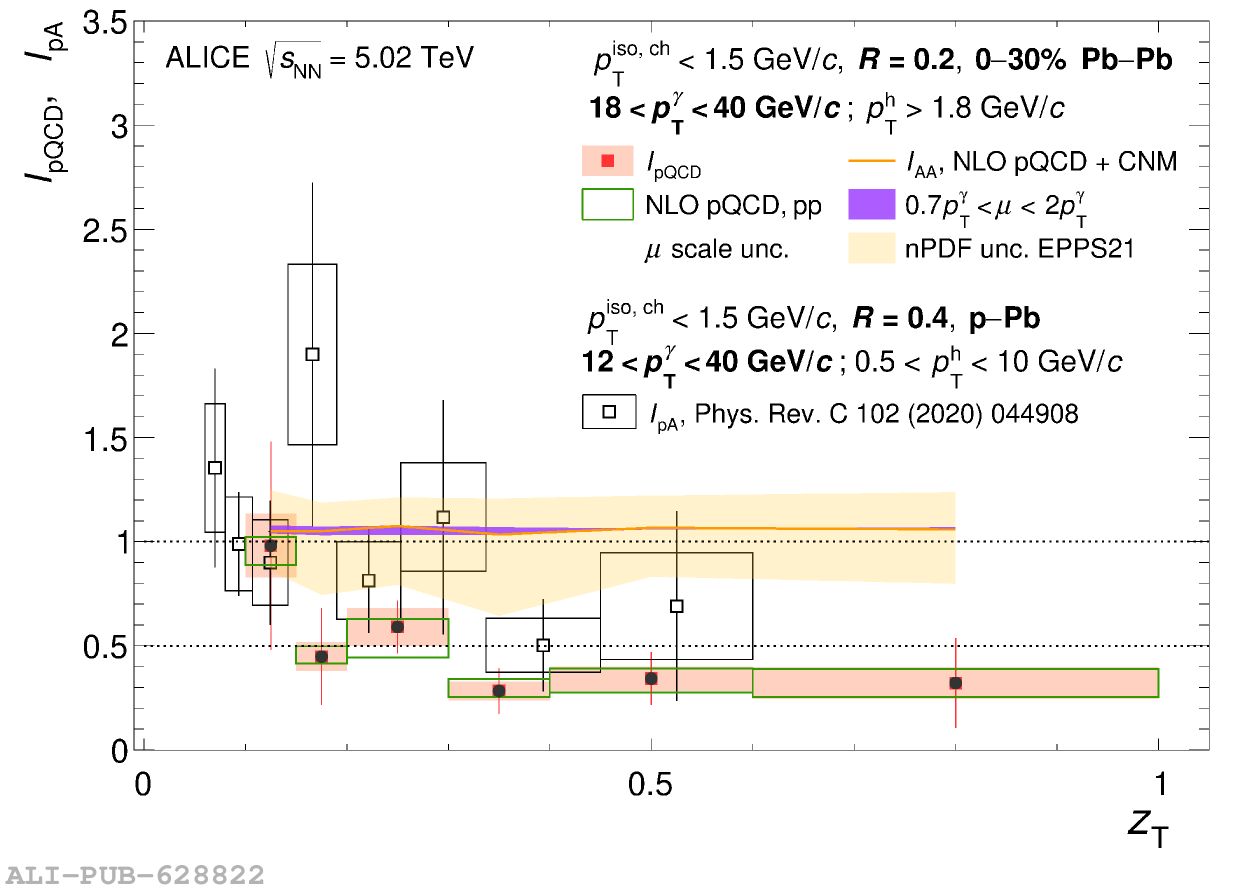 |
Figure P.N.5
Azimuthal correlation distributions measured in 50$-$90% Pb$-$Pb collisions for isolated-narrow-cluster triggers with 20 $< p_{\rm T}^{\rm trig}< $ 25 GeV/$\it{c}$, and for different $z_{\rm T}$ intervals (each panel): for the same event (empty-black circles), for the mixed event (full-red squares), and the result of the subtraction (full-light blue circles). The vertical lines represent the statistical uncertainties. | 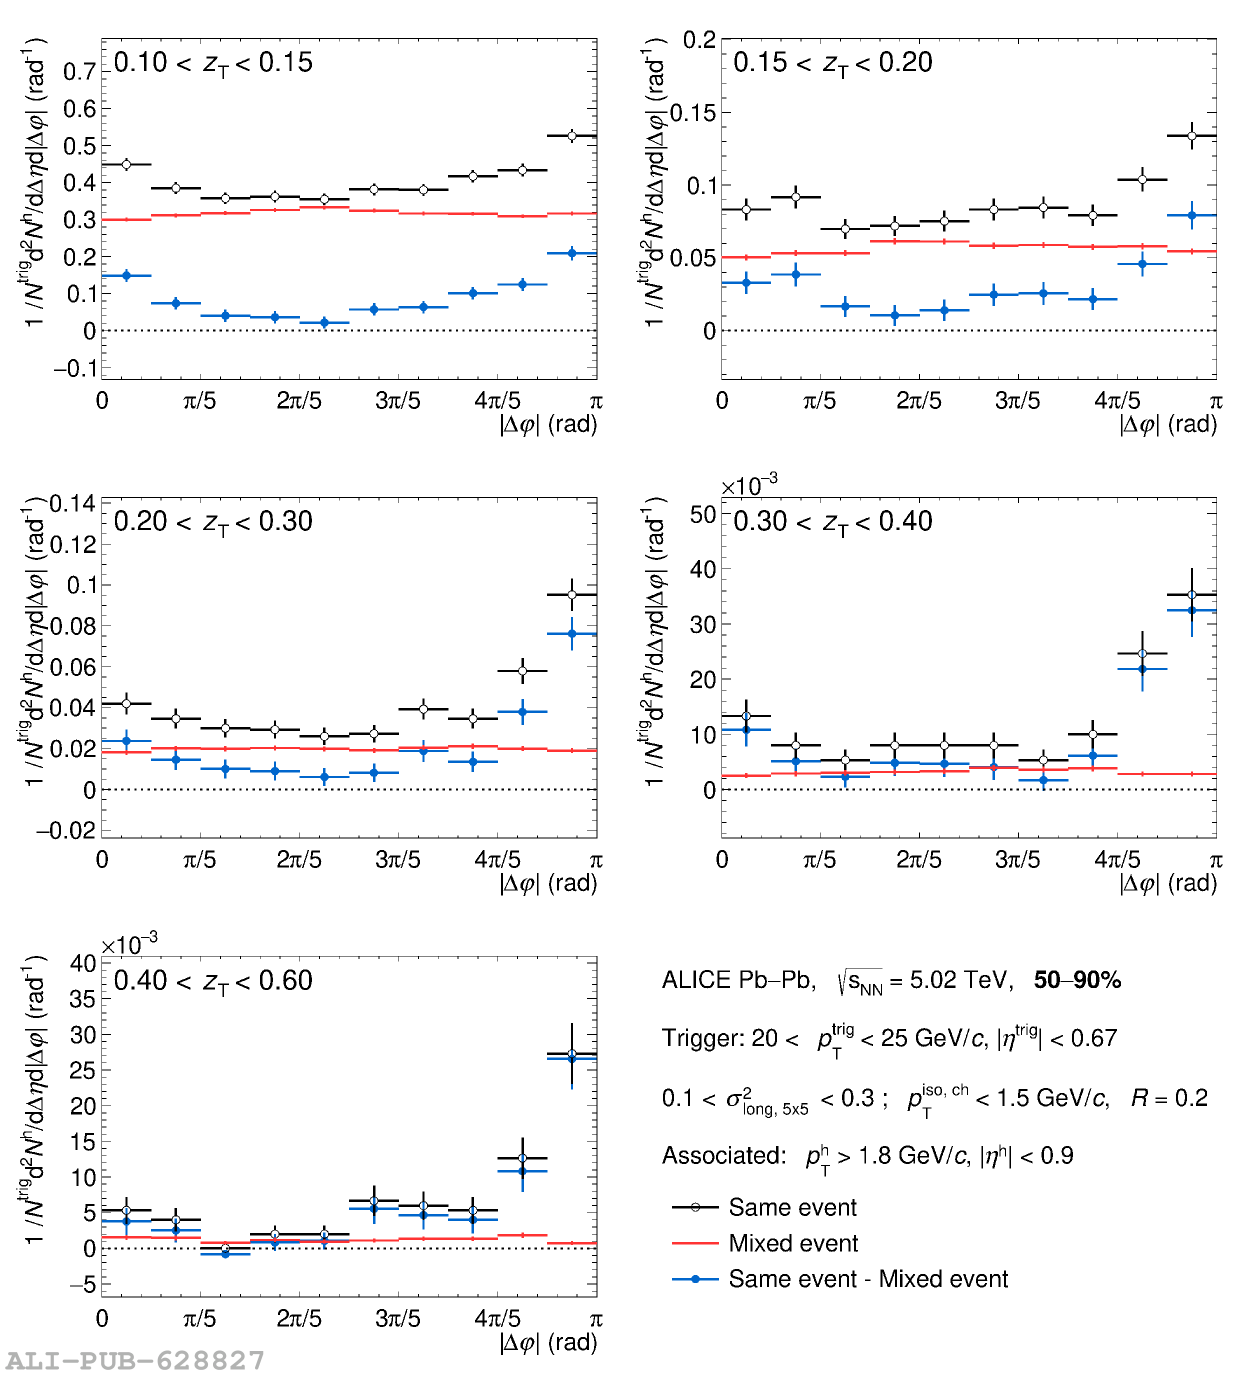 |
Figure P.N.6
Azimuthal correlation distributions measured in 30$-$50% Pb$-$Pb collisions for isolated-narrow-cluster triggers with 20 $< p_{\rm T}^{\rm trig}< $ 25 GeV/$\it{c}$, and for different $z_{\rm T}$ intervals (each panel): for the same event (empty-black circles), for the mixed event (full-red squares), and the result of the subtraction (full-light blue circles). The vertical lines represent the statistical uncertainties. | 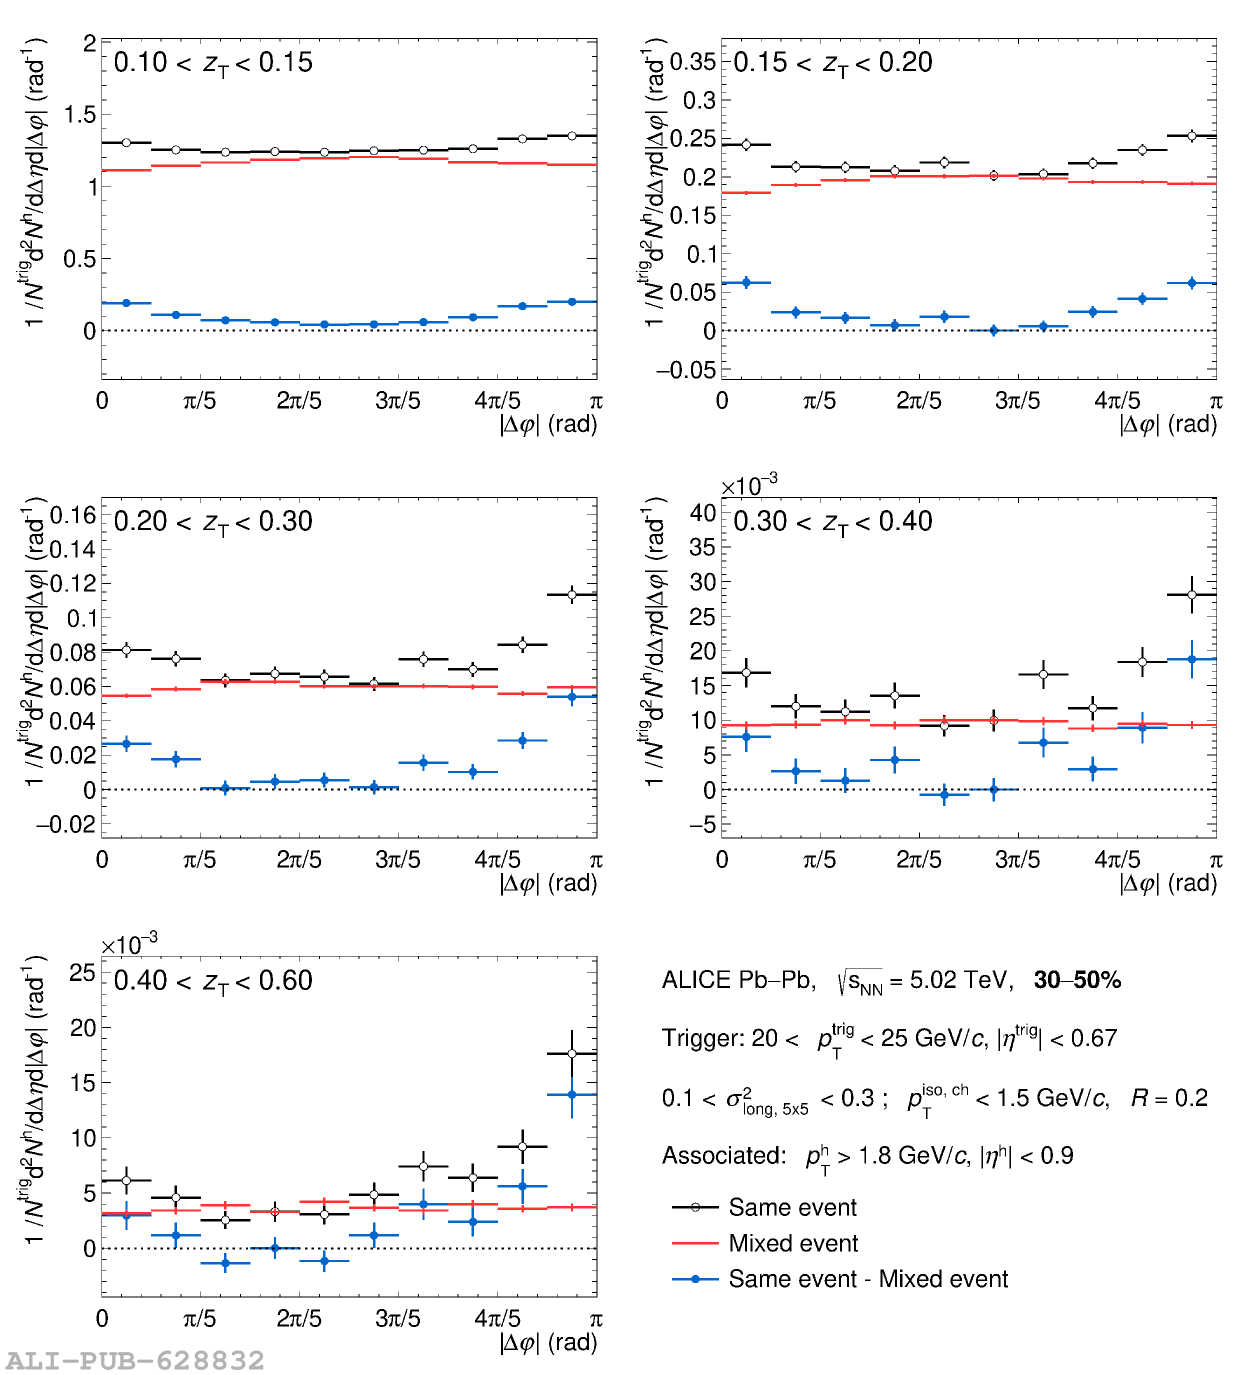 |
Figure P.N.7
Azimuthal correlation distributions measured in 10$-$30% Pb$-$Pb collisions for isolated-narrow-cluster triggers with 20 $< p_{\rm T}^{\rm trig}< $ 25 GeV/$\it{c}$, and for different $z_{\rm T}$ intervals (each panel): for the same event (empty-black circles), for the mixed event (full-red squares), and the result of the subtraction (full-light blue circles). The vertical lines represent the statistical uncertainties. | 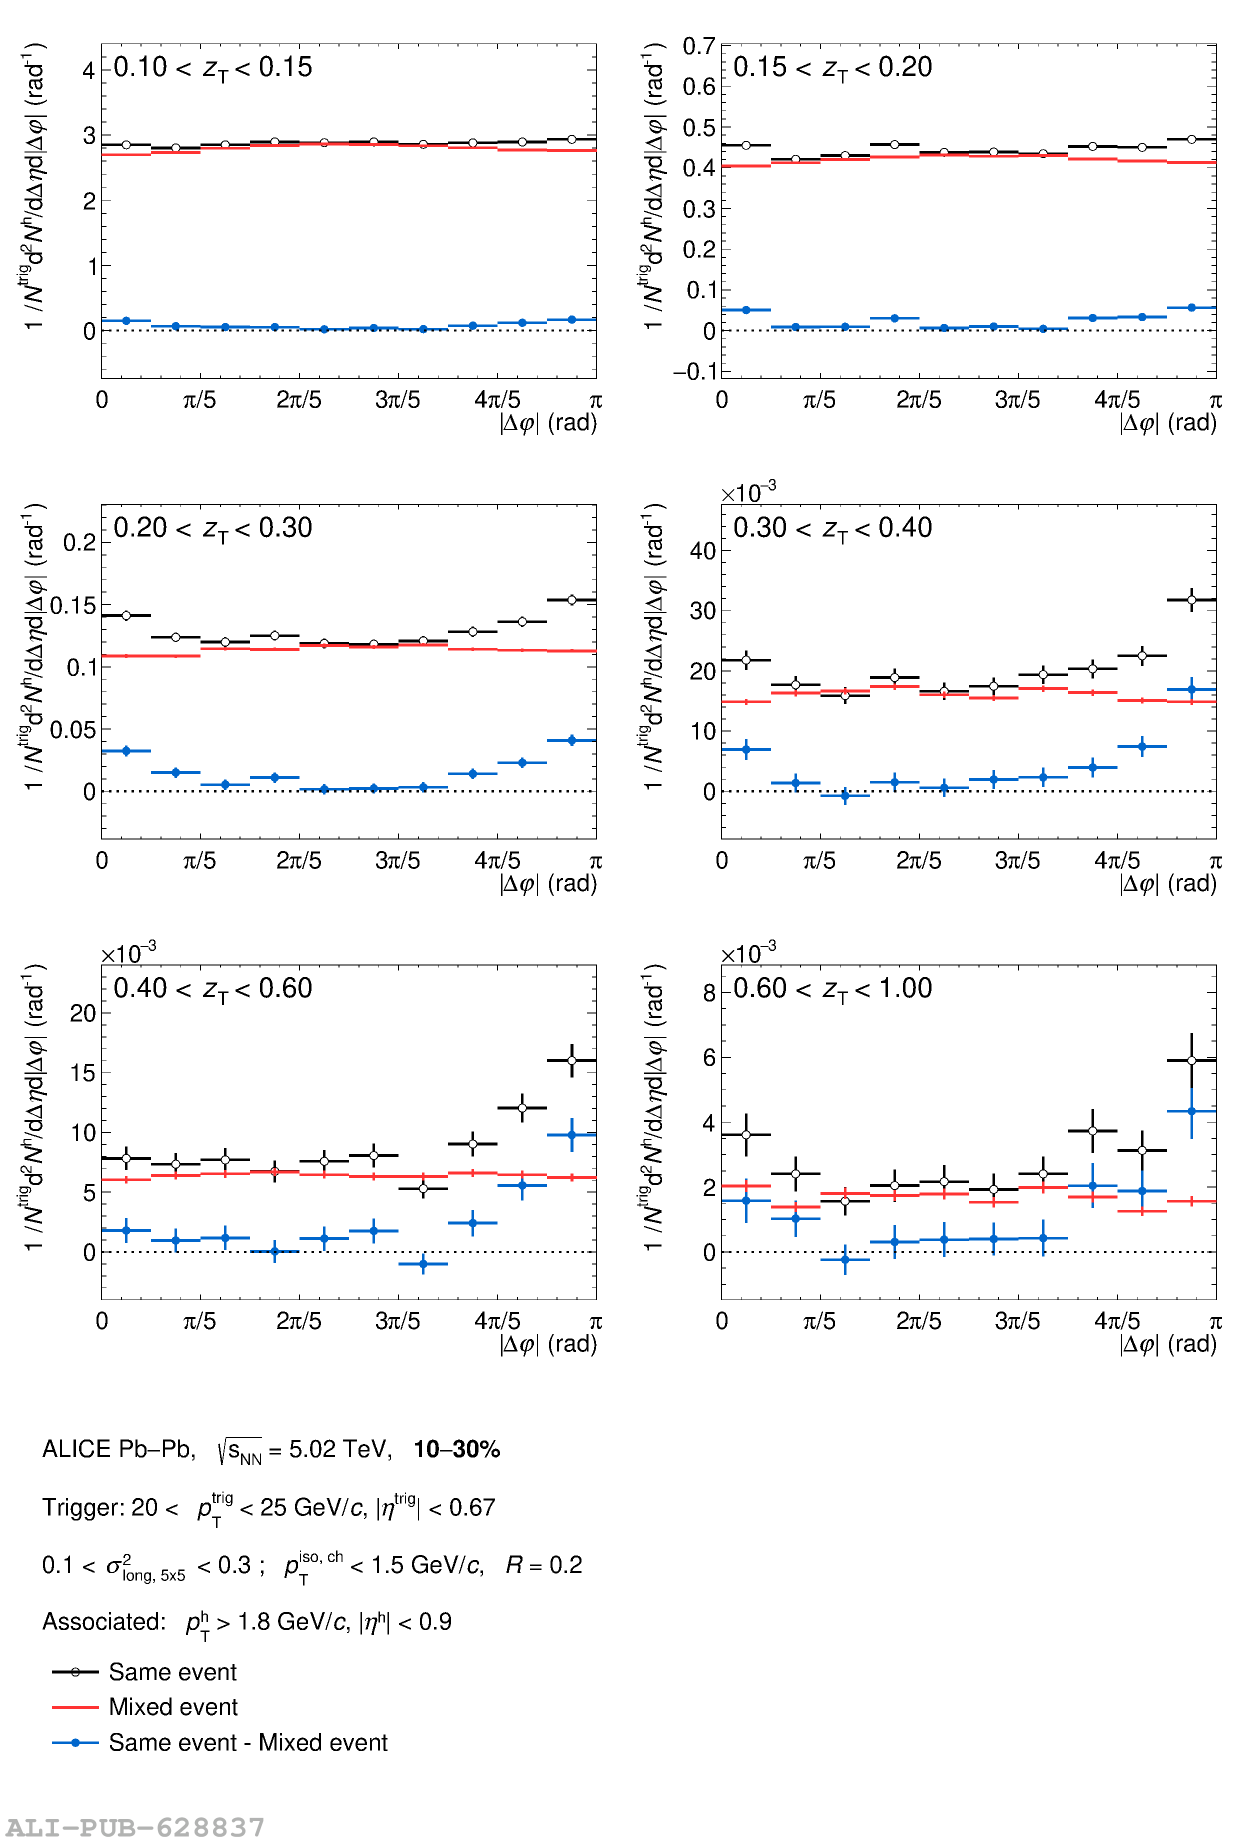 |
Figure P.N.8
Azimuthal correlation distributions measured in 0$-$10% Pb$-$Pb collisions for isolated-narrow-cluster triggers with 20 $< p_{\rm T}^{\rm trig}< $ 25 GeV/$\it{c}$, and for different $z_{\rm T}$ intervals (each panel): for the same event (empty-black circles), for the mixed event (full-red squares), and the result of the subtraction (full-light blue circles). The vertical lines represent the statistical uncertainties. | 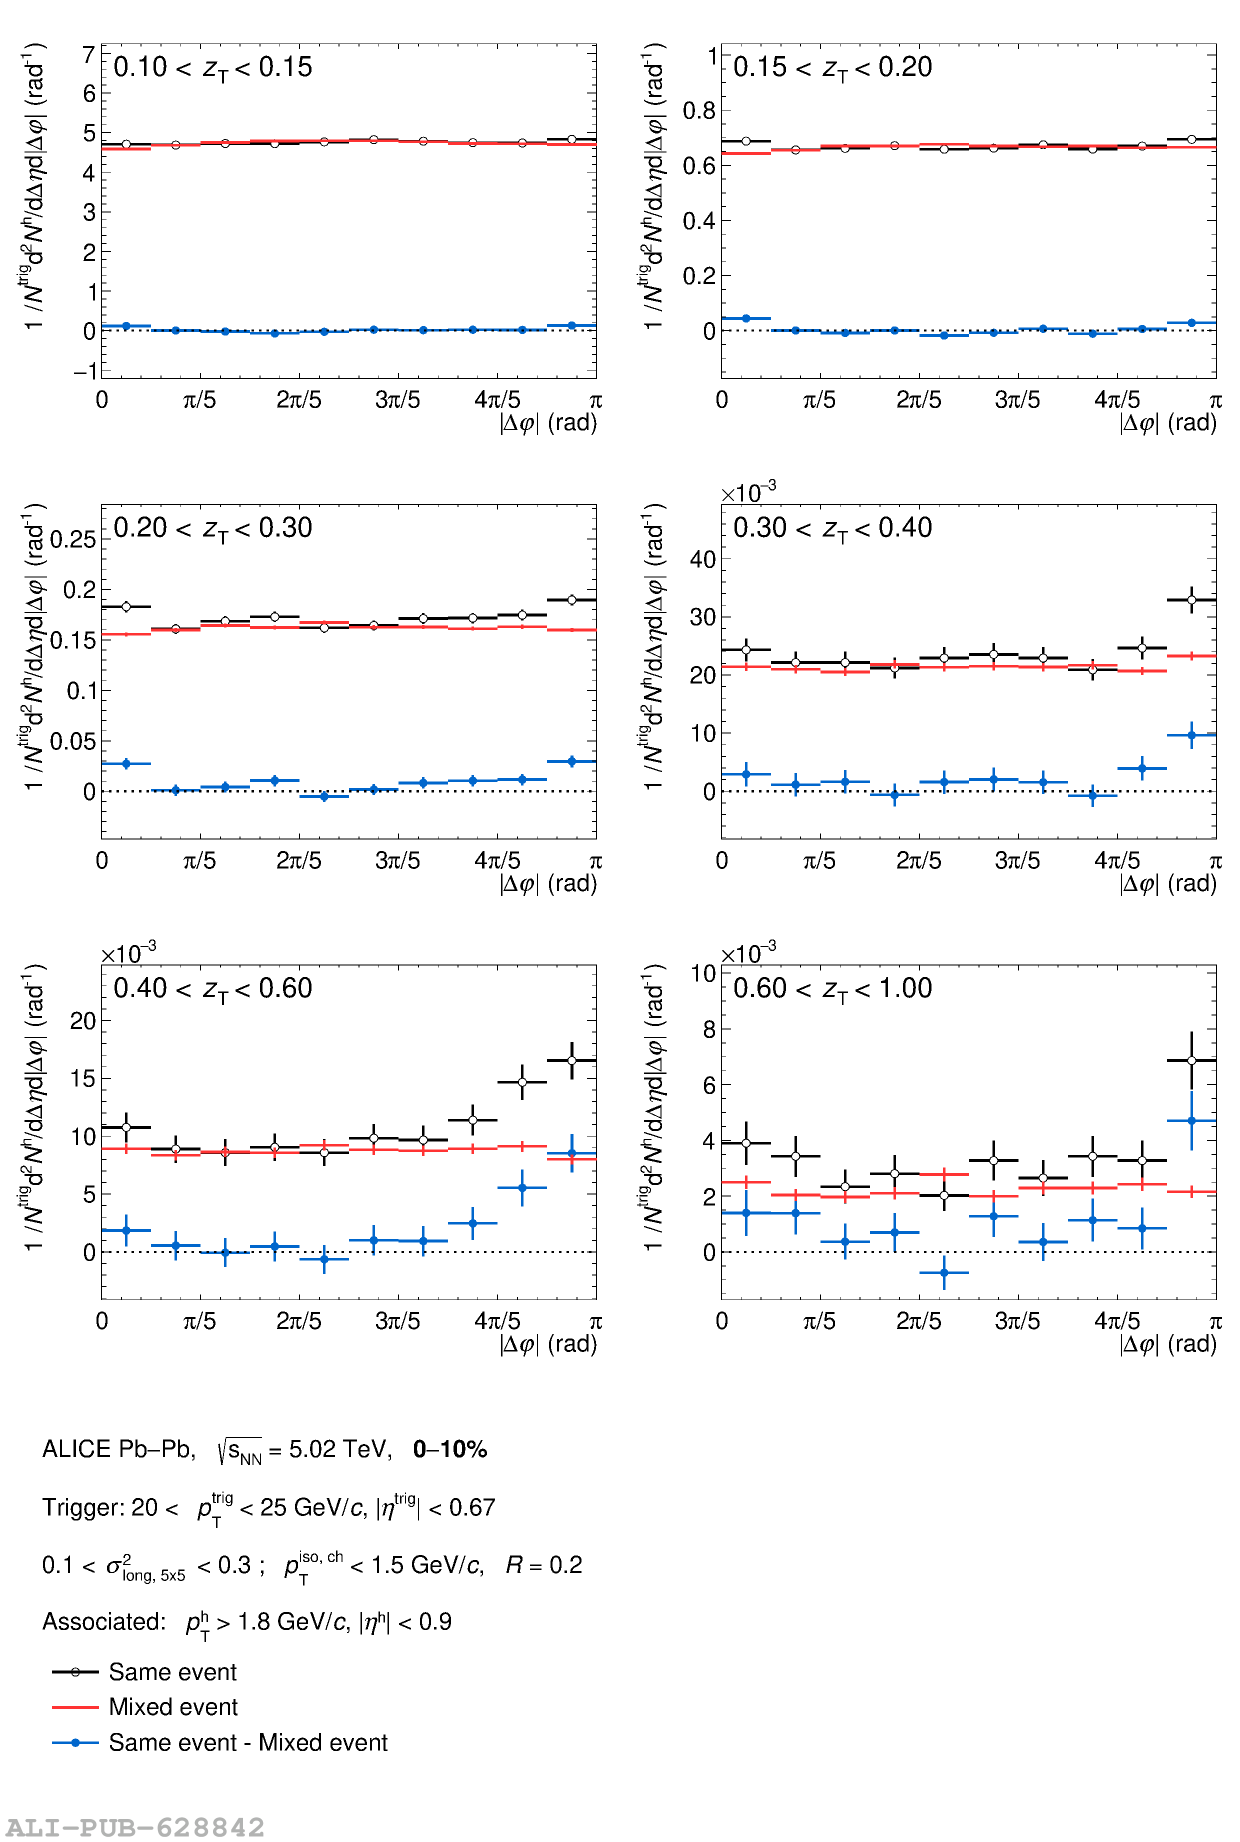 |
Figure P.N.9
Azimuthal correlation distributions measured in 50$-$90% Pb$-$Pb collisions for isolated-narrow (full-light blue circles) and isolated wide (empty-violet squares) cluster triggers, and isolated-prompt photon triggers (empty-orange crosses) with 20 $< p_{\rm T}^{\rm trig}< $ 25 GeV/$\it{c}$, and for different $z_{\rm T}$ intervals (each panel). The vertical lines represent the statistical uncertainties. The dashed-green line at $|\Delta \varphi|=3/5\pi$ indicates the lower limit of the integration used in the $D(z_{\rm T})$ calculation. | 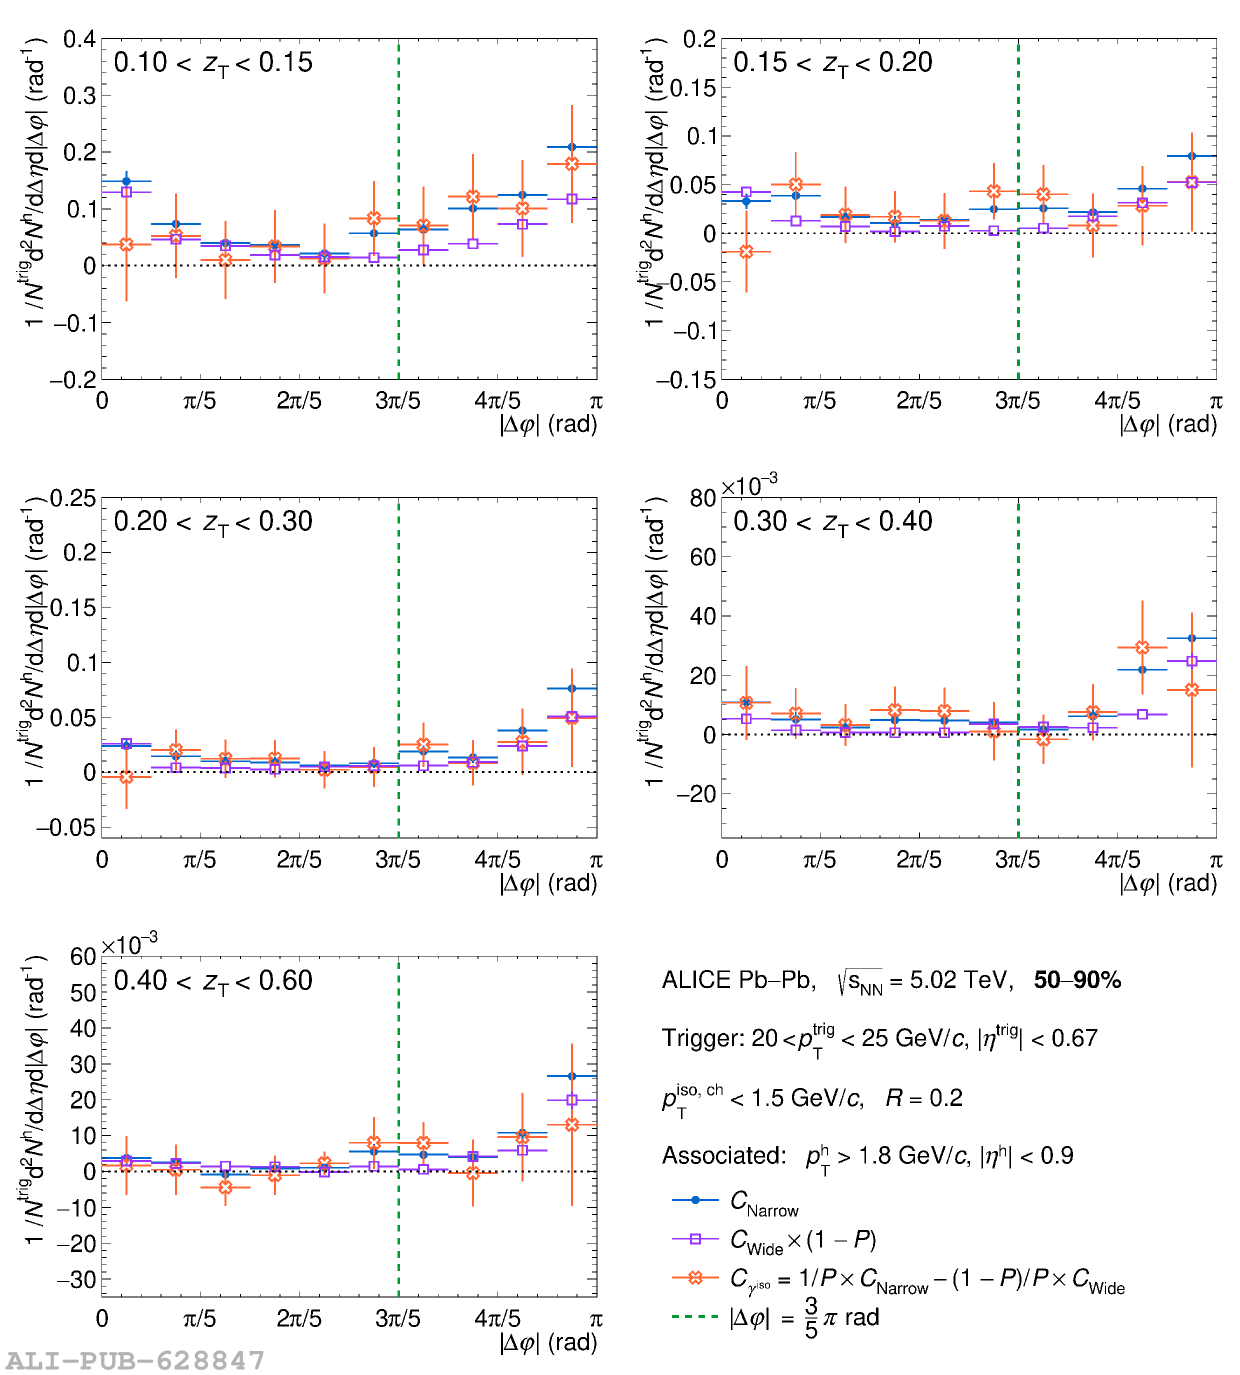 |
Figure P.N.10
Azimuthal correlation distributions measured in 30$-$50% Pb$-$Pb collisions for isolated-narrow (full-light blue circles) and isolated wide (empty-violet squares) cluster triggers, and isolated-prompt photon triggers (empty-orange crosses) with 20 $< p_{\rm T}^{\rm trig}< $ 25 GeV/$\it{c}$, and for different $z_{\rm T}$ intervals (each panel). The vertical lines represent the statistical uncertainties. The dashed-green line at $|\Delta \varphi|=3/5\pi$ indicates the lower limit of the integration used in the $D(z_{\rm T})$ calculation. |  |
Figure P.N.11
Azimuthal correlation distributions measured in 10$-$30% Pb$-$Pb collisions for isolated-narrow (full-light blue circles) and isolated wide (empty-violet squares) cluster triggers, and isolated-prompt photon triggers (empty-orange crosses) with 20 $< p_{\rm T}^{\rm trig}< $ 25 GeV/$\it{c}$, and for different $z_{\rm T}$ intervals (each panel). The vertical lines represent the statistical uncertainties. The dashed-green line at $|\Delta \varphi|=3/5\pi$ indicates the lower limit of the integration used in the $D(z_{\rm T})$ calculation. | 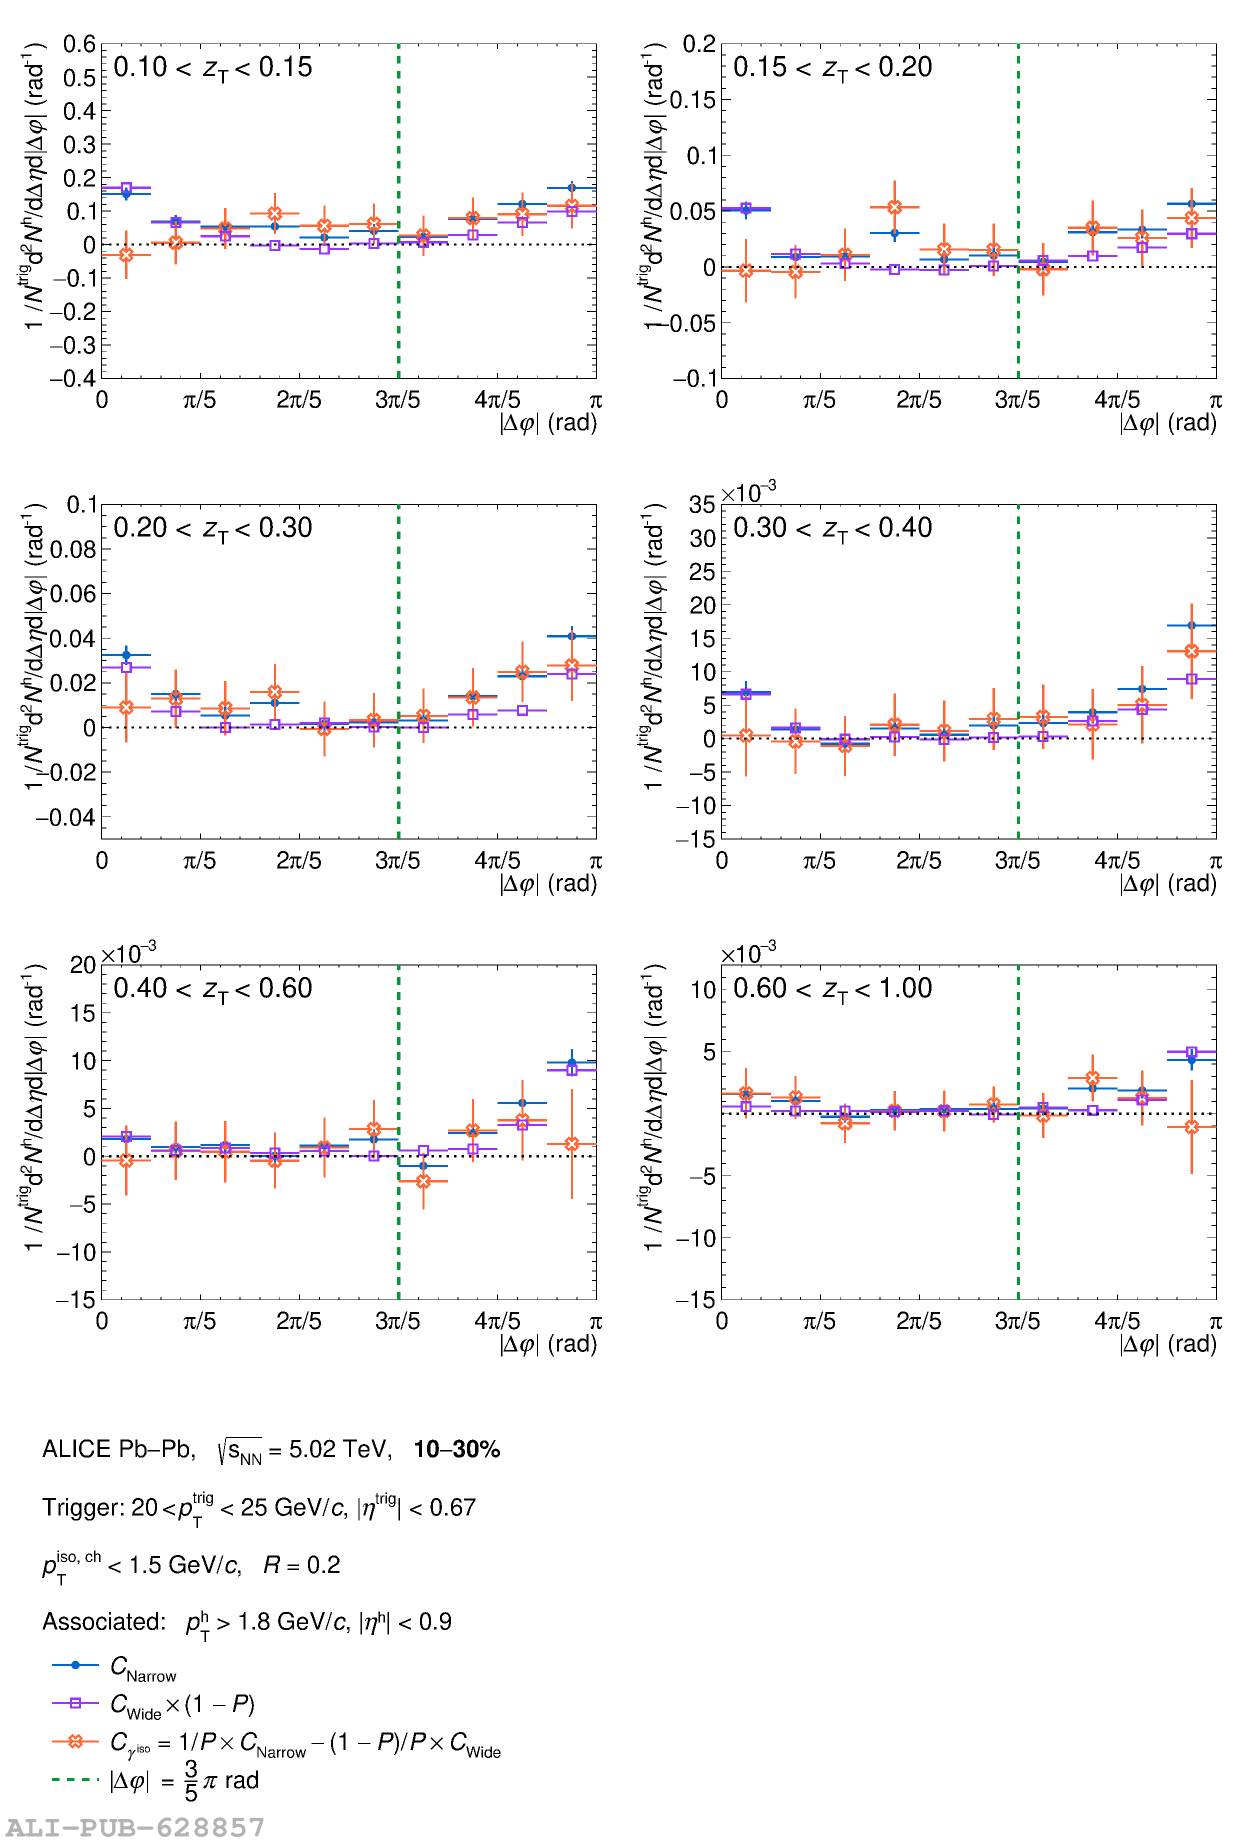 |
Figure P.N.12
Azimuthal correlation distributions measured in 0$-$10% Pb$-$Pb collisions for isolated-narrow (full-light blue circles) and isolated wide (empty-violet squares) cluster triggers, and isolated-prompt photon triggers (empty-orange crosses) with 20 $< p_{\rm T}^{\rm trig}< $ 25 GeV/$\it{c}$, and for different $z_{\rm T}$ intervals (each panel). The vertical lines represent the statistical uncertainties. The dashed-green line at $|\Delta \varphi|=3/5\pi$ indicates the lower limit of the integration used in the $D(z_{\rm T})$ calculation. | 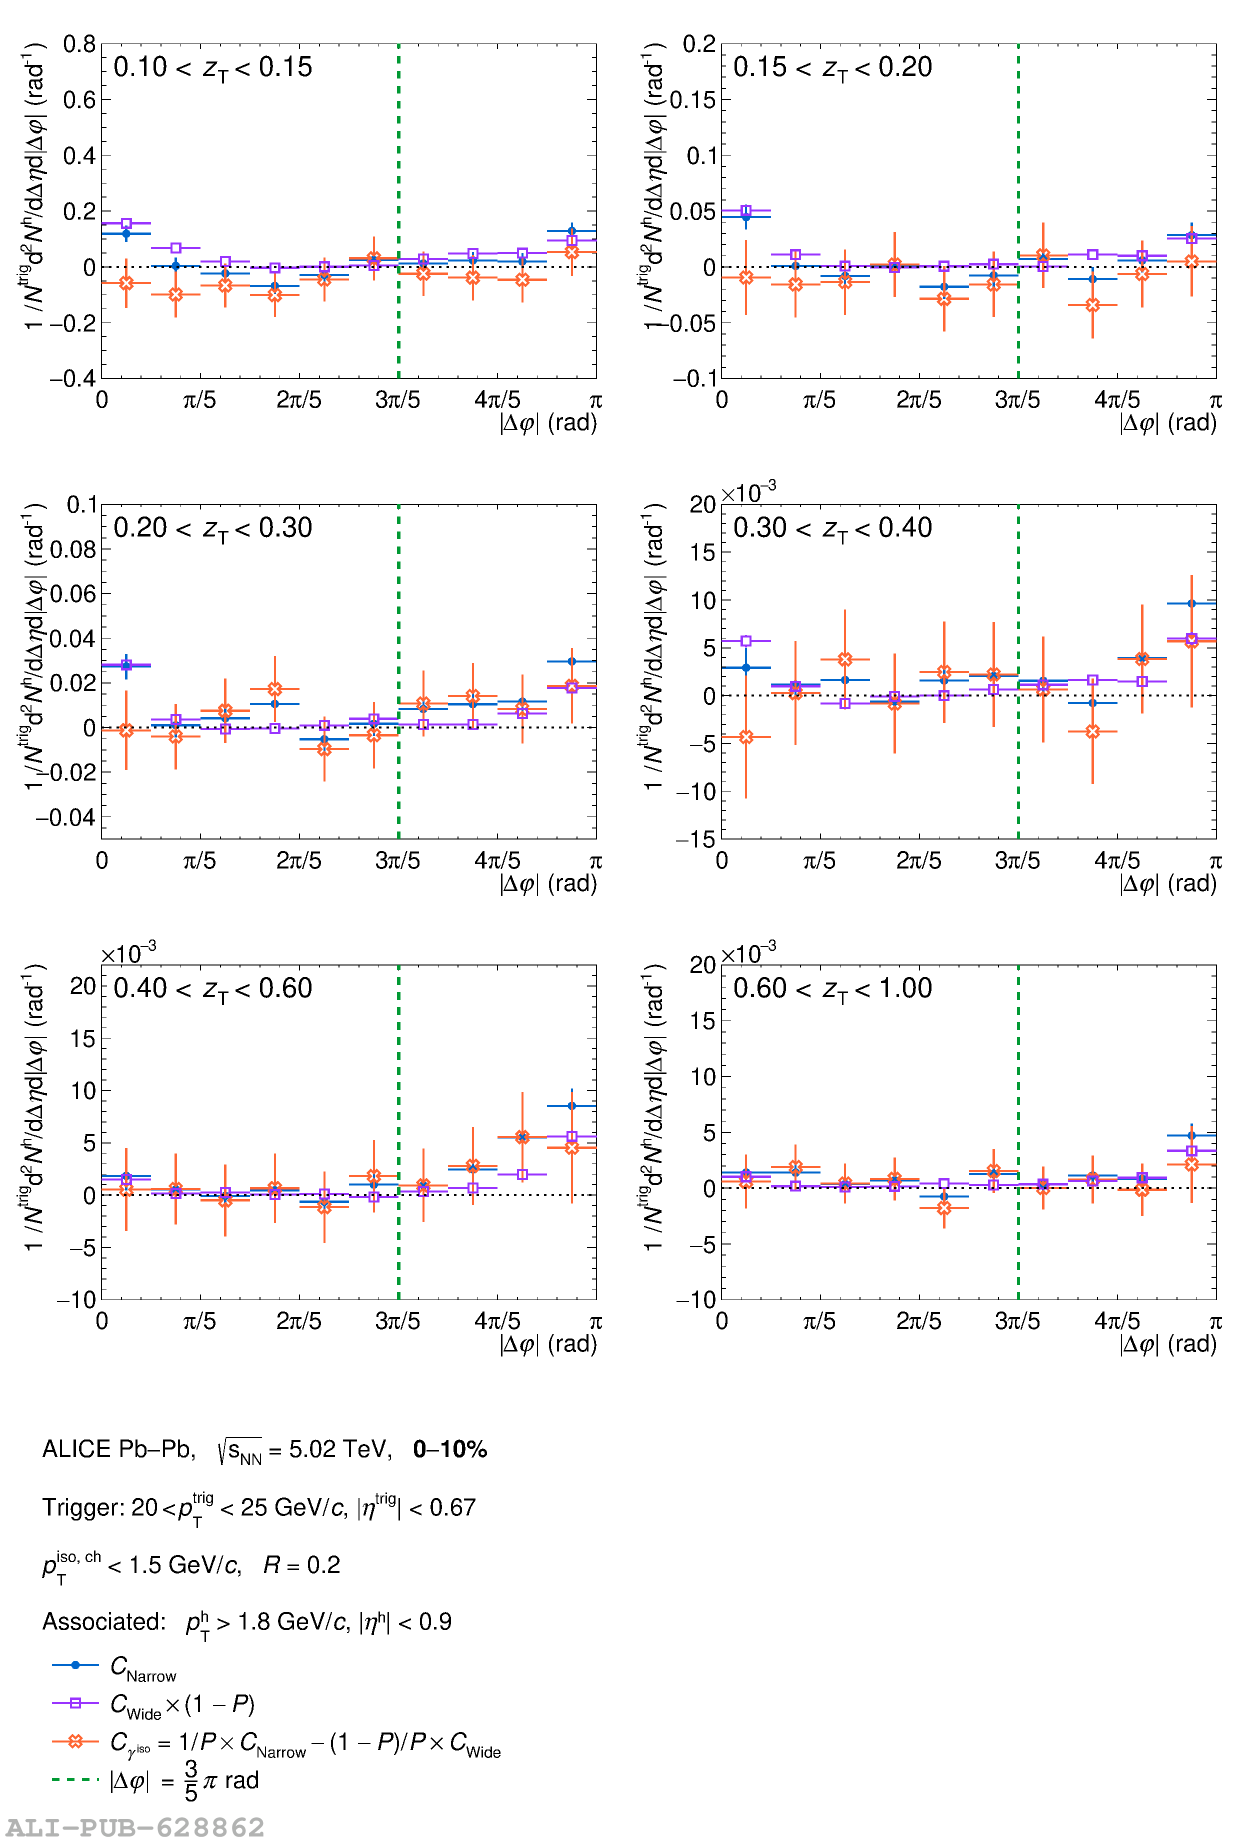 |