\ Ratio of the measured \Dzt distributions in \PbPb collision at \snnfive to the NLO pQCD predictions for \pp collisions at \sfive, \ipqcd, all distributions in denominator and numerator are shown in Fig. \ref{fig:Dzt}. Each panel shows a different centrality class: 0--30\% (left), 30--50\% (middle), and 50--90\% (right) The grey-filled boxes and vertical-black lines represent the data systematic and statistical uncertainties, respectively. The green-open boxes represent the $\mu$ scale uncertainty for the denominator NLO pQCD calculation for \pp collisions. Different theory predictions for the \iaa, which include energy loss, are shown: an NLO pQCD calculation (pink line and uncertainty band), and from a CoLBT-hydro calculation (cyan-dashed line and uncertainty band, not for peripheral collisions). Also, an NLO pQCD prediction, which includes CNM effects only (no energy loss, no centrality dependence), is reported (light orange line and uncertainty bands. | 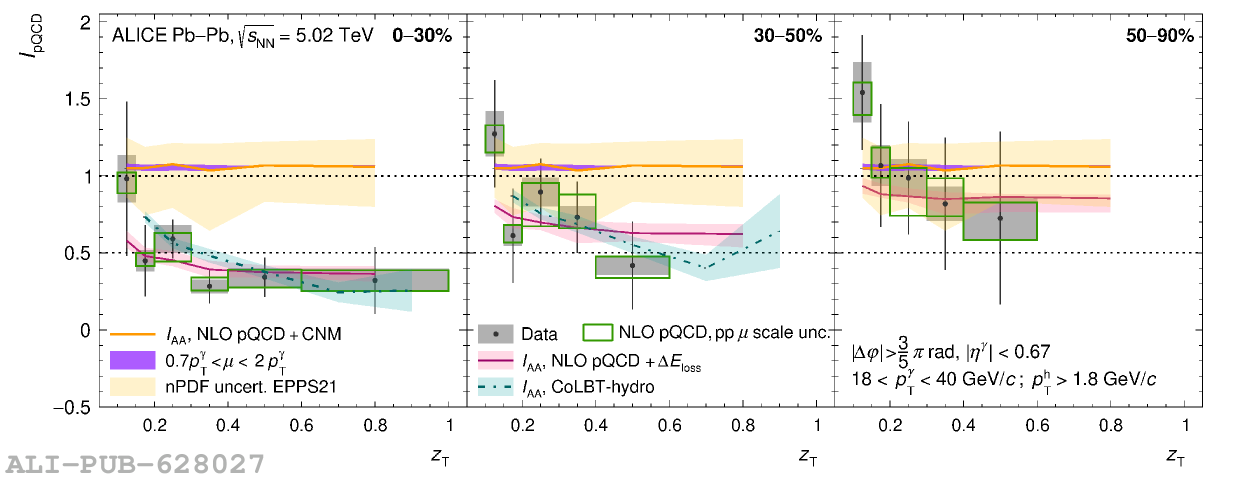 |