\ Azimuthal correlation distributions in the 30--50\% centrality class of \PbPb collisions at \snnfive for the intervals $0.20\zt0.30$ and $20$ \ptT $25$ \GeVc. Each marker corresponds to a different trigger: isolated-narrow clusters (blue-full circles), also shown in Fig. \ref{fig:DPhi_samemix}; isolated-wide clusters (violet-open squares), scaled by $1-P$, where $P$ is the purity; isolated-photon triggers (orange-empty crosses), calculated using the equation in the text The vertical bars indicate the statistical uncertainties. The dashed-green line at $|\Delta \varphi|=3/5\pi$ indicates the lower limit of the integration used in the \Dzt calculation. | 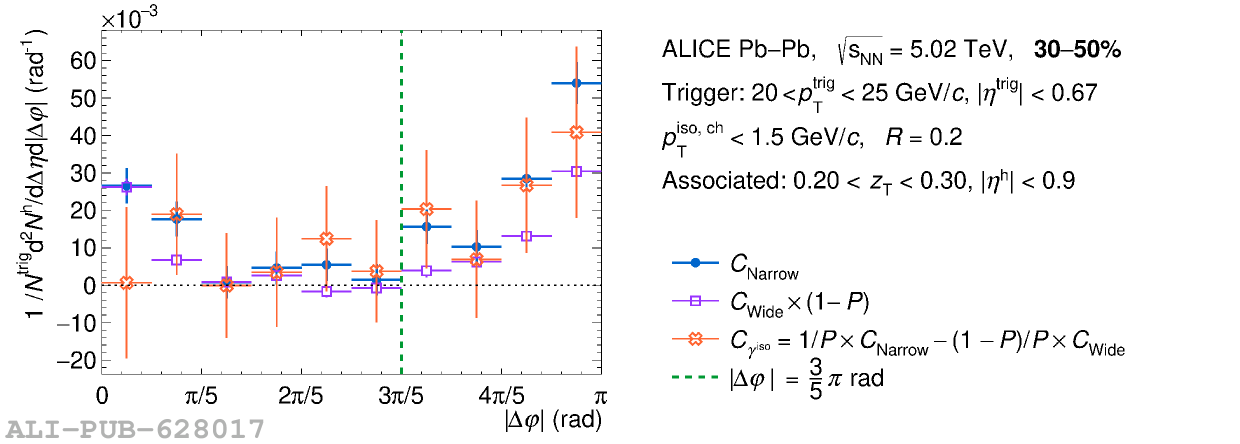 |