Self-normalized non-prompt \jpsi yields in the \pt intervals $1\pt4$ \GeVc (left column), $4\pt8$ \GeVc (middle column), and $\pt>8$ \GeVc (right column) as a function of the self-normalized charged-particle multiplicity in $|\eta|0.9$ measured in toward (top row), transverse (middle row), and away (bottom row) azimuthal regions with respect to the \jpsi momentum direction. The data are shown separately for the INEL$>$0 and V0M 0--0.1\% event classes and are compared to PYTHIA 8 simulations using different settings , as well as EPOS4HQ with and without hydrodynamics activated . The dashed grey lines represent a linear increase with slope 1. The vertical bars and boxes indicate the statistical and systematic uncertainties, respectively. | 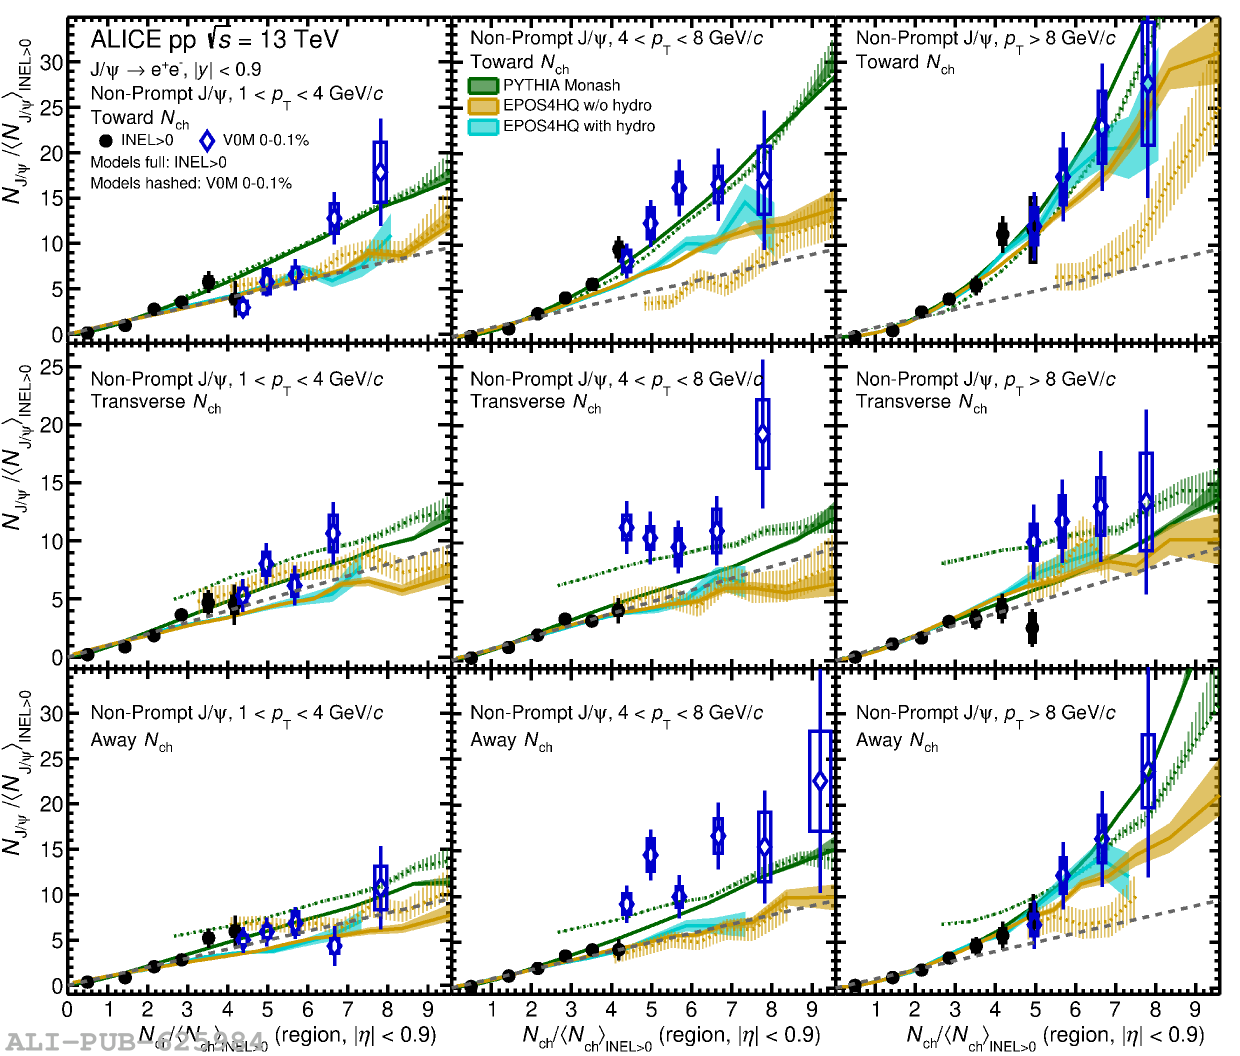 |