$\Xi$ (left) and $\Omega$ (right) $\pt$ spectra in the multiplicity class 0–0.1 % compared to predictions from different models. The data points are shown with markers, and the model predictions with lines of different styles. Error bars and boxes represent statistical and systematic uncertainties, respectively. The bottom panels show the ratios between the spectra and the model, with error bars representing total uncertainties obtained by propagating the uncertainties of both the data and the model. | 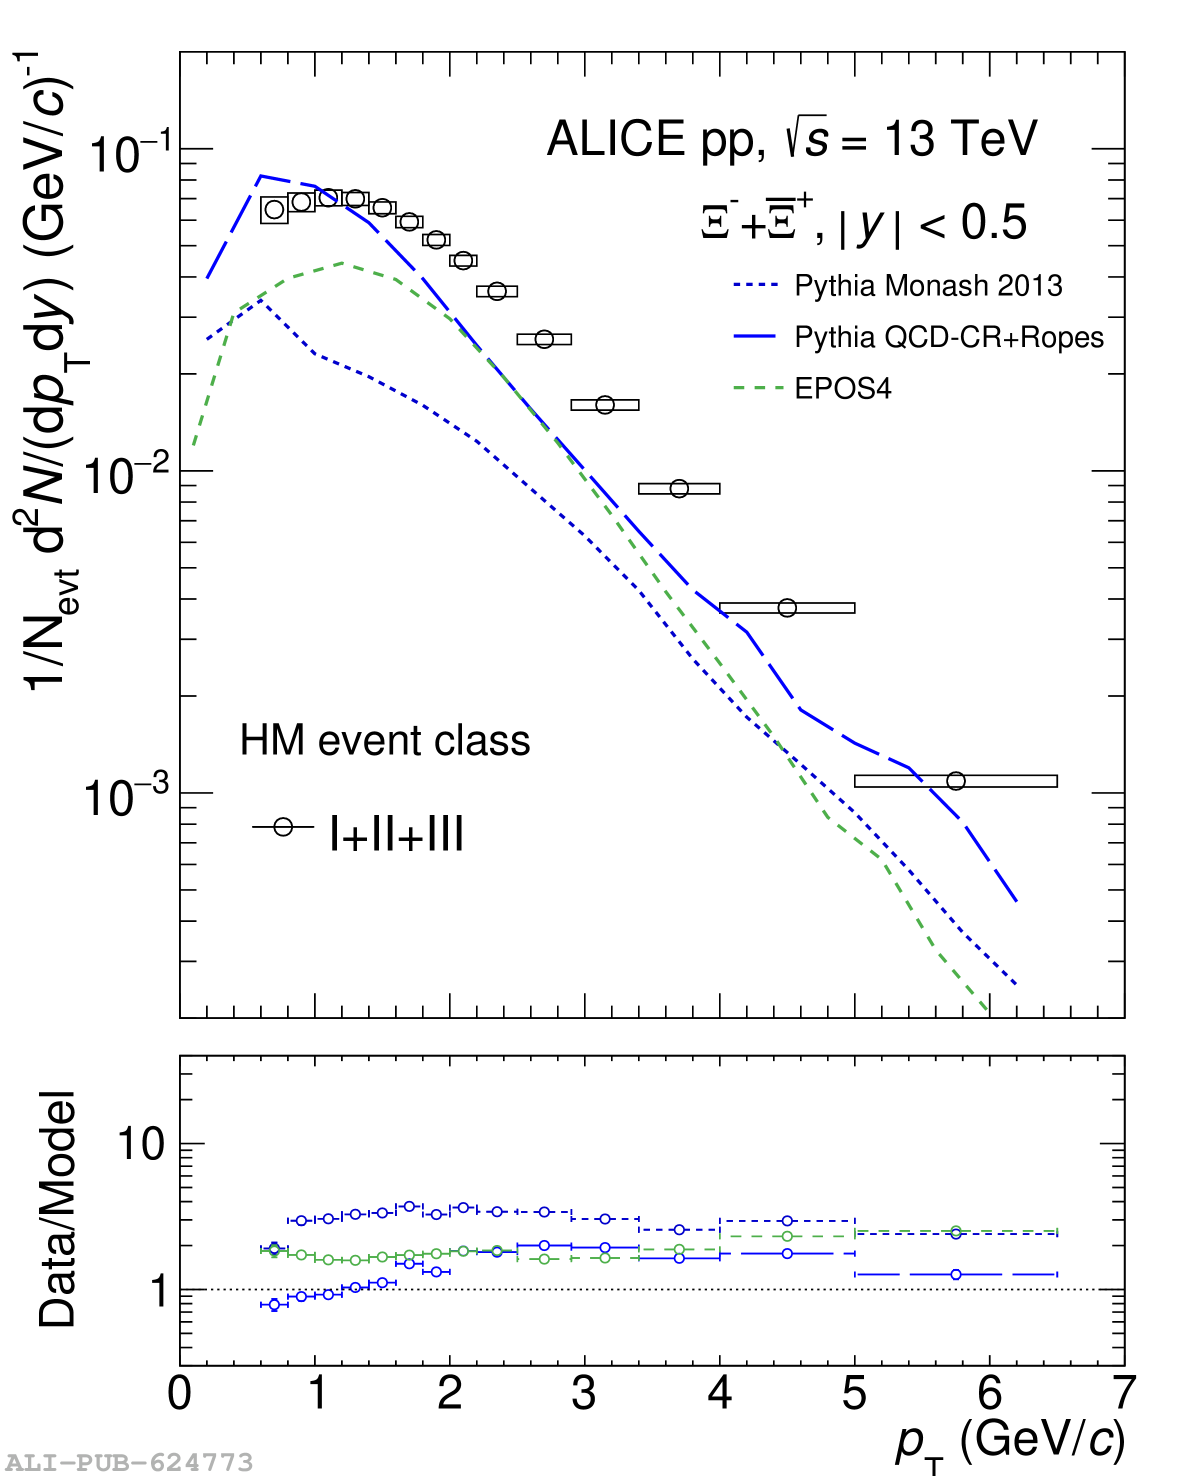 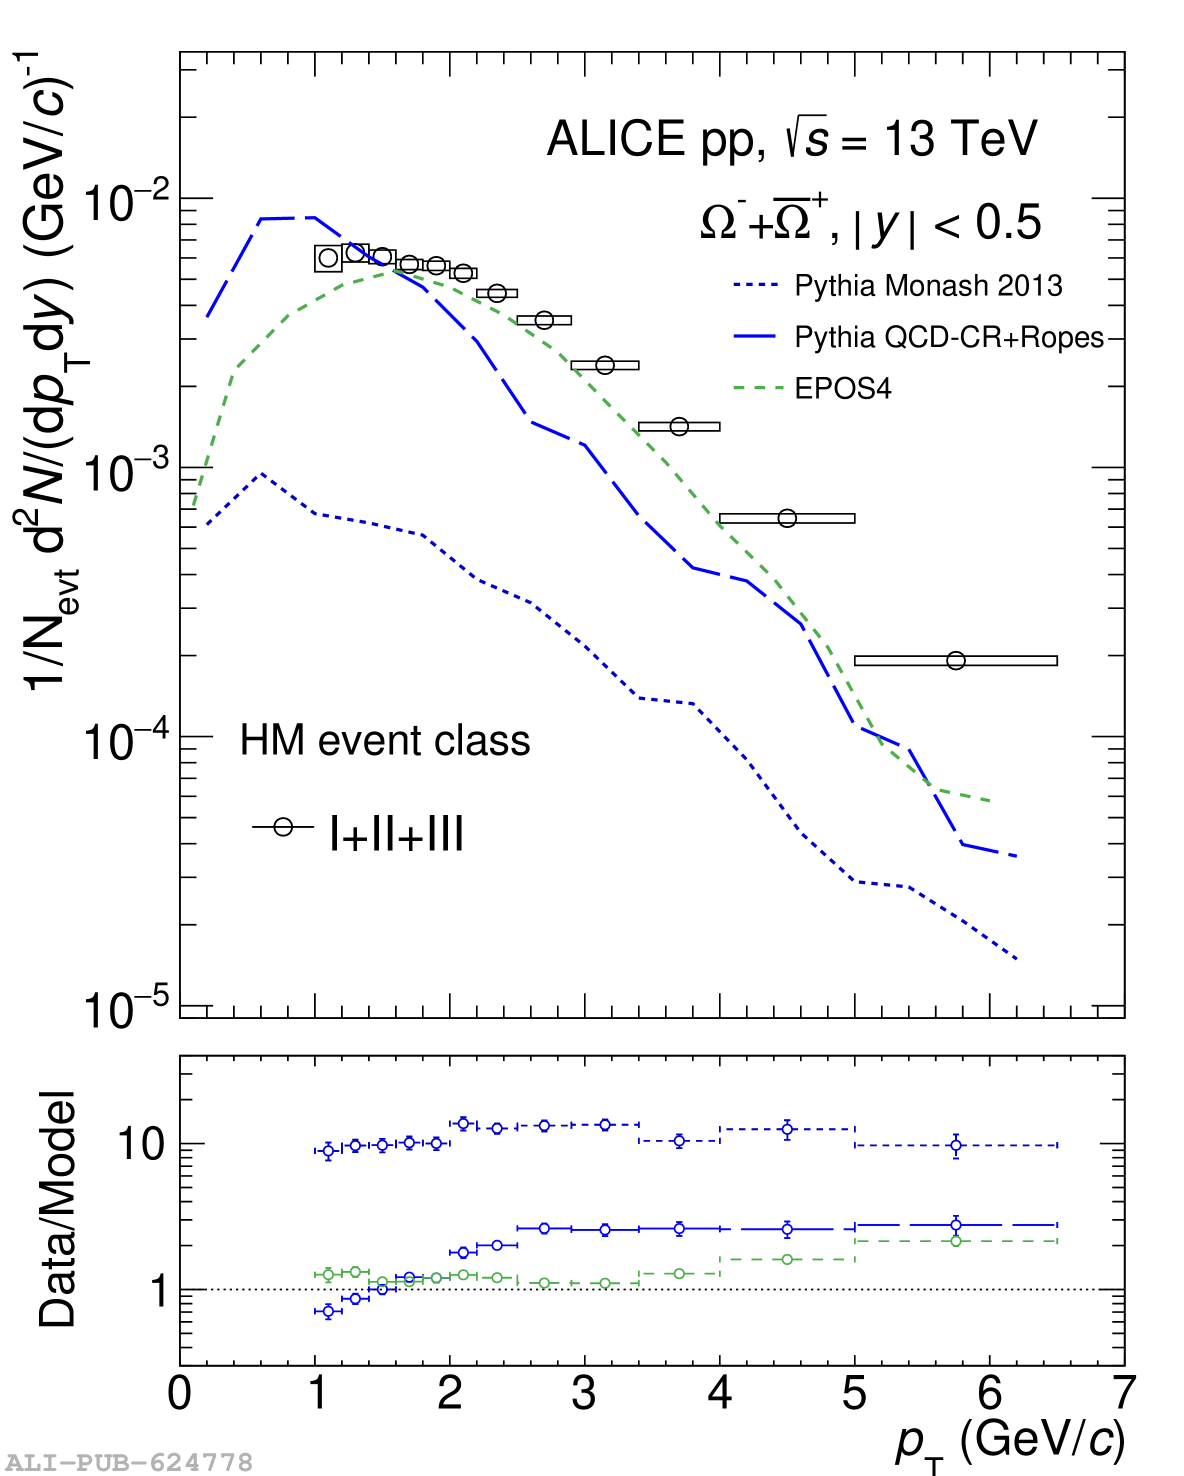 |