This paper presents the first measurements of $Ξ$ and $Ω$ hyperon yields at the highest multiplicities reached in pp collisions at $\sqrt{s} = 13$ TeV. This measurement exploits the high-multiplicity pp collisions collected by ALICE with dedicated triggers. The selected collisions are characterised by about 30 charged particles per unit of rapidity, over four times more than in minimum-bias pp collisions at the same centre-of-mass energy, and about twice as many as in minimum-bias p-Pb or very peripheral Pb-Pb collisions at similar energies. The production yields and average transverse momenta of the hyperons agree with trends indicated by previous measurements in pp collisions at lower multiplicities. The difference in average transverse momenta between pp and p-Pb collisions, observed with the new high-multiplicity pp data, provides additional insight into the underlying particle production mechanisms in small systems. The results support a strong correlation between multi-strange hadron production and final-state multiplicity regardless of the collision system at the LHC energies, extending this observation to the highest multiplicity reached in pp collisions. The comparison with several state-of-the-art models (Pythia8.2 with the Monash 2013 tune, Pythia8.2 with Ropes, and EPOS4) suggests that the description of strange-hadron production is improved by recently introduced features such as interactions between overlapping strings in Pythia8.2 with Ropes and the collective expansion of high-density string regions in EPOS4.
Submitted to: EPJC
e-Print: arXiv:2603.19374 | PDF | inSPIRE
CERN-EP-2026-062
Figure group
Figure 1
$\Xi$ (left) and $\Omega$ (right) $\pt$ spectra fitted with the Lévy-Tsallis function. Different colours refer to different multiplicity classes. The spectra are scaled by different factors to improve the visibility. The bottom panels display the ratios to the spectrum measured in the 0–0.1 % multiplicity class. Error bars and boxes represent statistical and systematic uncertainties, respectively. | 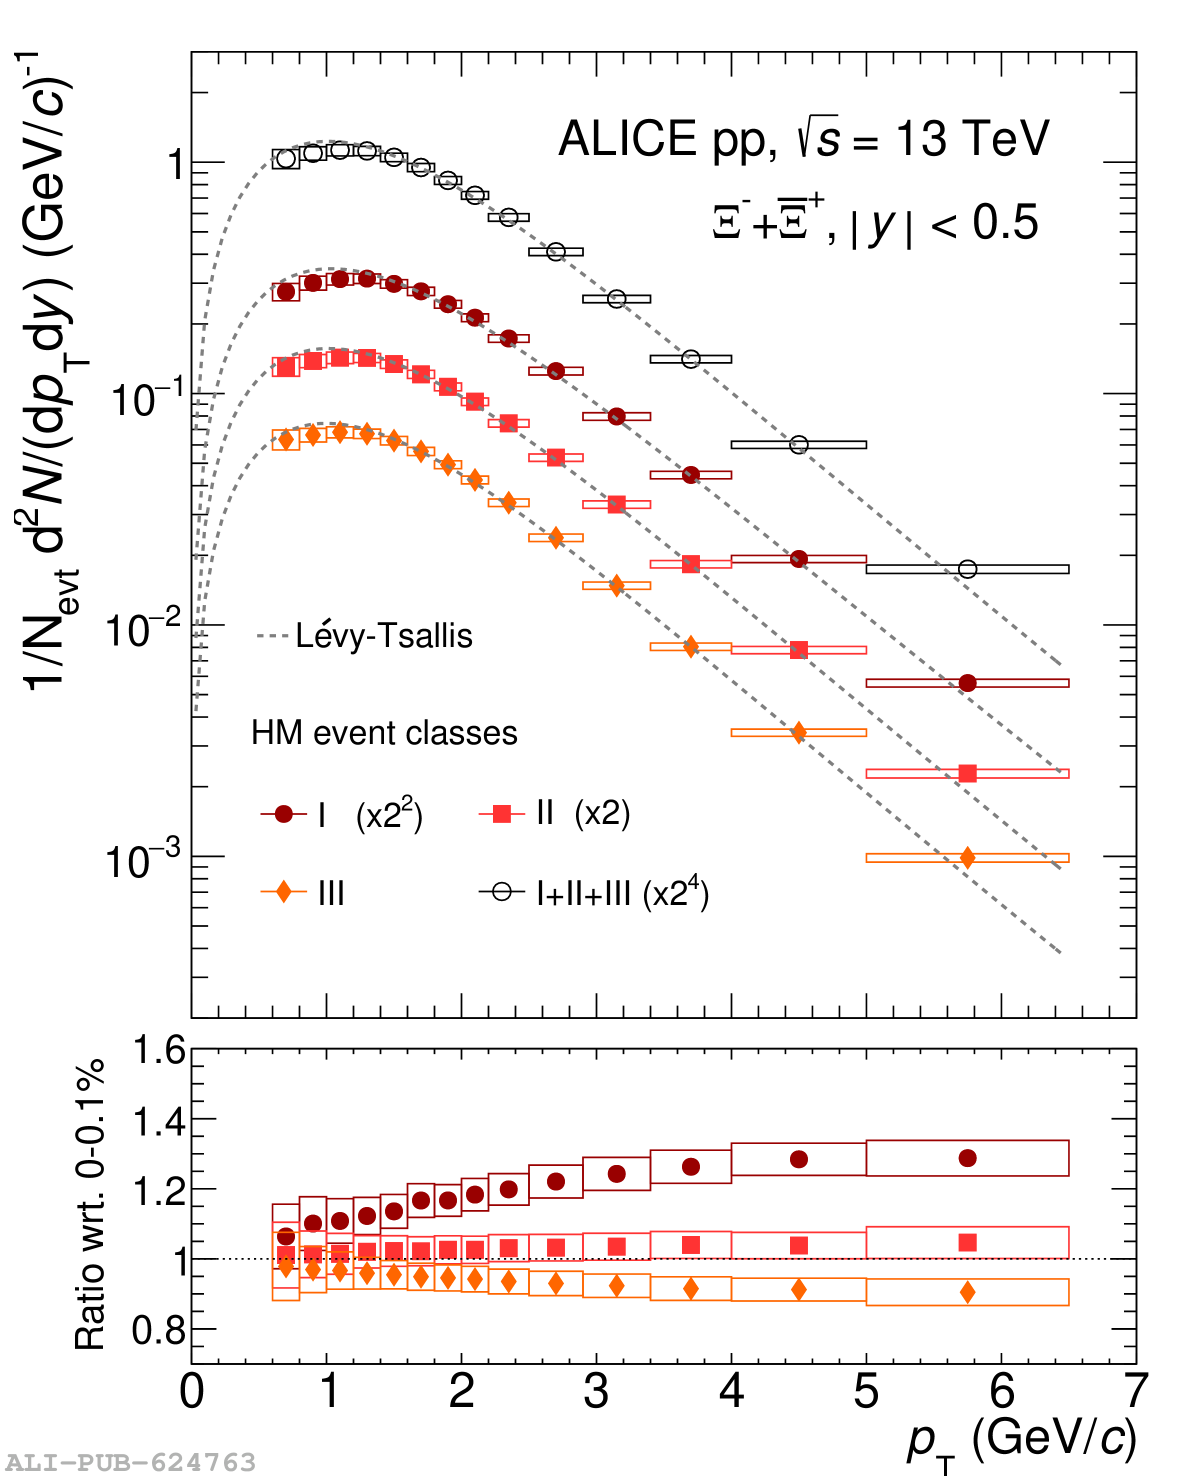 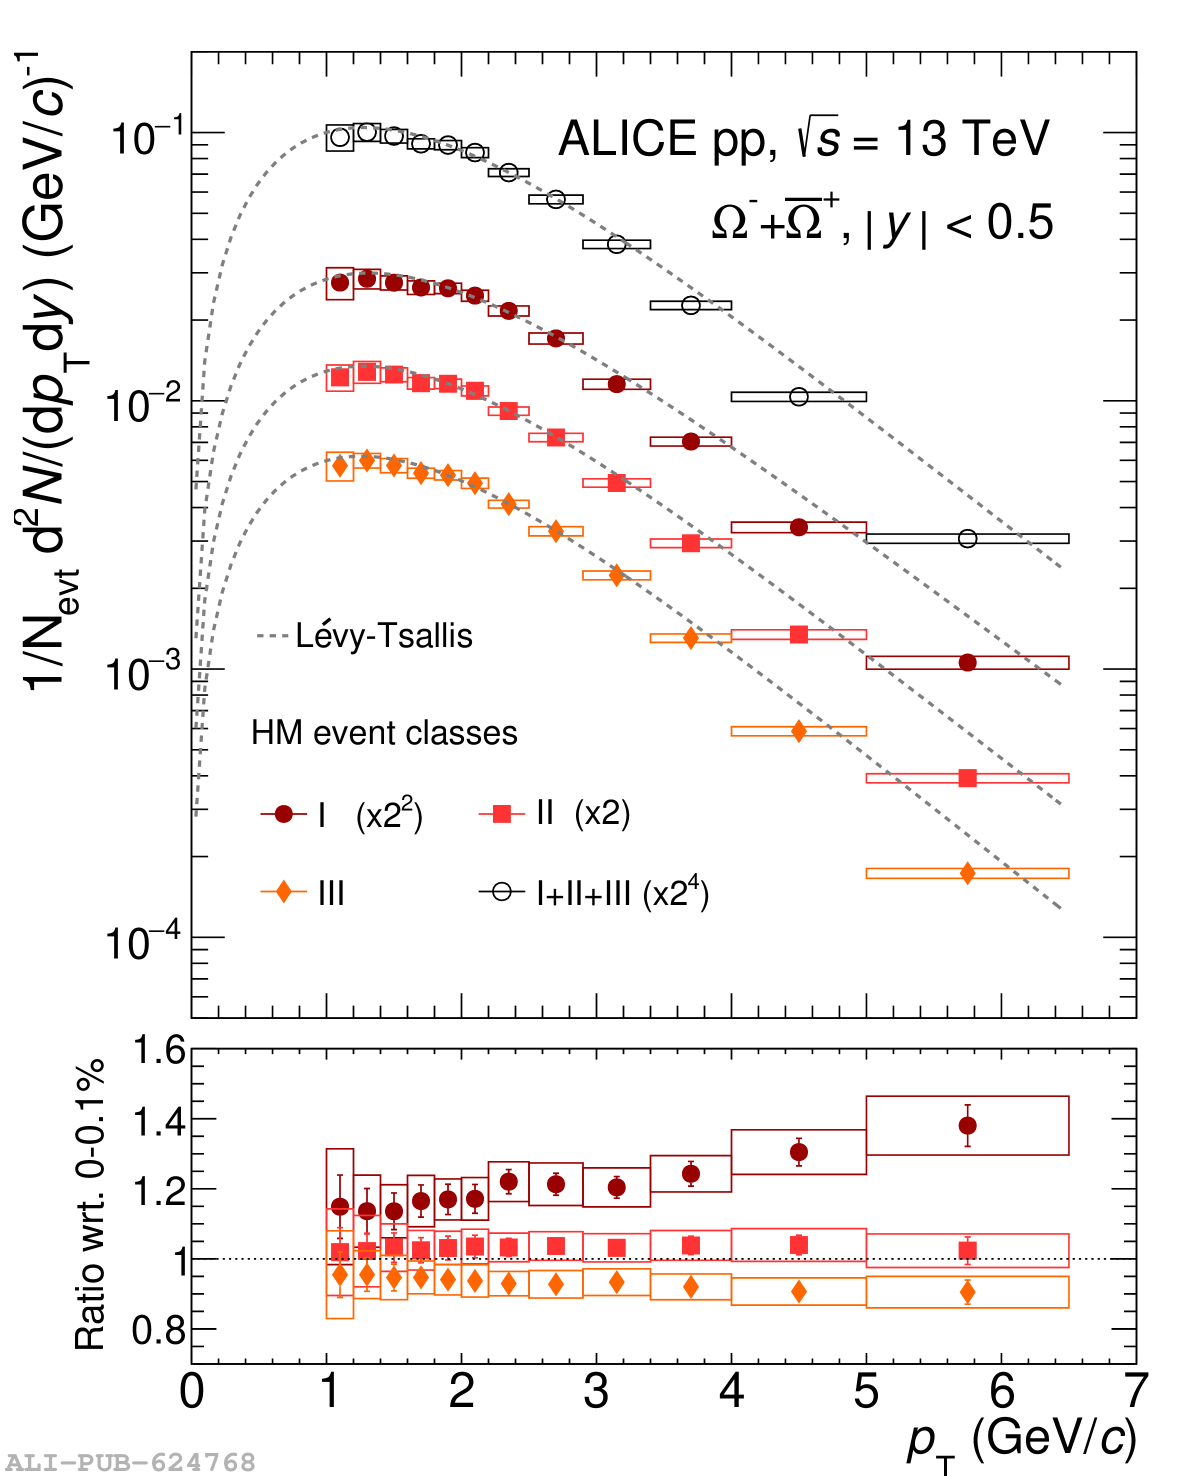 |
Figure 2
$\Xi$ (left) and $\Omega$ (right) $\pt$ spectra in the multiplicity class 0–0.1 % compared to predictions from different models. The data points are shown with markers, and the model predictions with lines of different styles. Error bars and boxes represent statistical and systematic uncertainties, respectively. The bottom panels show the ratios between the spectra and the model, with error bars representing total uncertainties obtained by propagating the uncertainties of both the data and the model. | 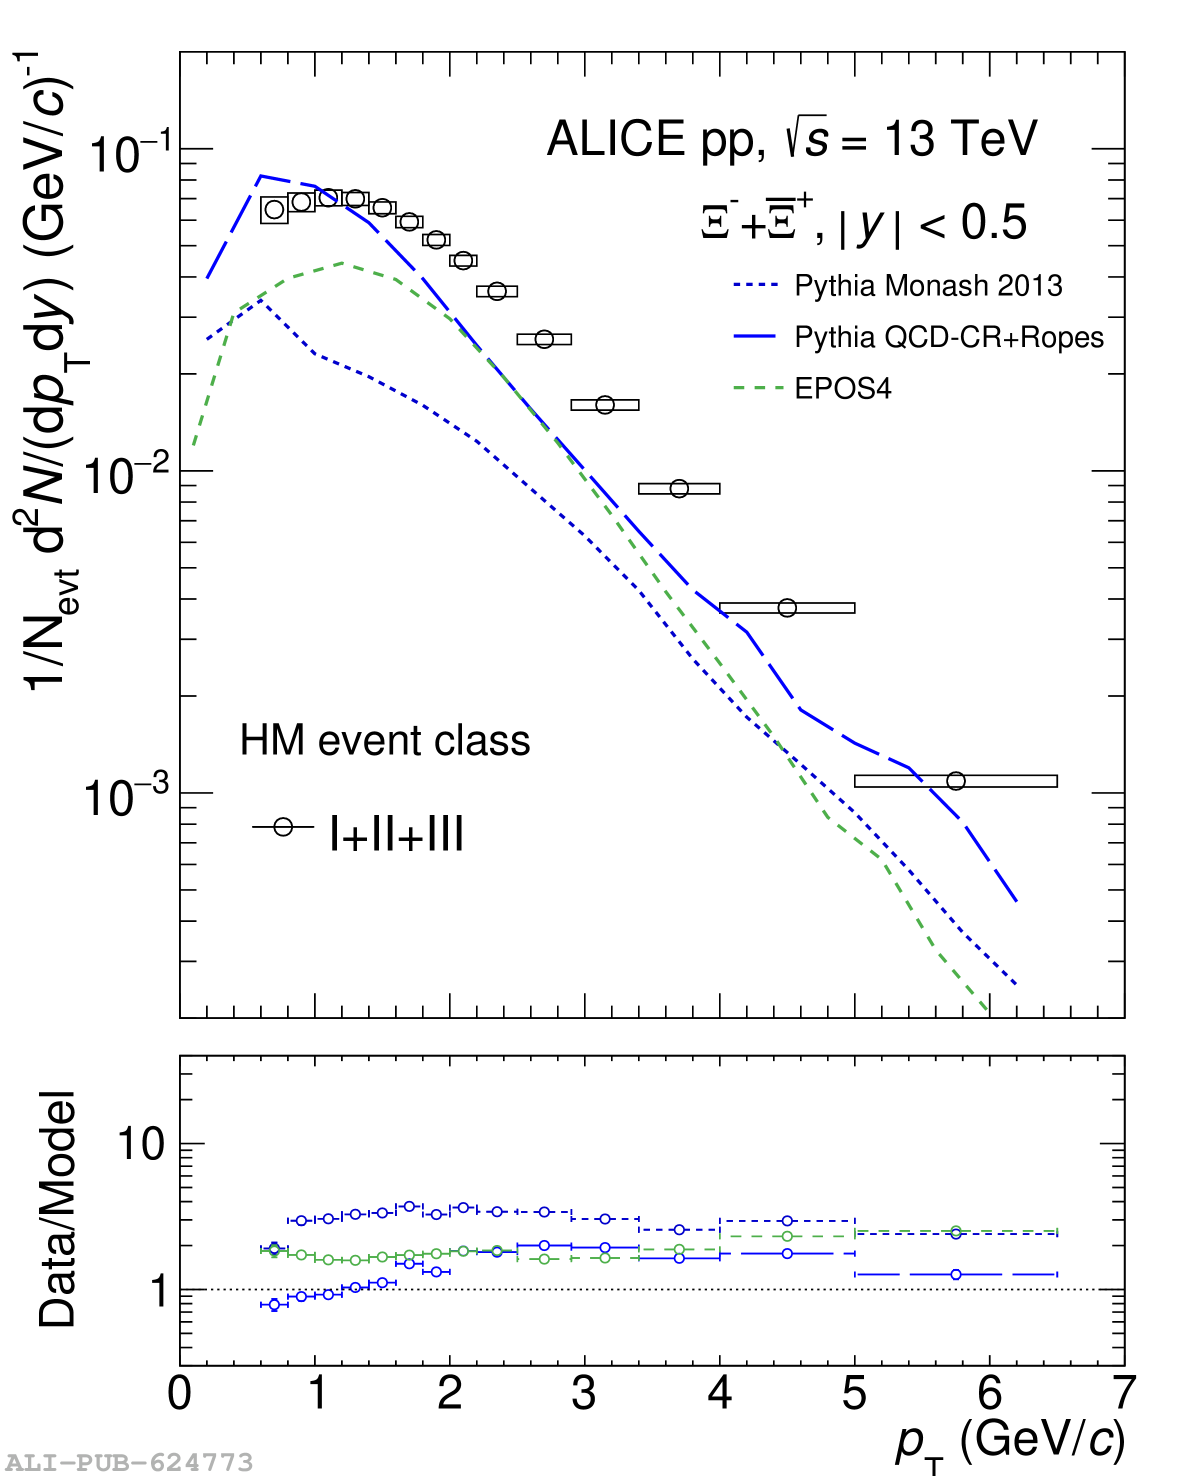 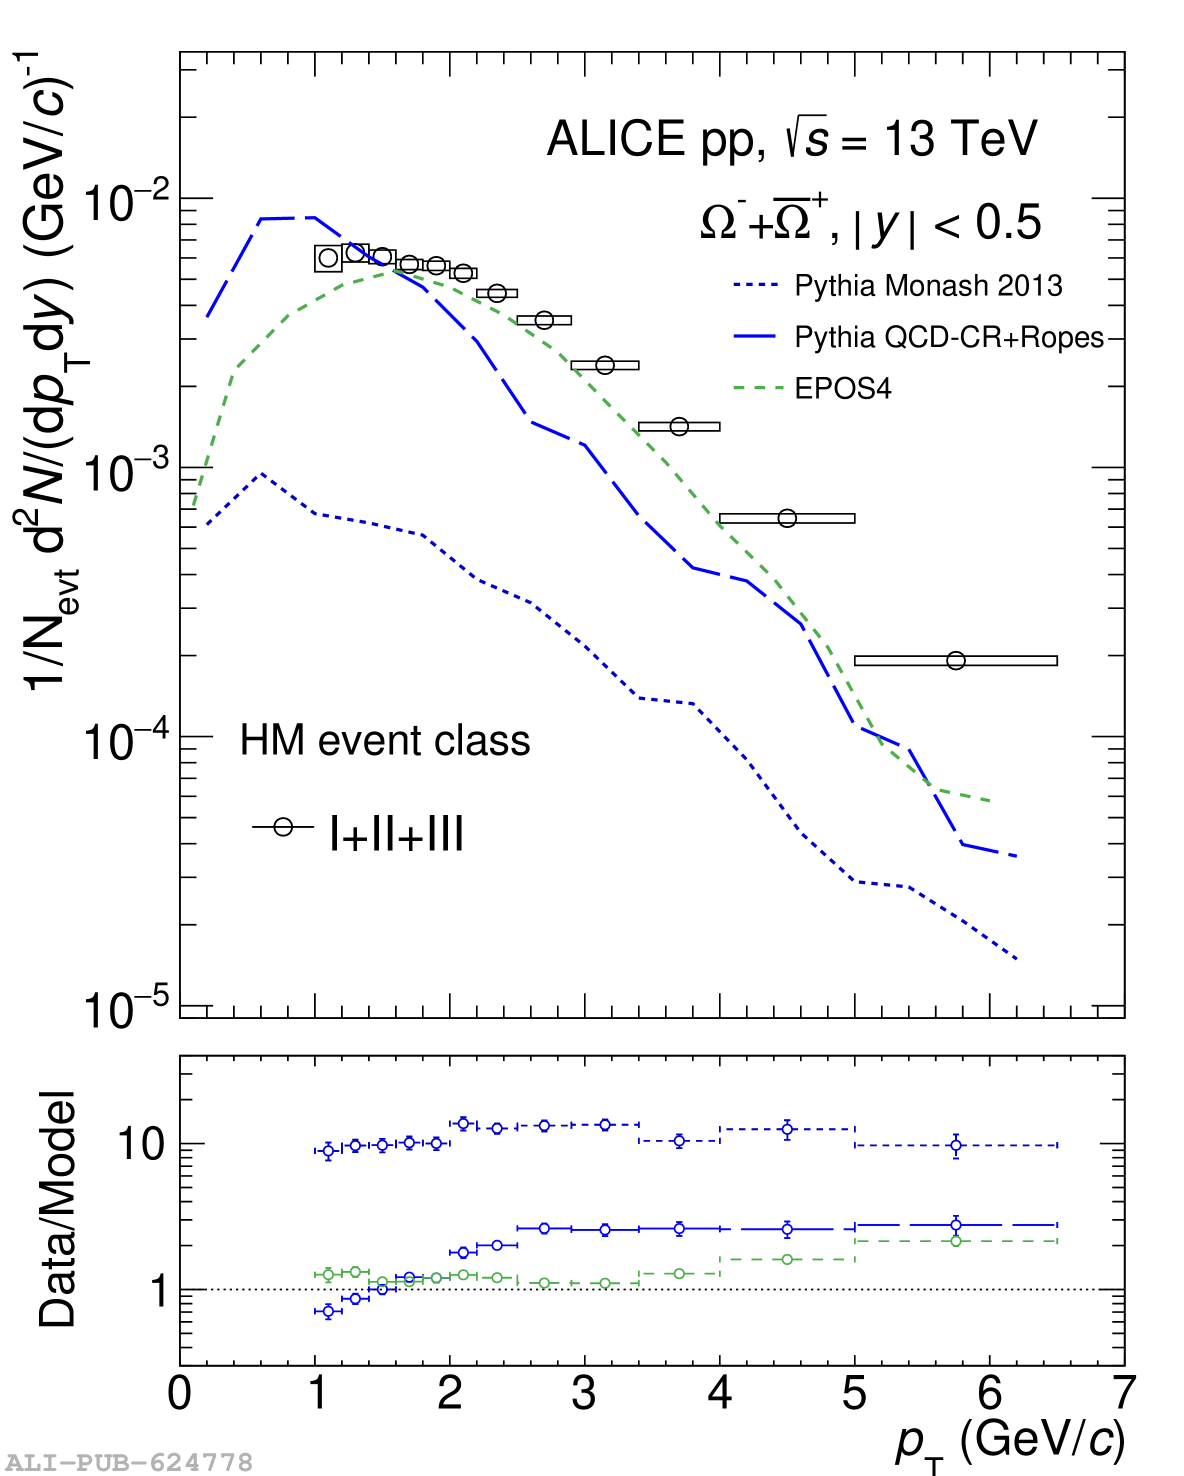 |
Figure 3
$\Xi$ (left) and $\Omega$ (right) mean $\pt$ (⟨$\pt$⟩) as a function of charged-particle multiplicity measured at midrapidity in pp, p–Pb and Pb–Pb collisions, as indicated in the legend. The red markers show the results in the three HM classes presented in this article. Error bars and boxes represent statistical and systematic uncertainties, respectively. | 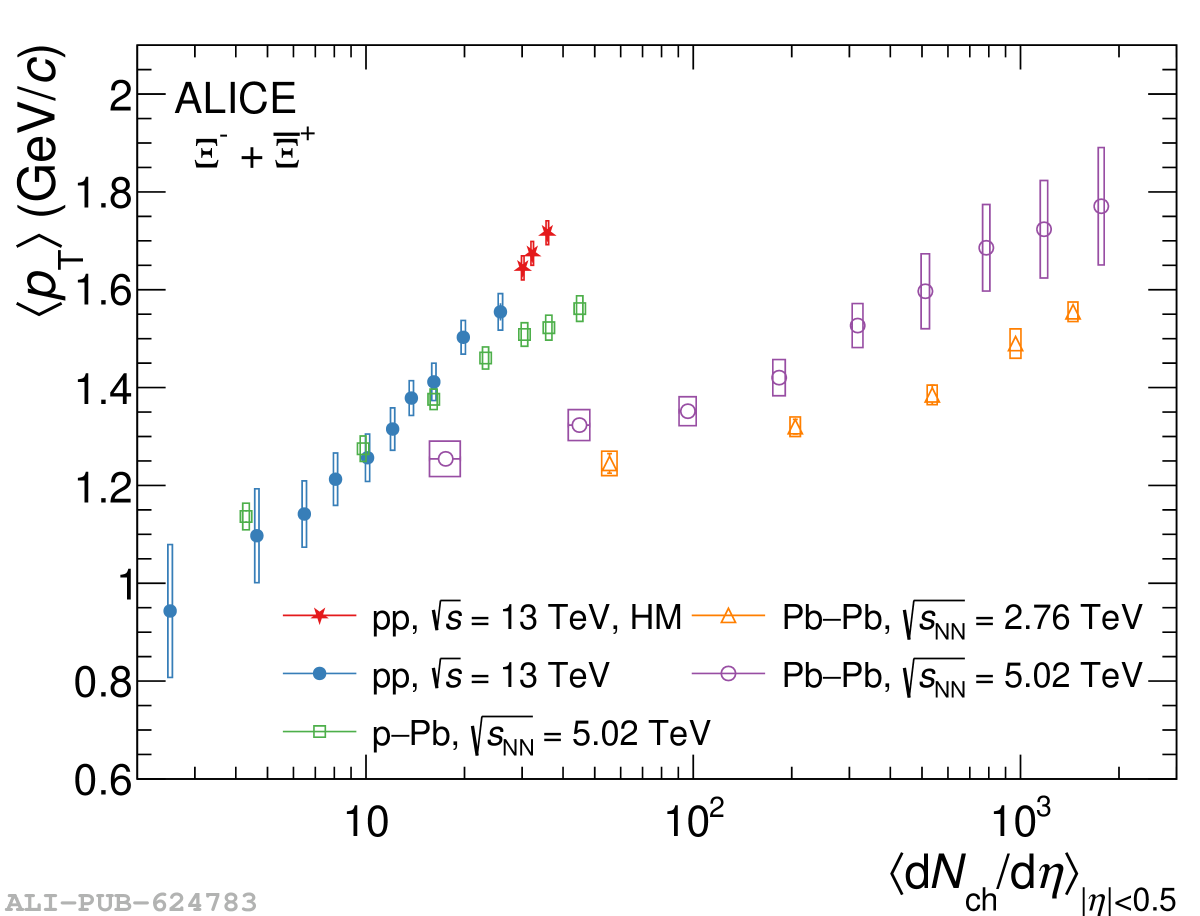 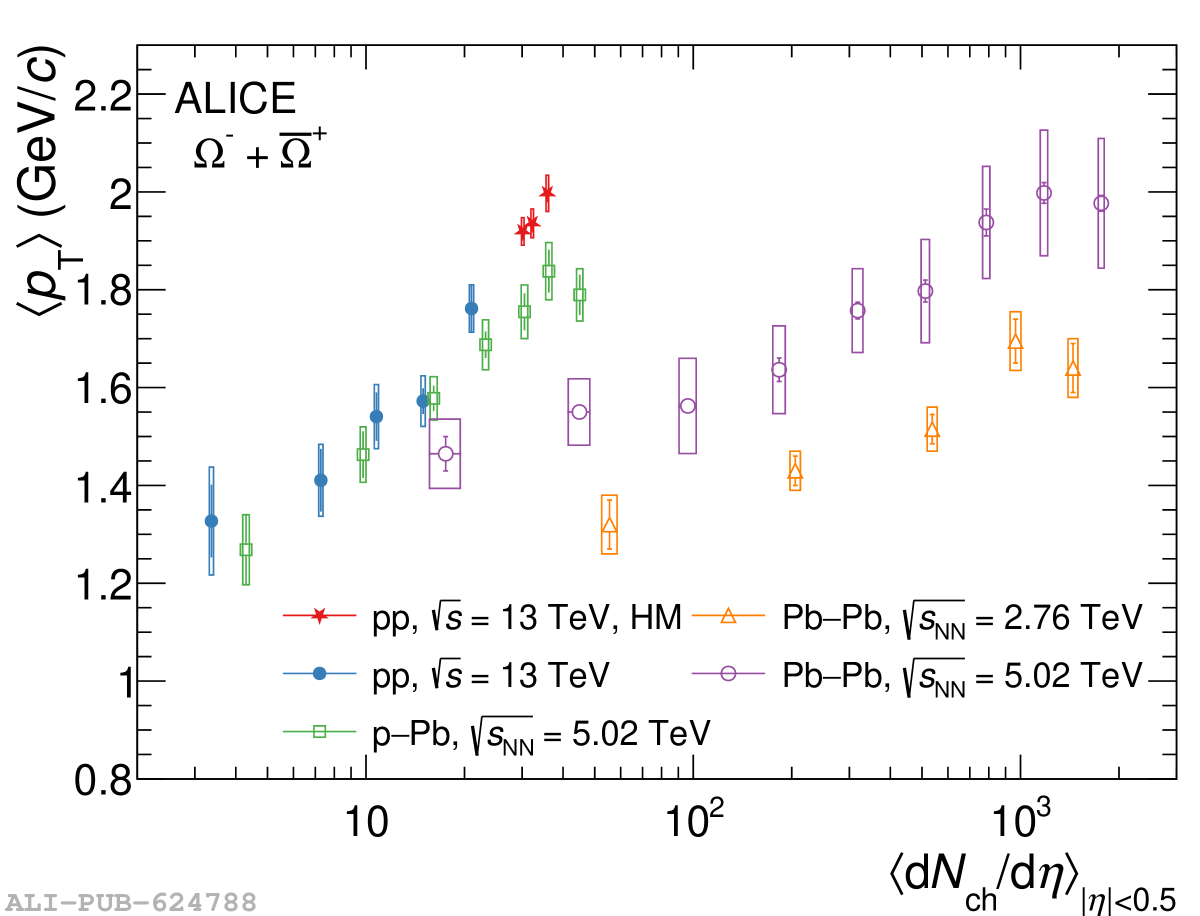 |
Figure 4
$\Xi$ (left) and $\Omega$ (right) mean $\pt$ (⟨$\pt$⟩) as a function of charged-particle multiplicity measured at midrapidity in pp collisions, compared to models. The red markers show the results in the three HM classes presented in this article. Error bars and boxes represent statistical and systematic uncertainties, respectively. | 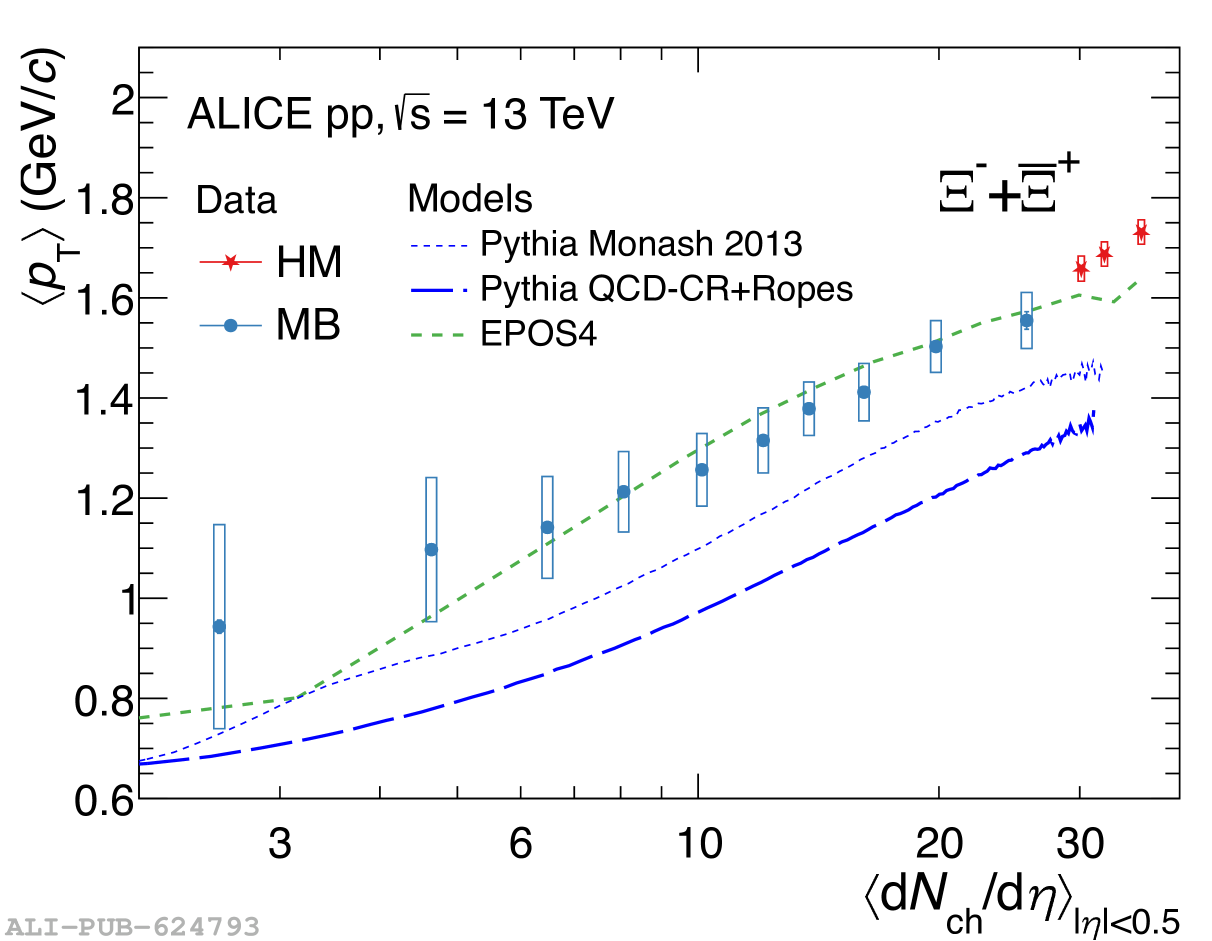 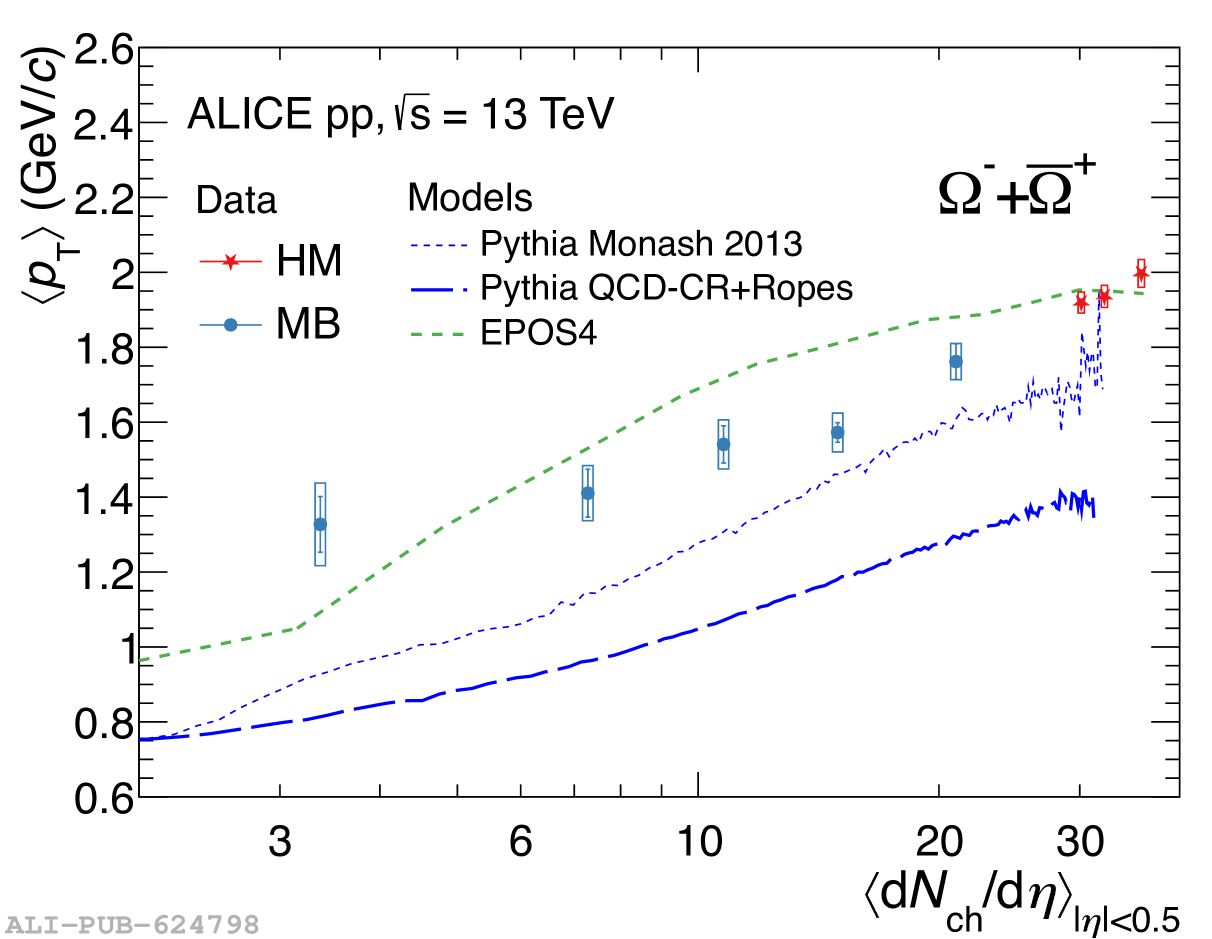 |
Figure 5
$\Xi$ and $\Omega$ $\pt$-integrated yields per event as a function of charged-particle multiplicity measured at midrapidity in pp, p–Pb and Pb–Pb collisions, as indicated in the legend. The red markers show the results in the three HM classes presented in this article. Error bars and boxes represent statistical and systematic uncertainties, respectively. | 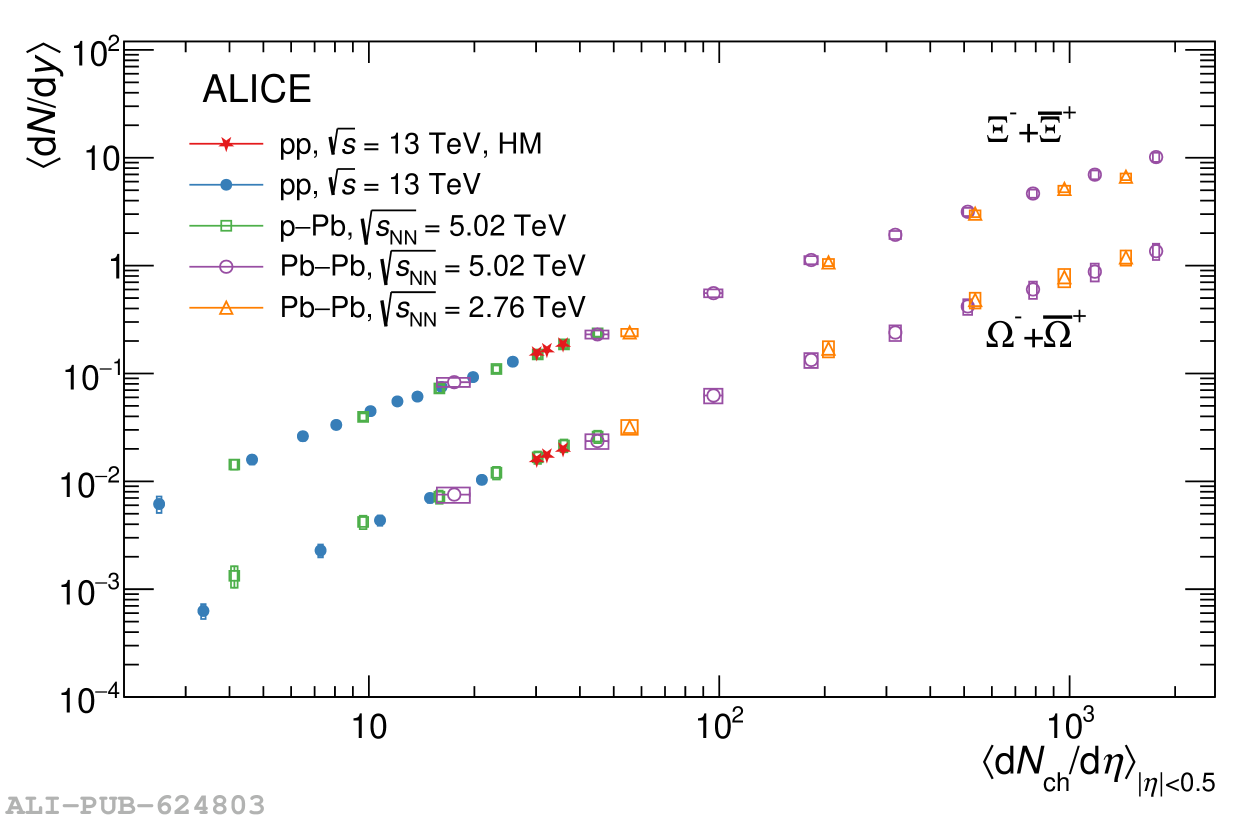 |
Figure 6
$\Xi$ and $\Omega$ $\pt$-integrated yields per event as a function of charged-particle multiplicity measured at midrapidity in pp collision, compared to models. The red markers show the results in the three HM classes presented in this article. Error bars and boxes represent statistical and systematic uncertainties, respectively. | 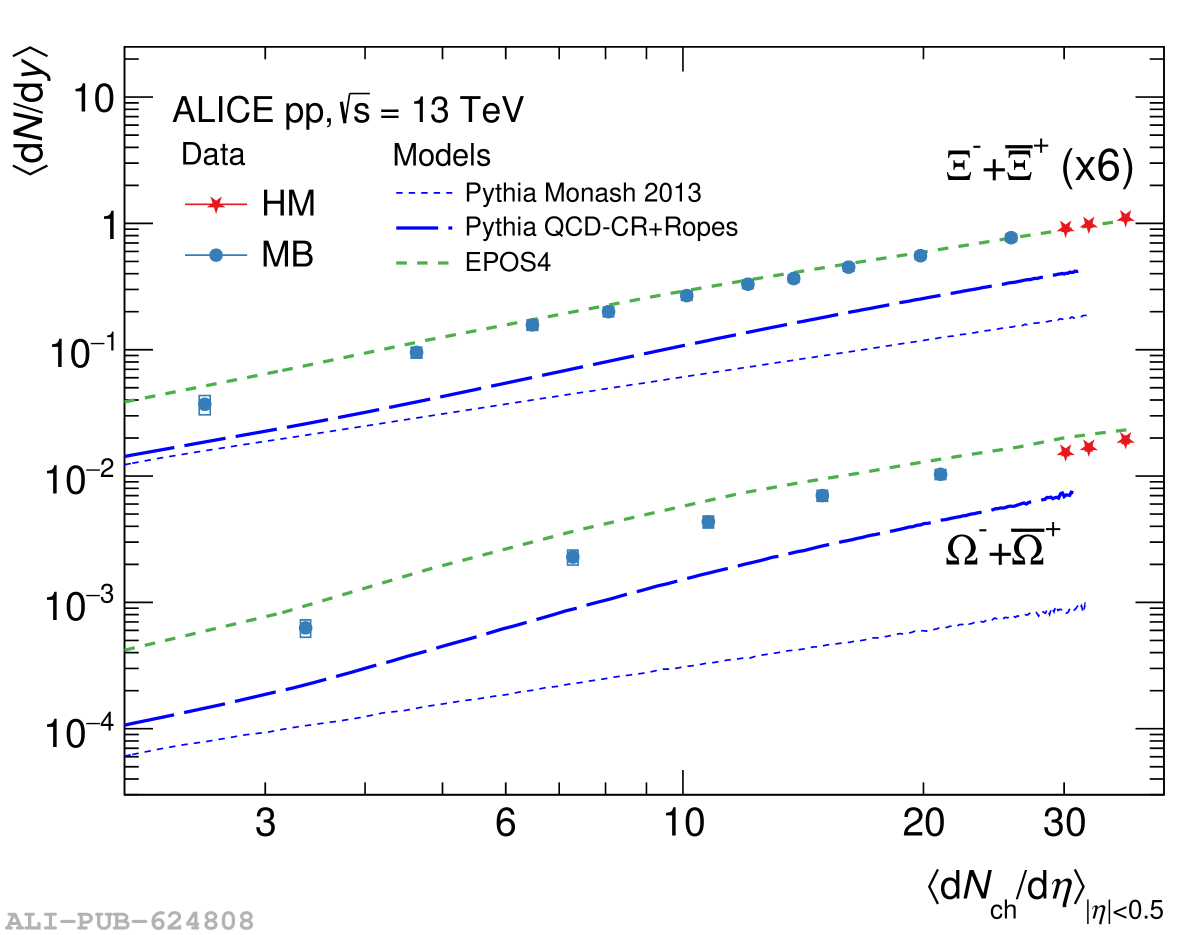 |
Figure 7
$\Xi/\pi$ and $\Omega/\pi$ ratios as a function of charged-particle multiplicity measured at midrapidity in pp, p–Pb and Pb–Pb collisions, as indicated in the legend. The red markers show the results in the three HM classes presented in this article. Error bars and boxes represent statistical and systematic uncertainties, respectively. | 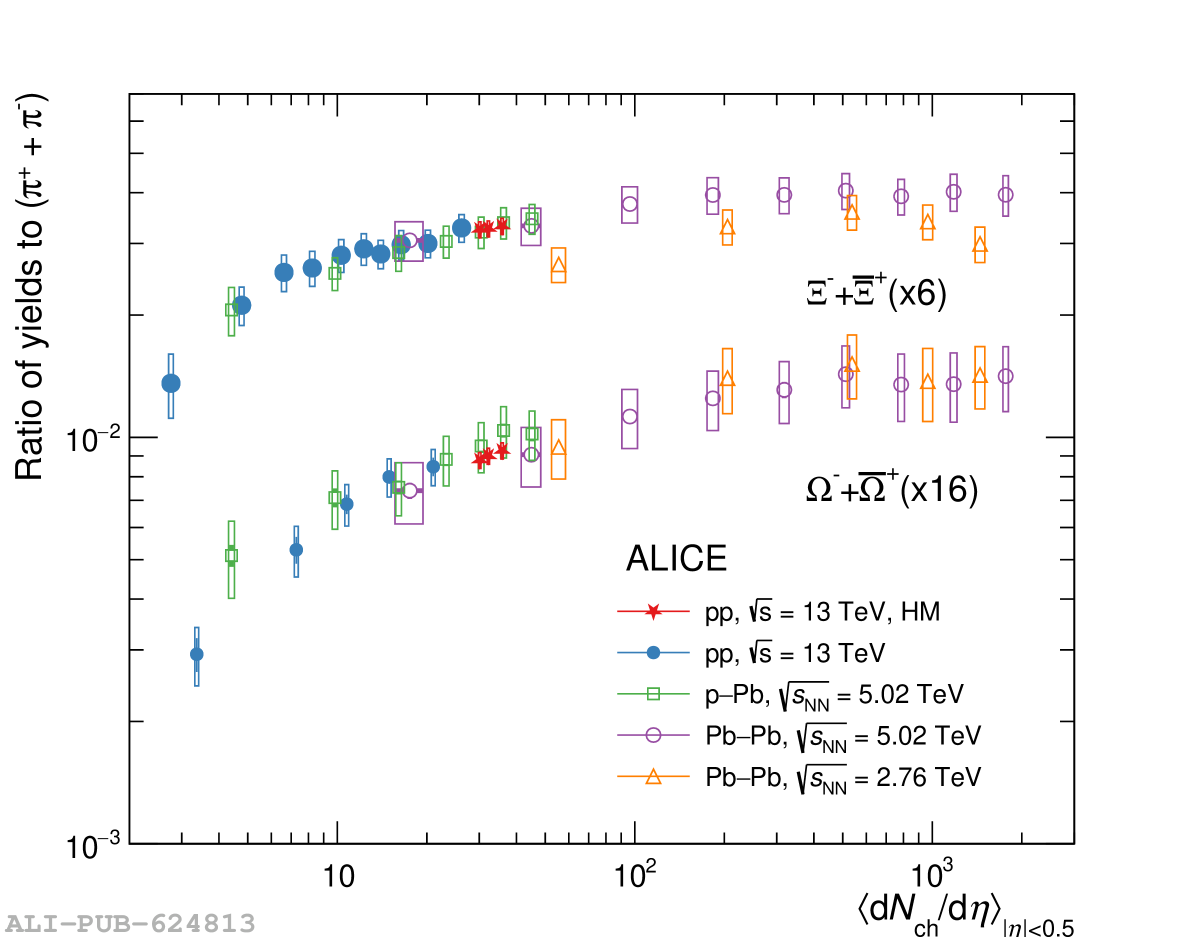 |
Figure 8
$\Xi/\pi$ and $\Omega/\pi$ ratios as a function of charged-particle multiplicity measured at midrapidity in pp collisions, compared to models. The red markers show the results in the three HM classes presented in this article. The data points are shown with markers, and the model predictions are drawn with lines of different styles, as indicated in the legend. Error bars and boxes represent statistical and systematic uncertainties, respectively. | 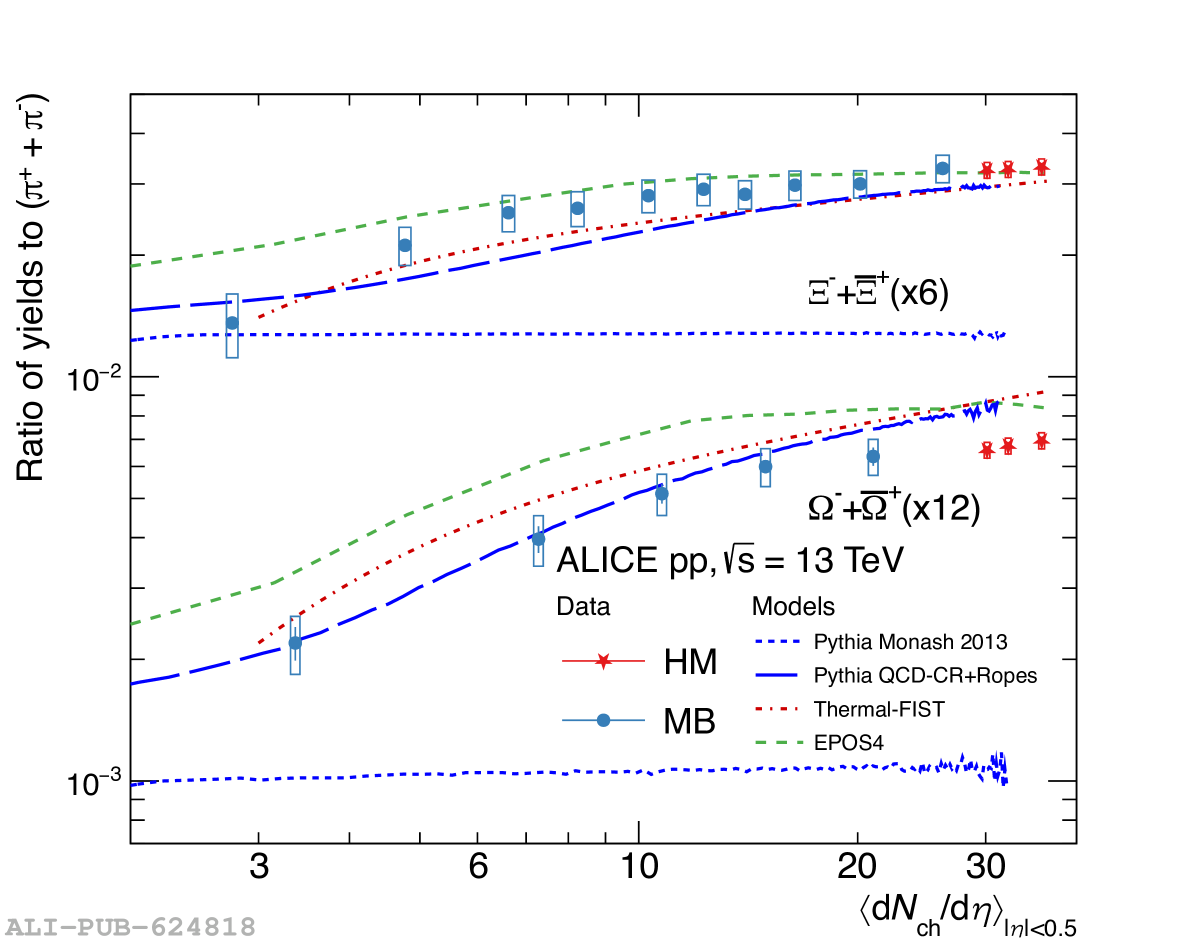 |