The experimental correlation function of p$-\pi^+$ pairs as a function of the pair relative momentum $k^*$ in several intervals of the pair $m_{\rm T}$: (a) $[0.54, 0.75)$ GeV/$c^2$, (b) $[0.75, 0.95)$ GeV/$c^2$, (c) $[0.95, 1.2)$ GeV/$c^2$, (d) $[1.2, 1.5)$ GeV/$c^2$, (e) $[1.5, 2.0)$ GeV/$c^2$, and (f) $[2.0, 2.5)$ GeV/$c^2$. The lines and boxes show the statistical and systematic uncertainties of the experimental data, respectively. | 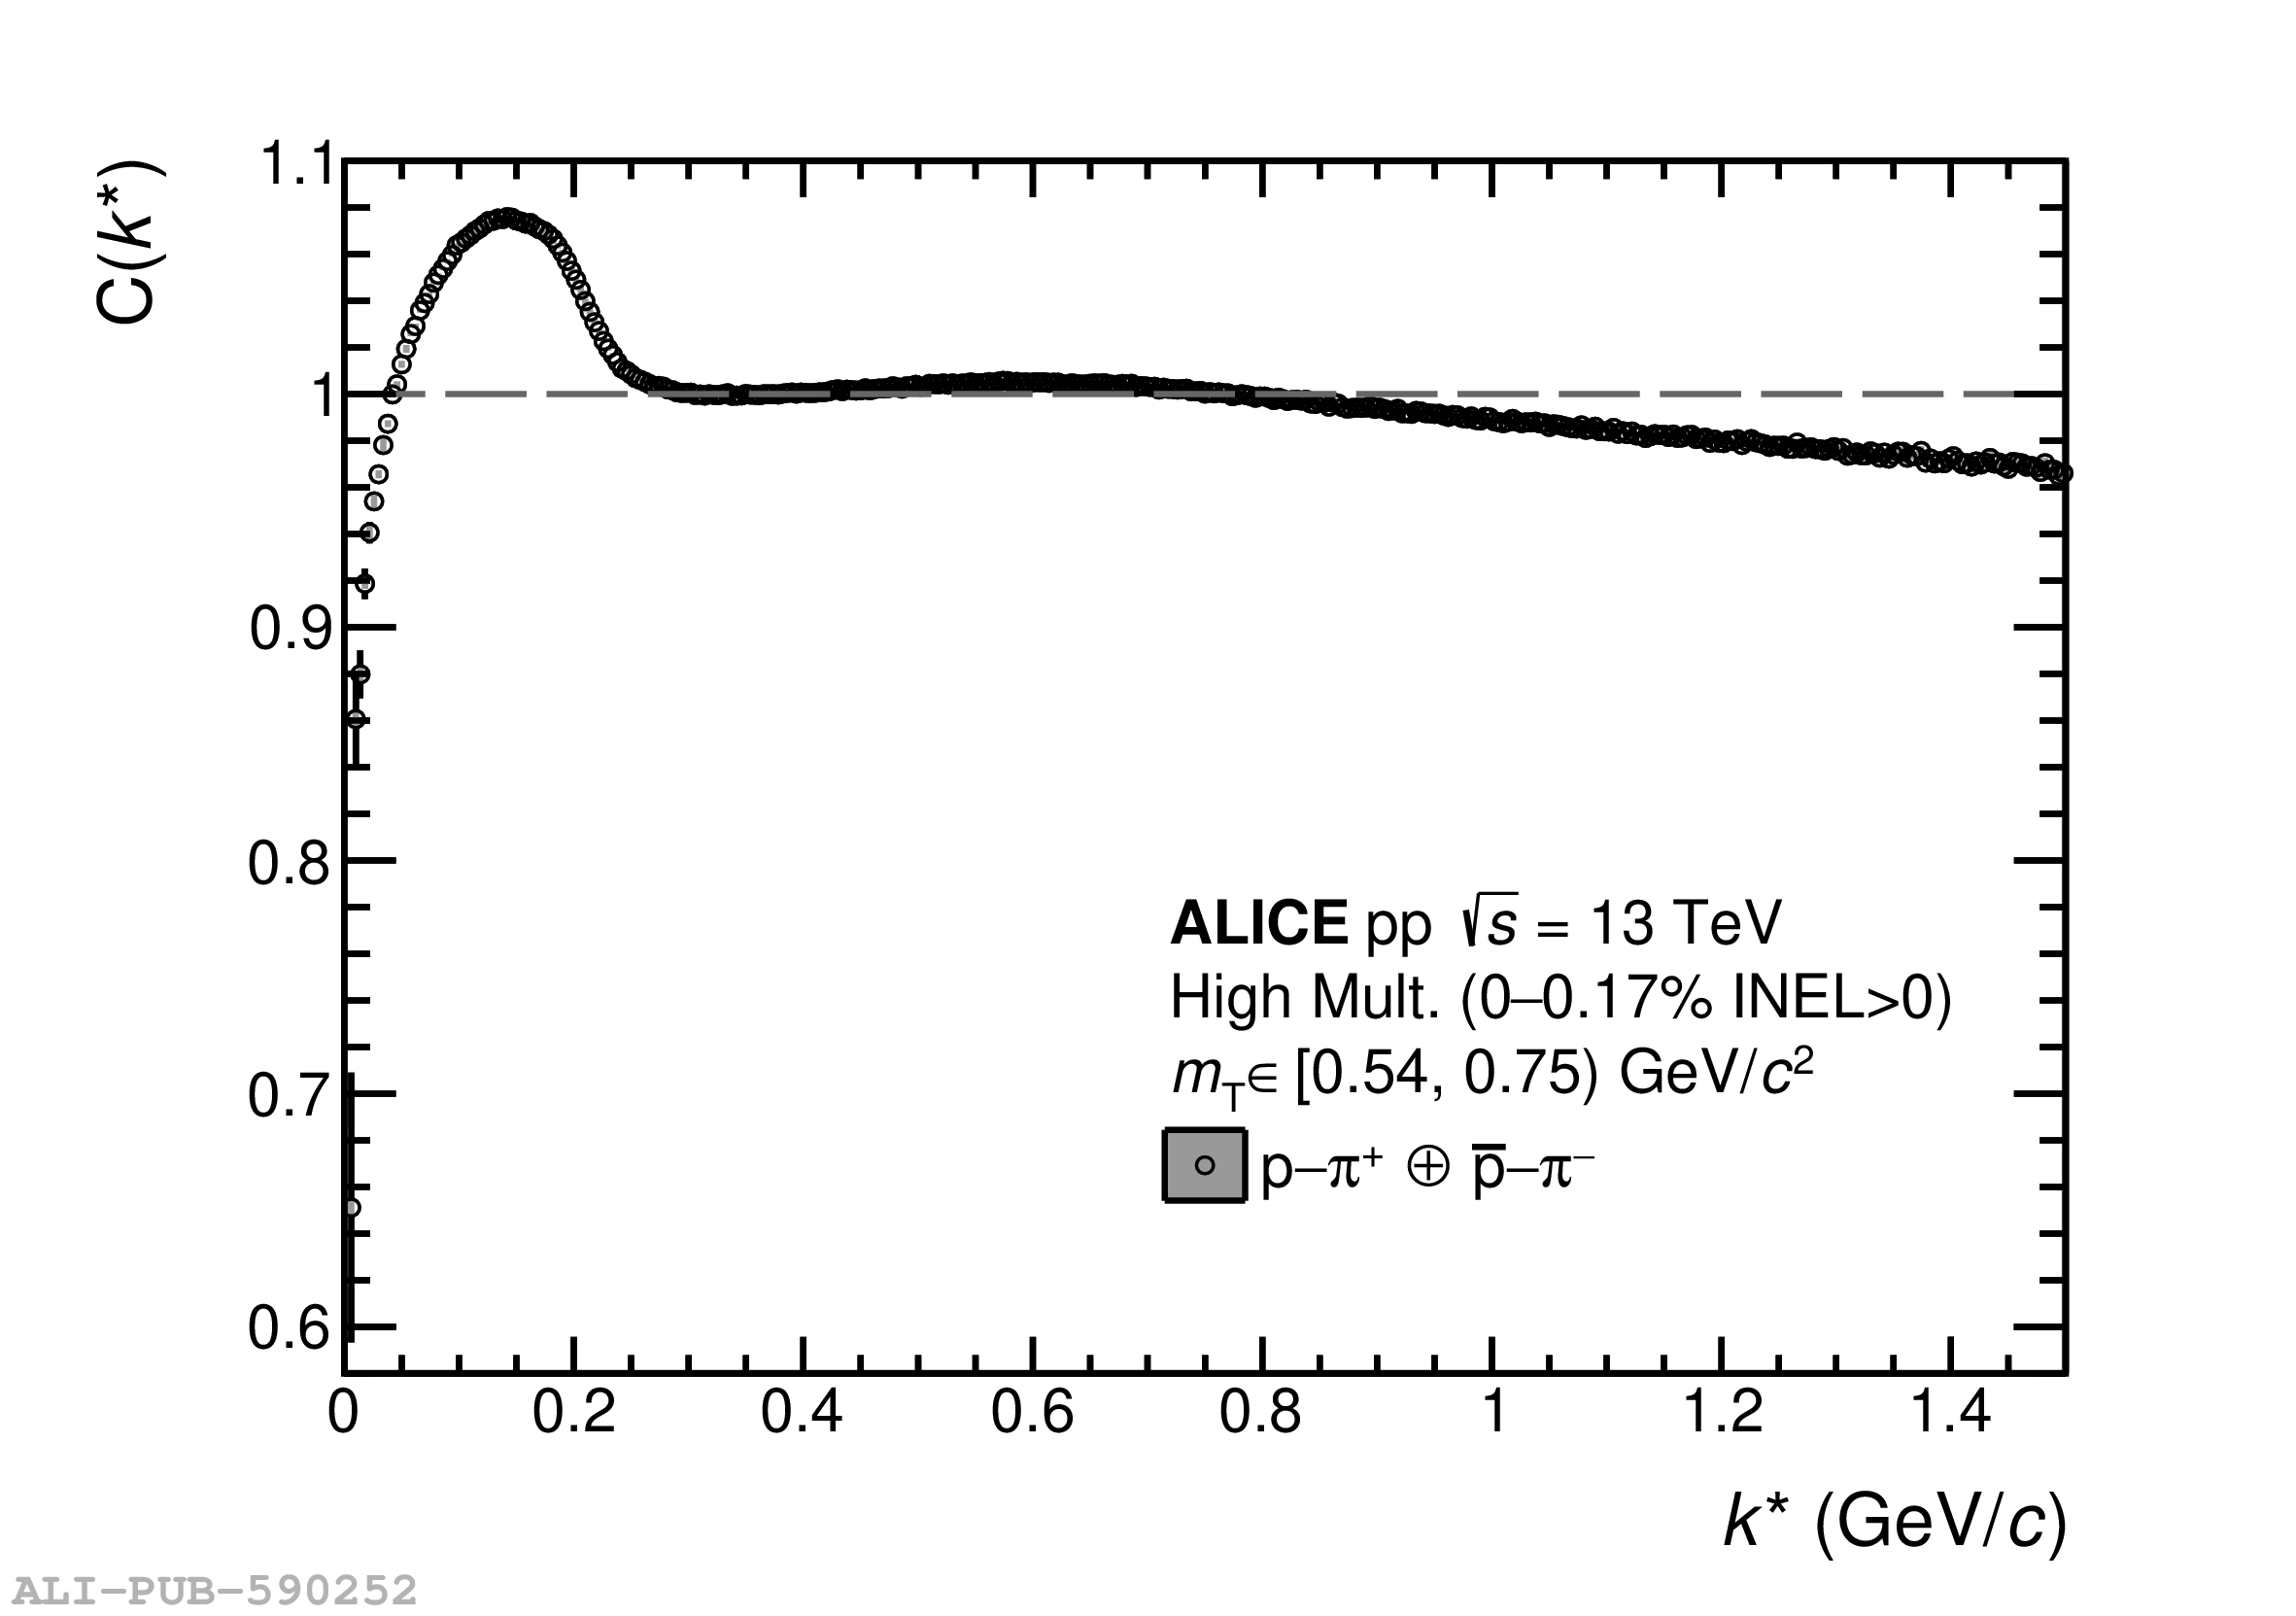 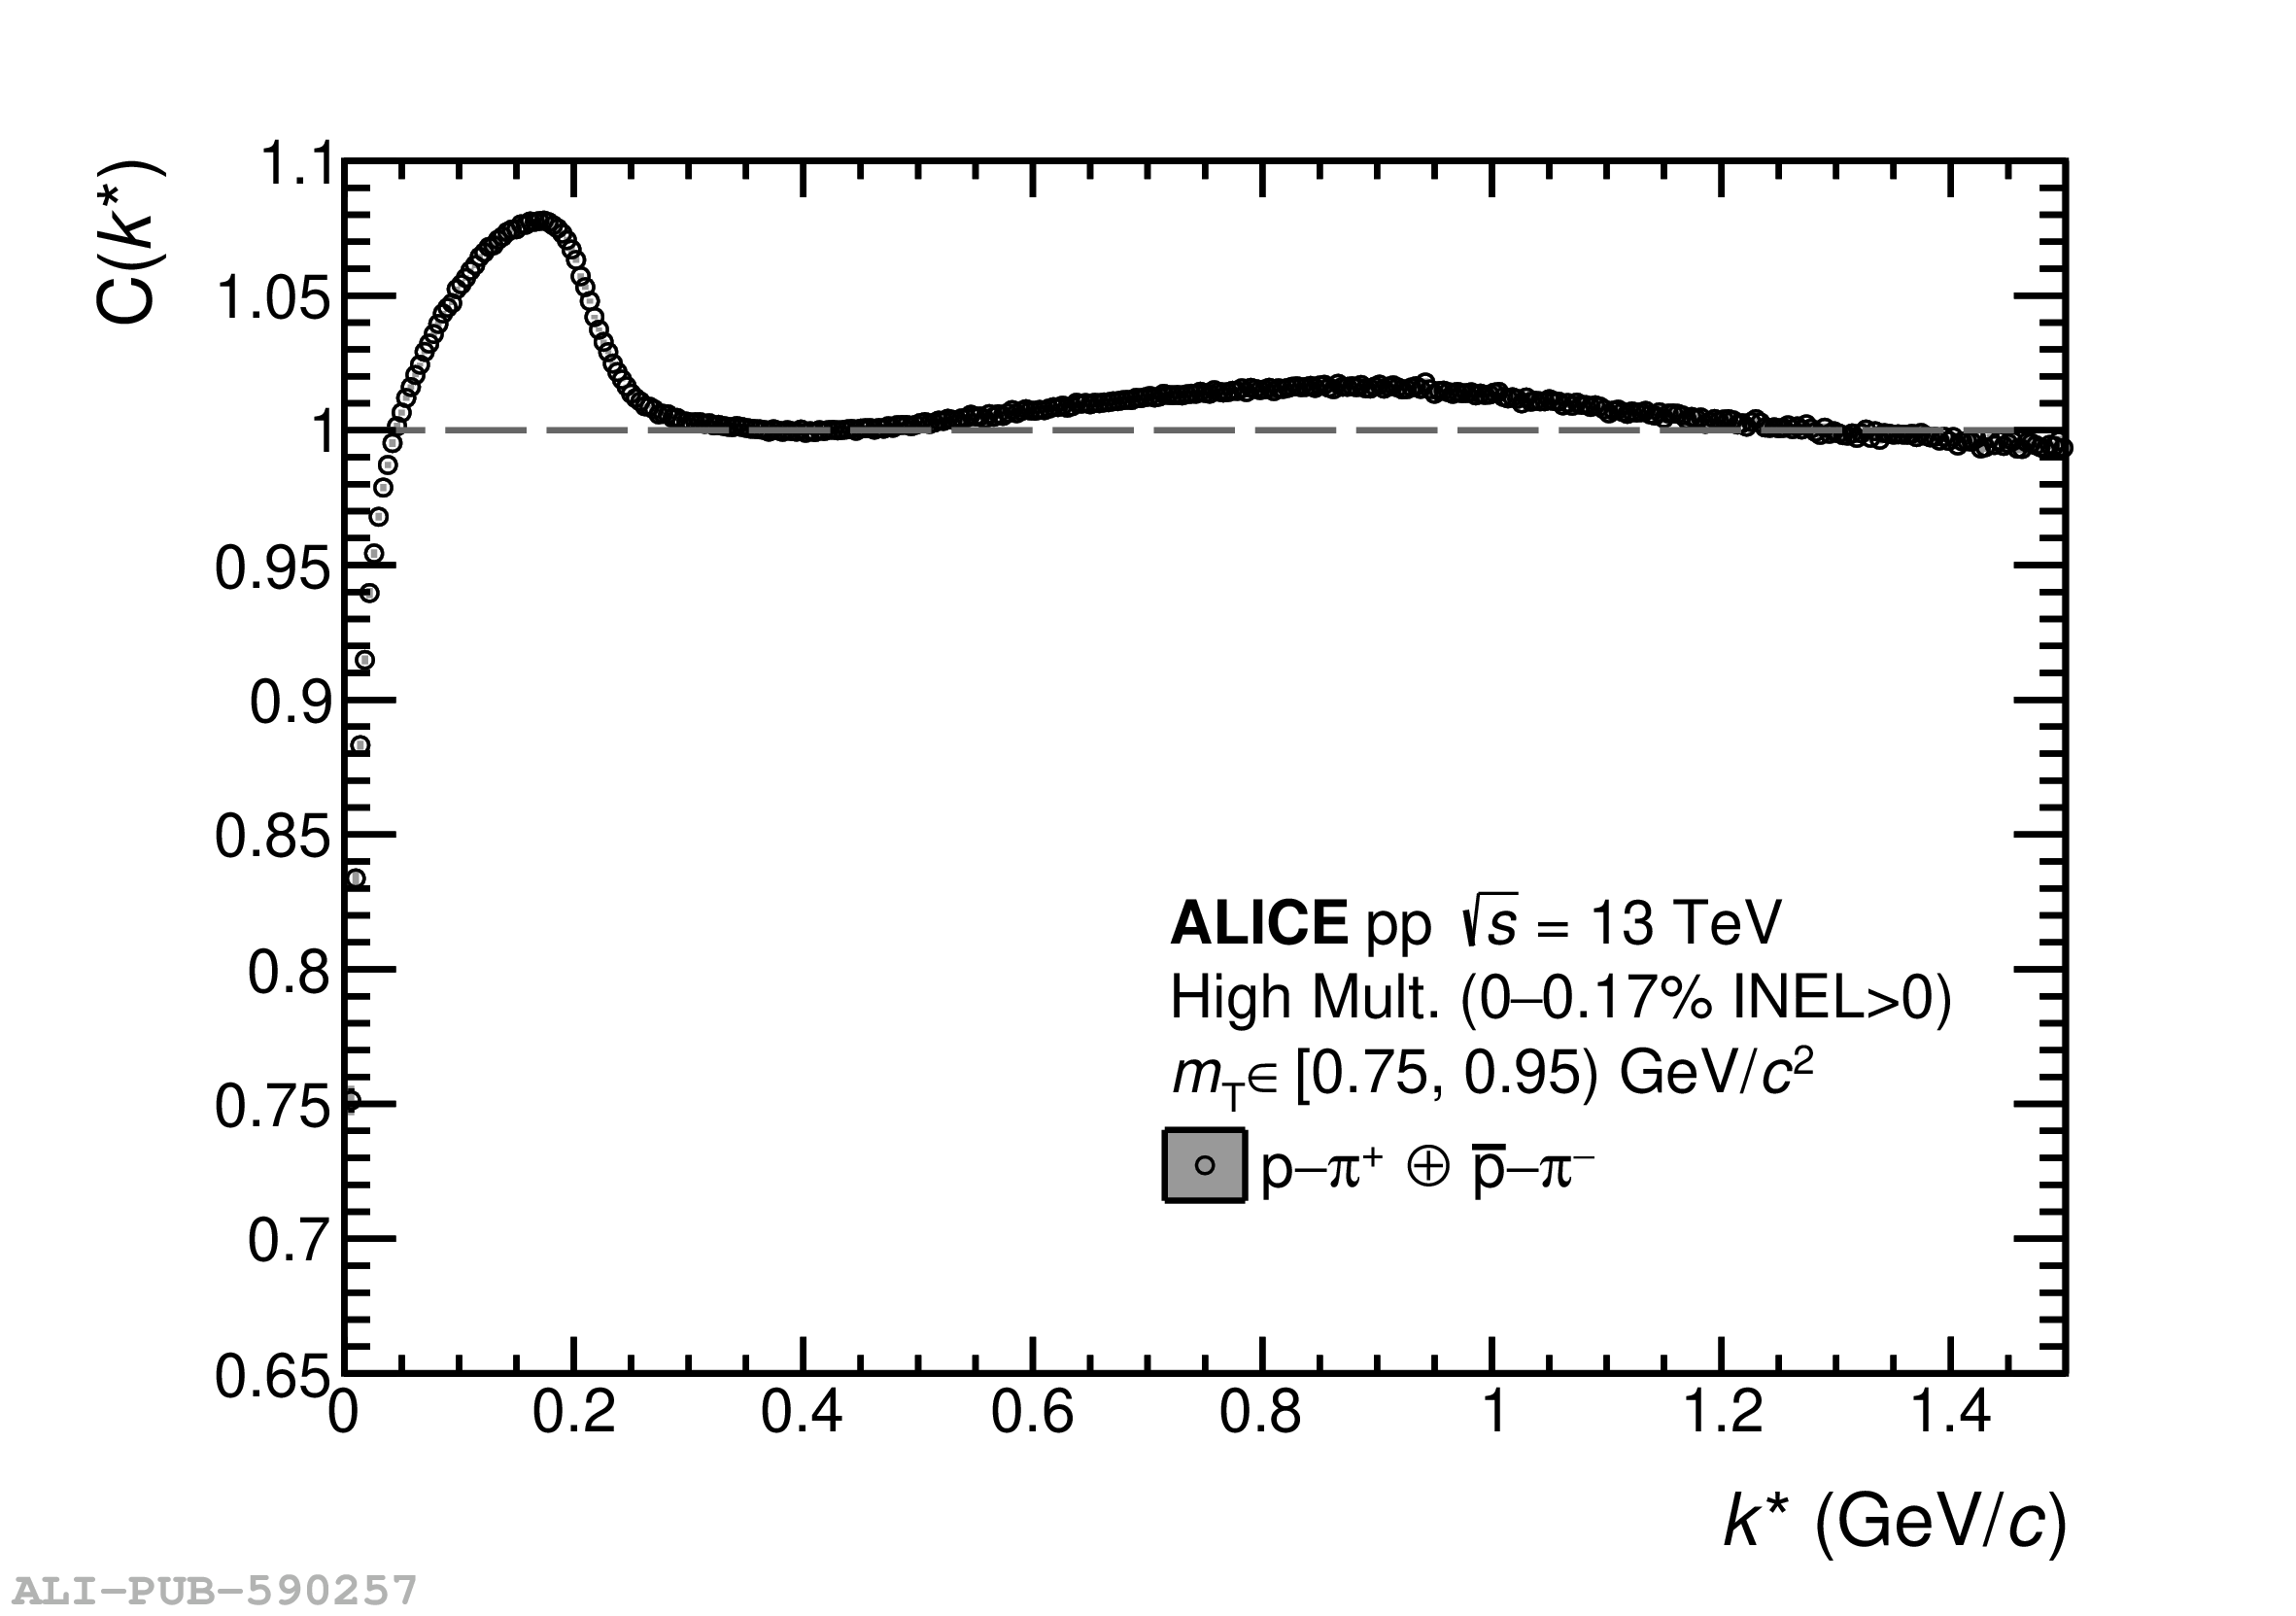 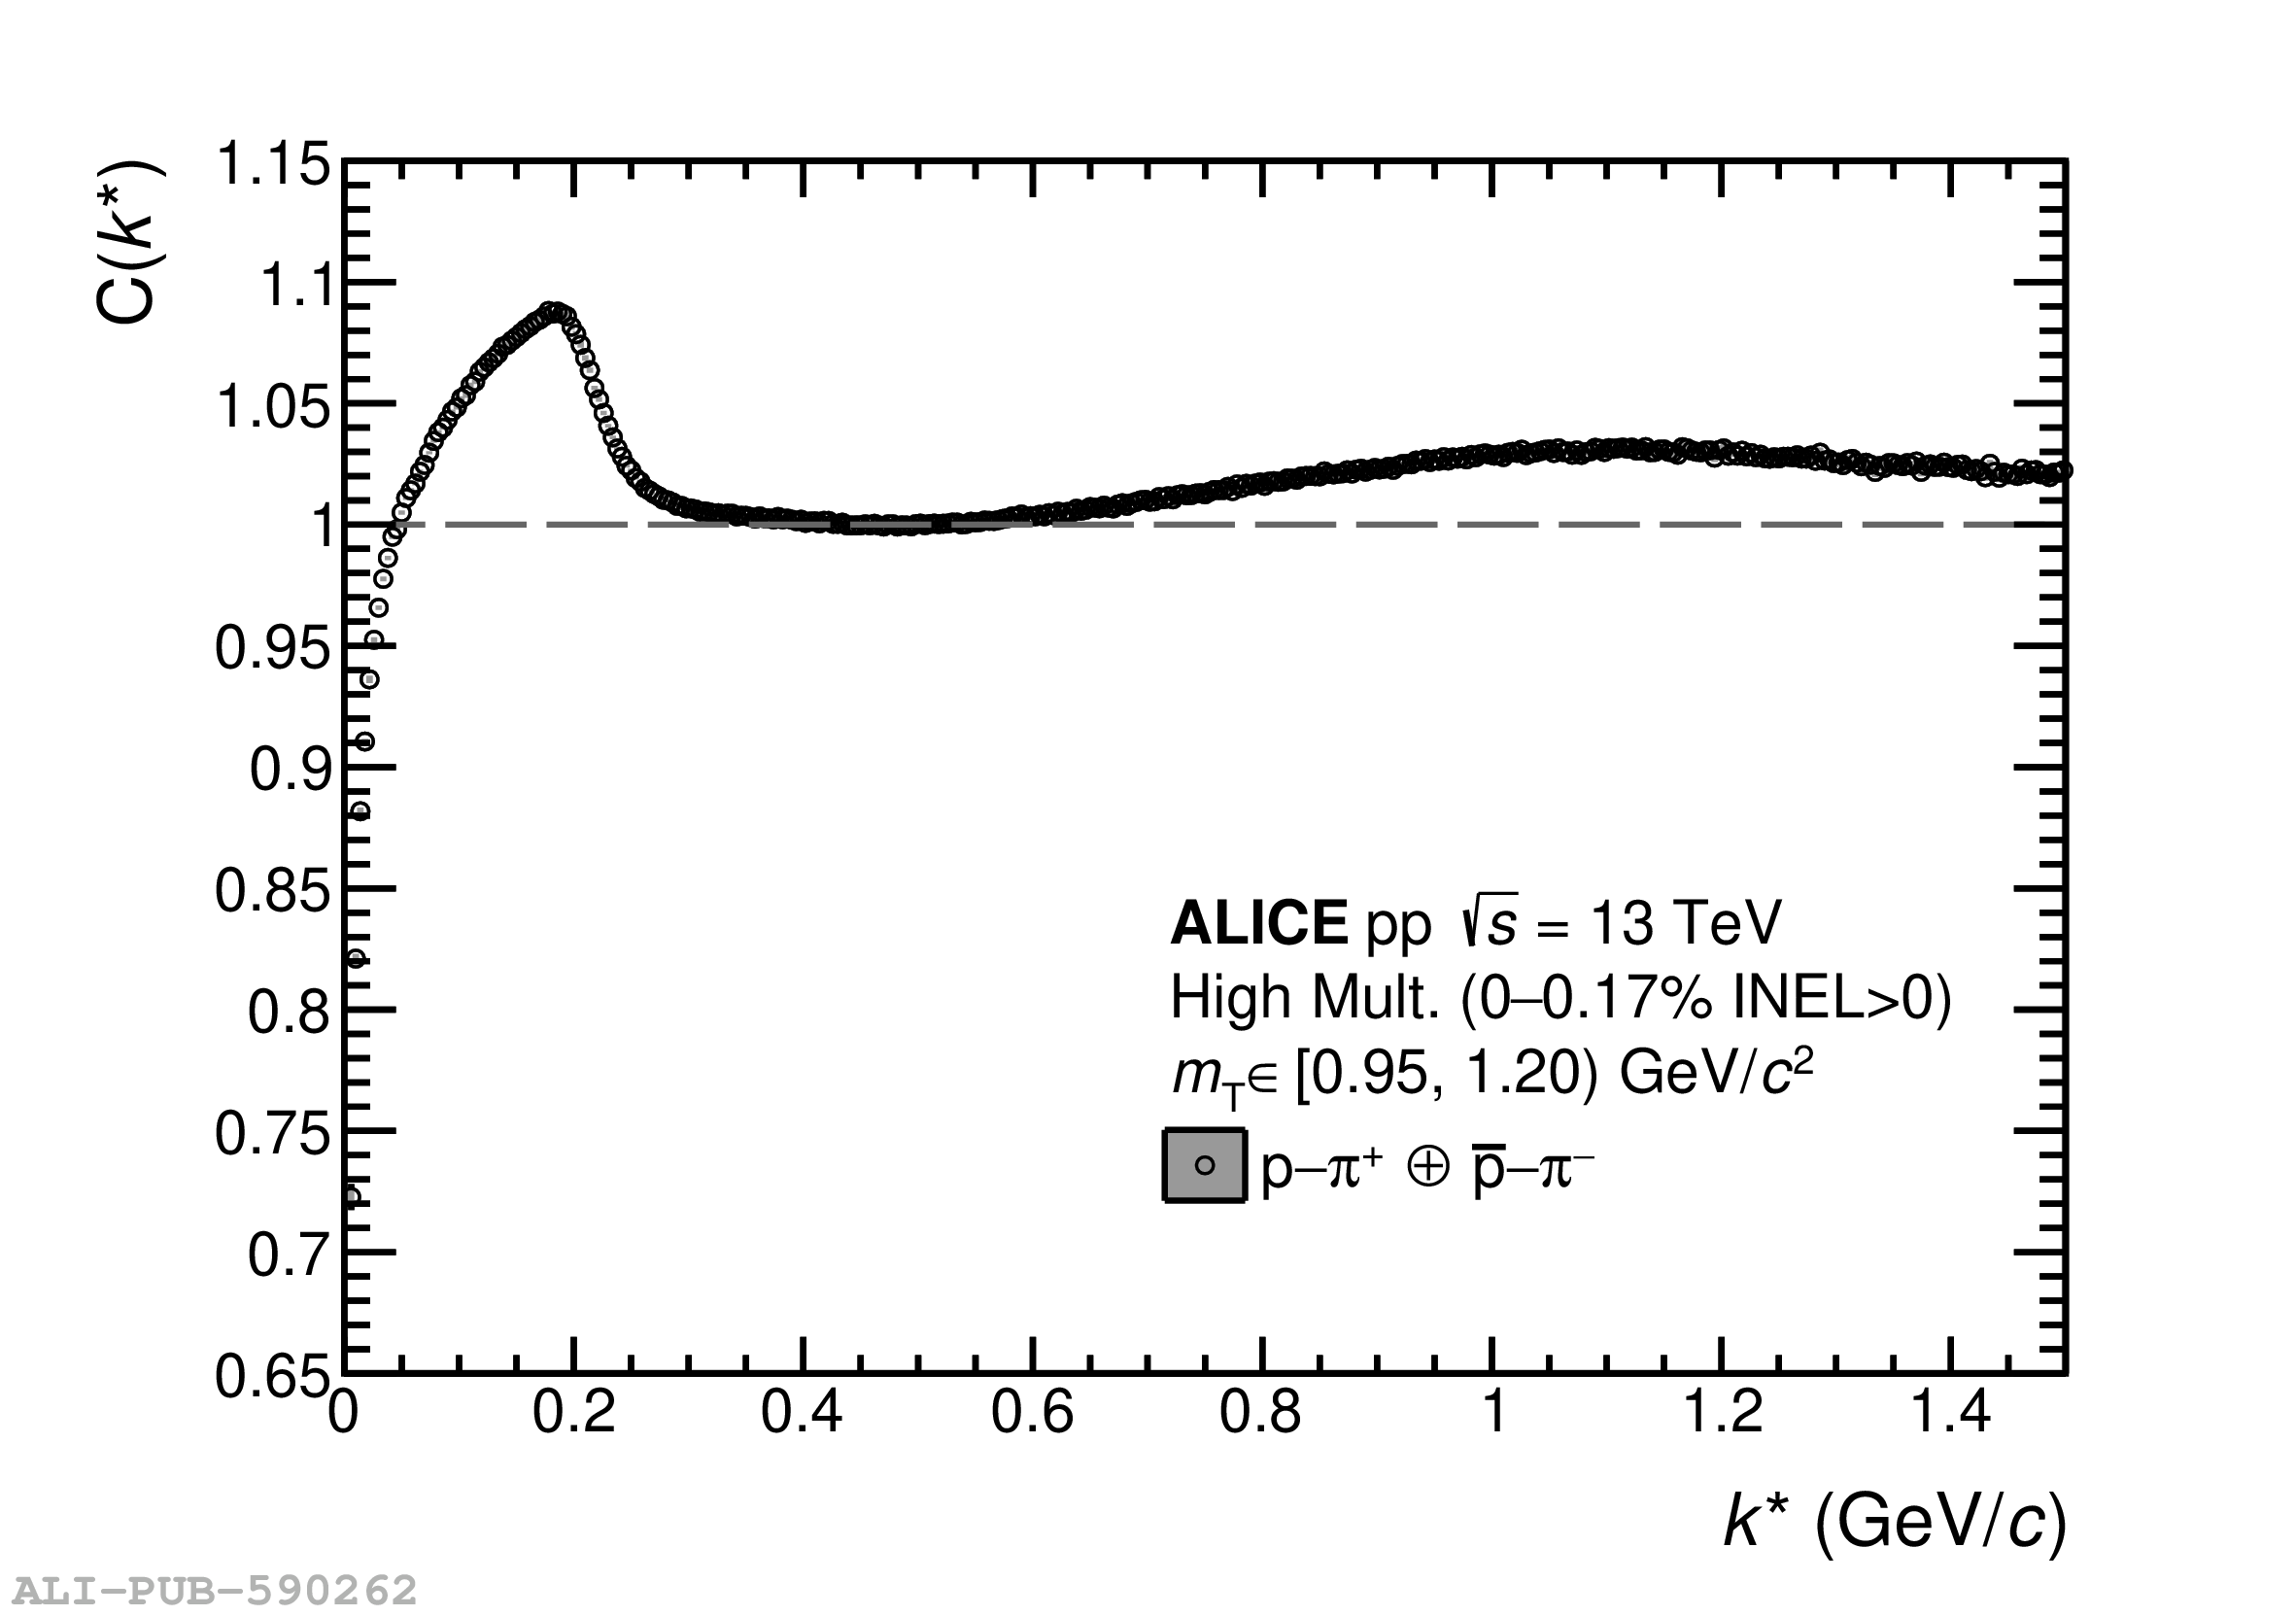    |