Comparison of the three-particle correlation functions of (a) p$-\pi^+$ and (b) p$-\pi^-$ to their respective total lower-order contributions (grey). The statistical and systematic uncertainties are shown by the lines and boxes, respectively. The lower-order contribution is given by Eq.17. The horizontal lines represent the overall bin width, while the respective position of the marker show the average $Q_3$ within this bin. The latter is obtained from the mixed event distribution $N_{\text{mixed}}(Q_3)$. | 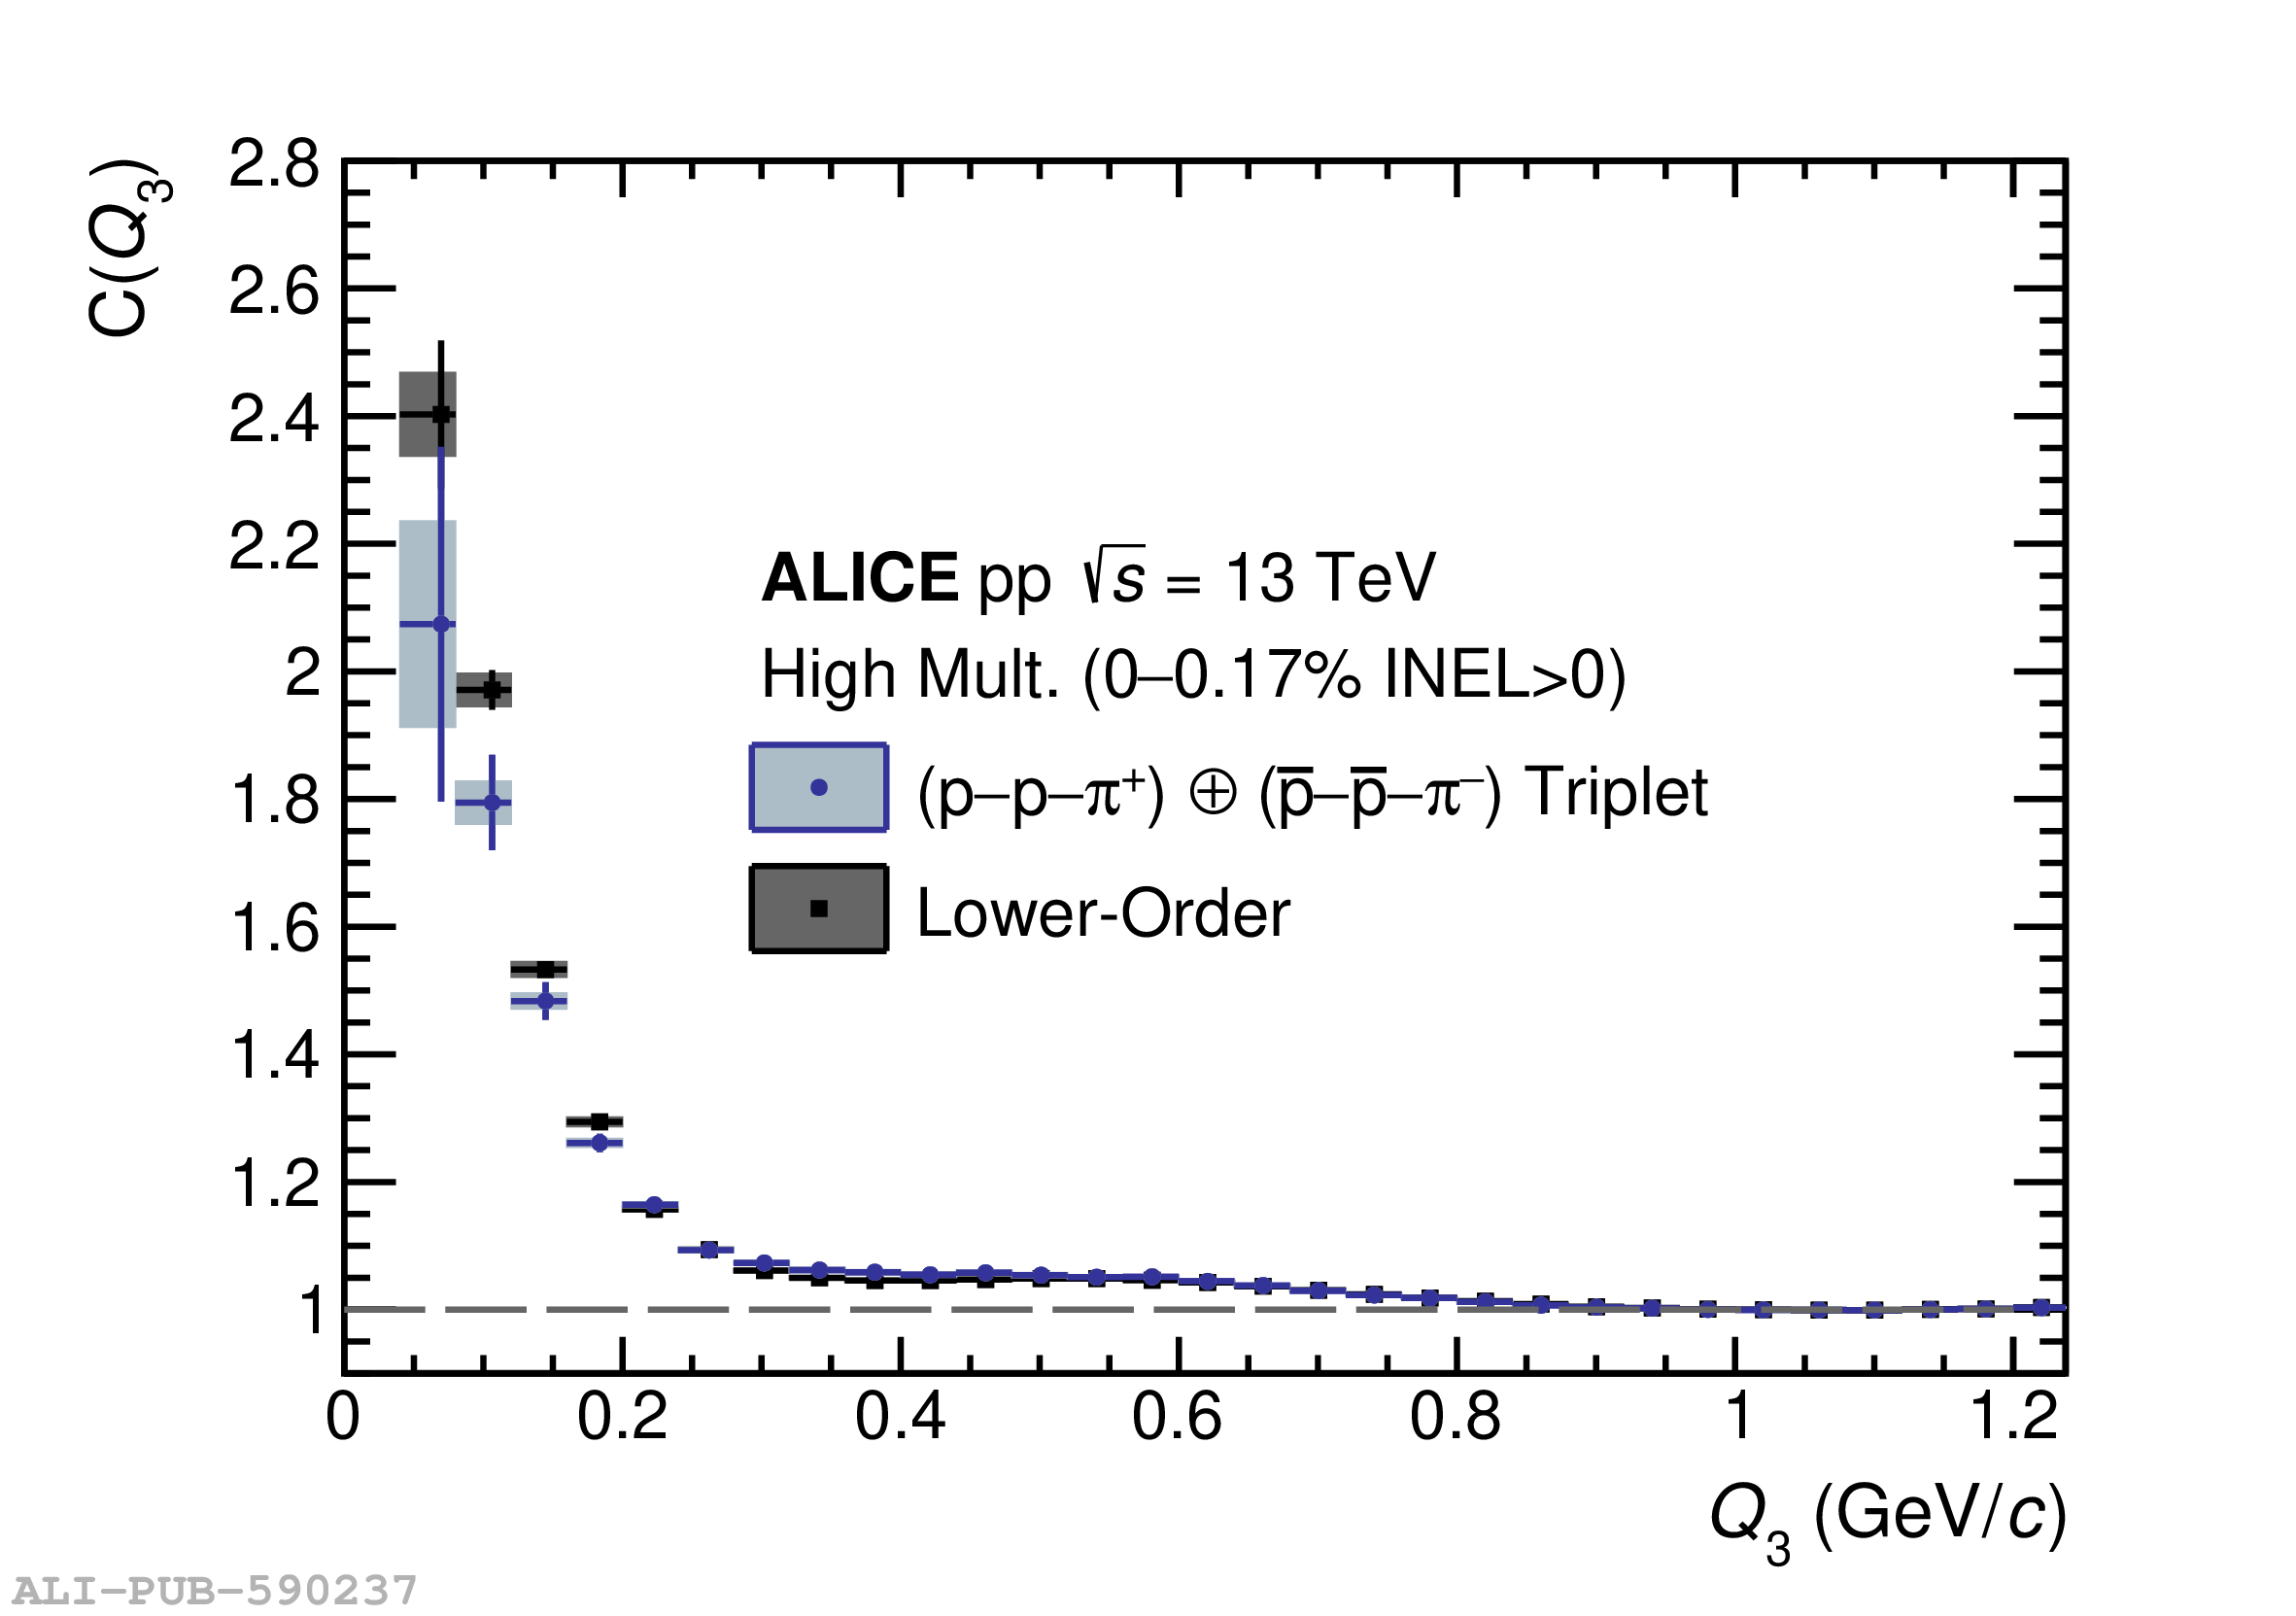  |