Average number of participating nucleons $(\avNpart)$ as a function of centrality percentile in Pb$-$Pb collisions at $\sqrt{s_{\rm NN}}=5.02$ TeV. Data points are shown for centrality estimators based on $N_{\rm ch}$, $\eta$, $N_{\rm tracklets}$ within $|\eta|\leq 0.8$, and $N_{\rm ch}$ within $-3.7 < \eta < -1.7$ and $2.8 < \eta < 5.1$. Uncertainty bars represent the sum of statistical and systematic uncertainties, with the latter being the dominant source. The systematic uncertainty is determined by varying the acceptance correction factors within their uncertainties and assigning the maximum deviation from the nominal $N_{\rm part}$ value as the systematic uncertainty. | 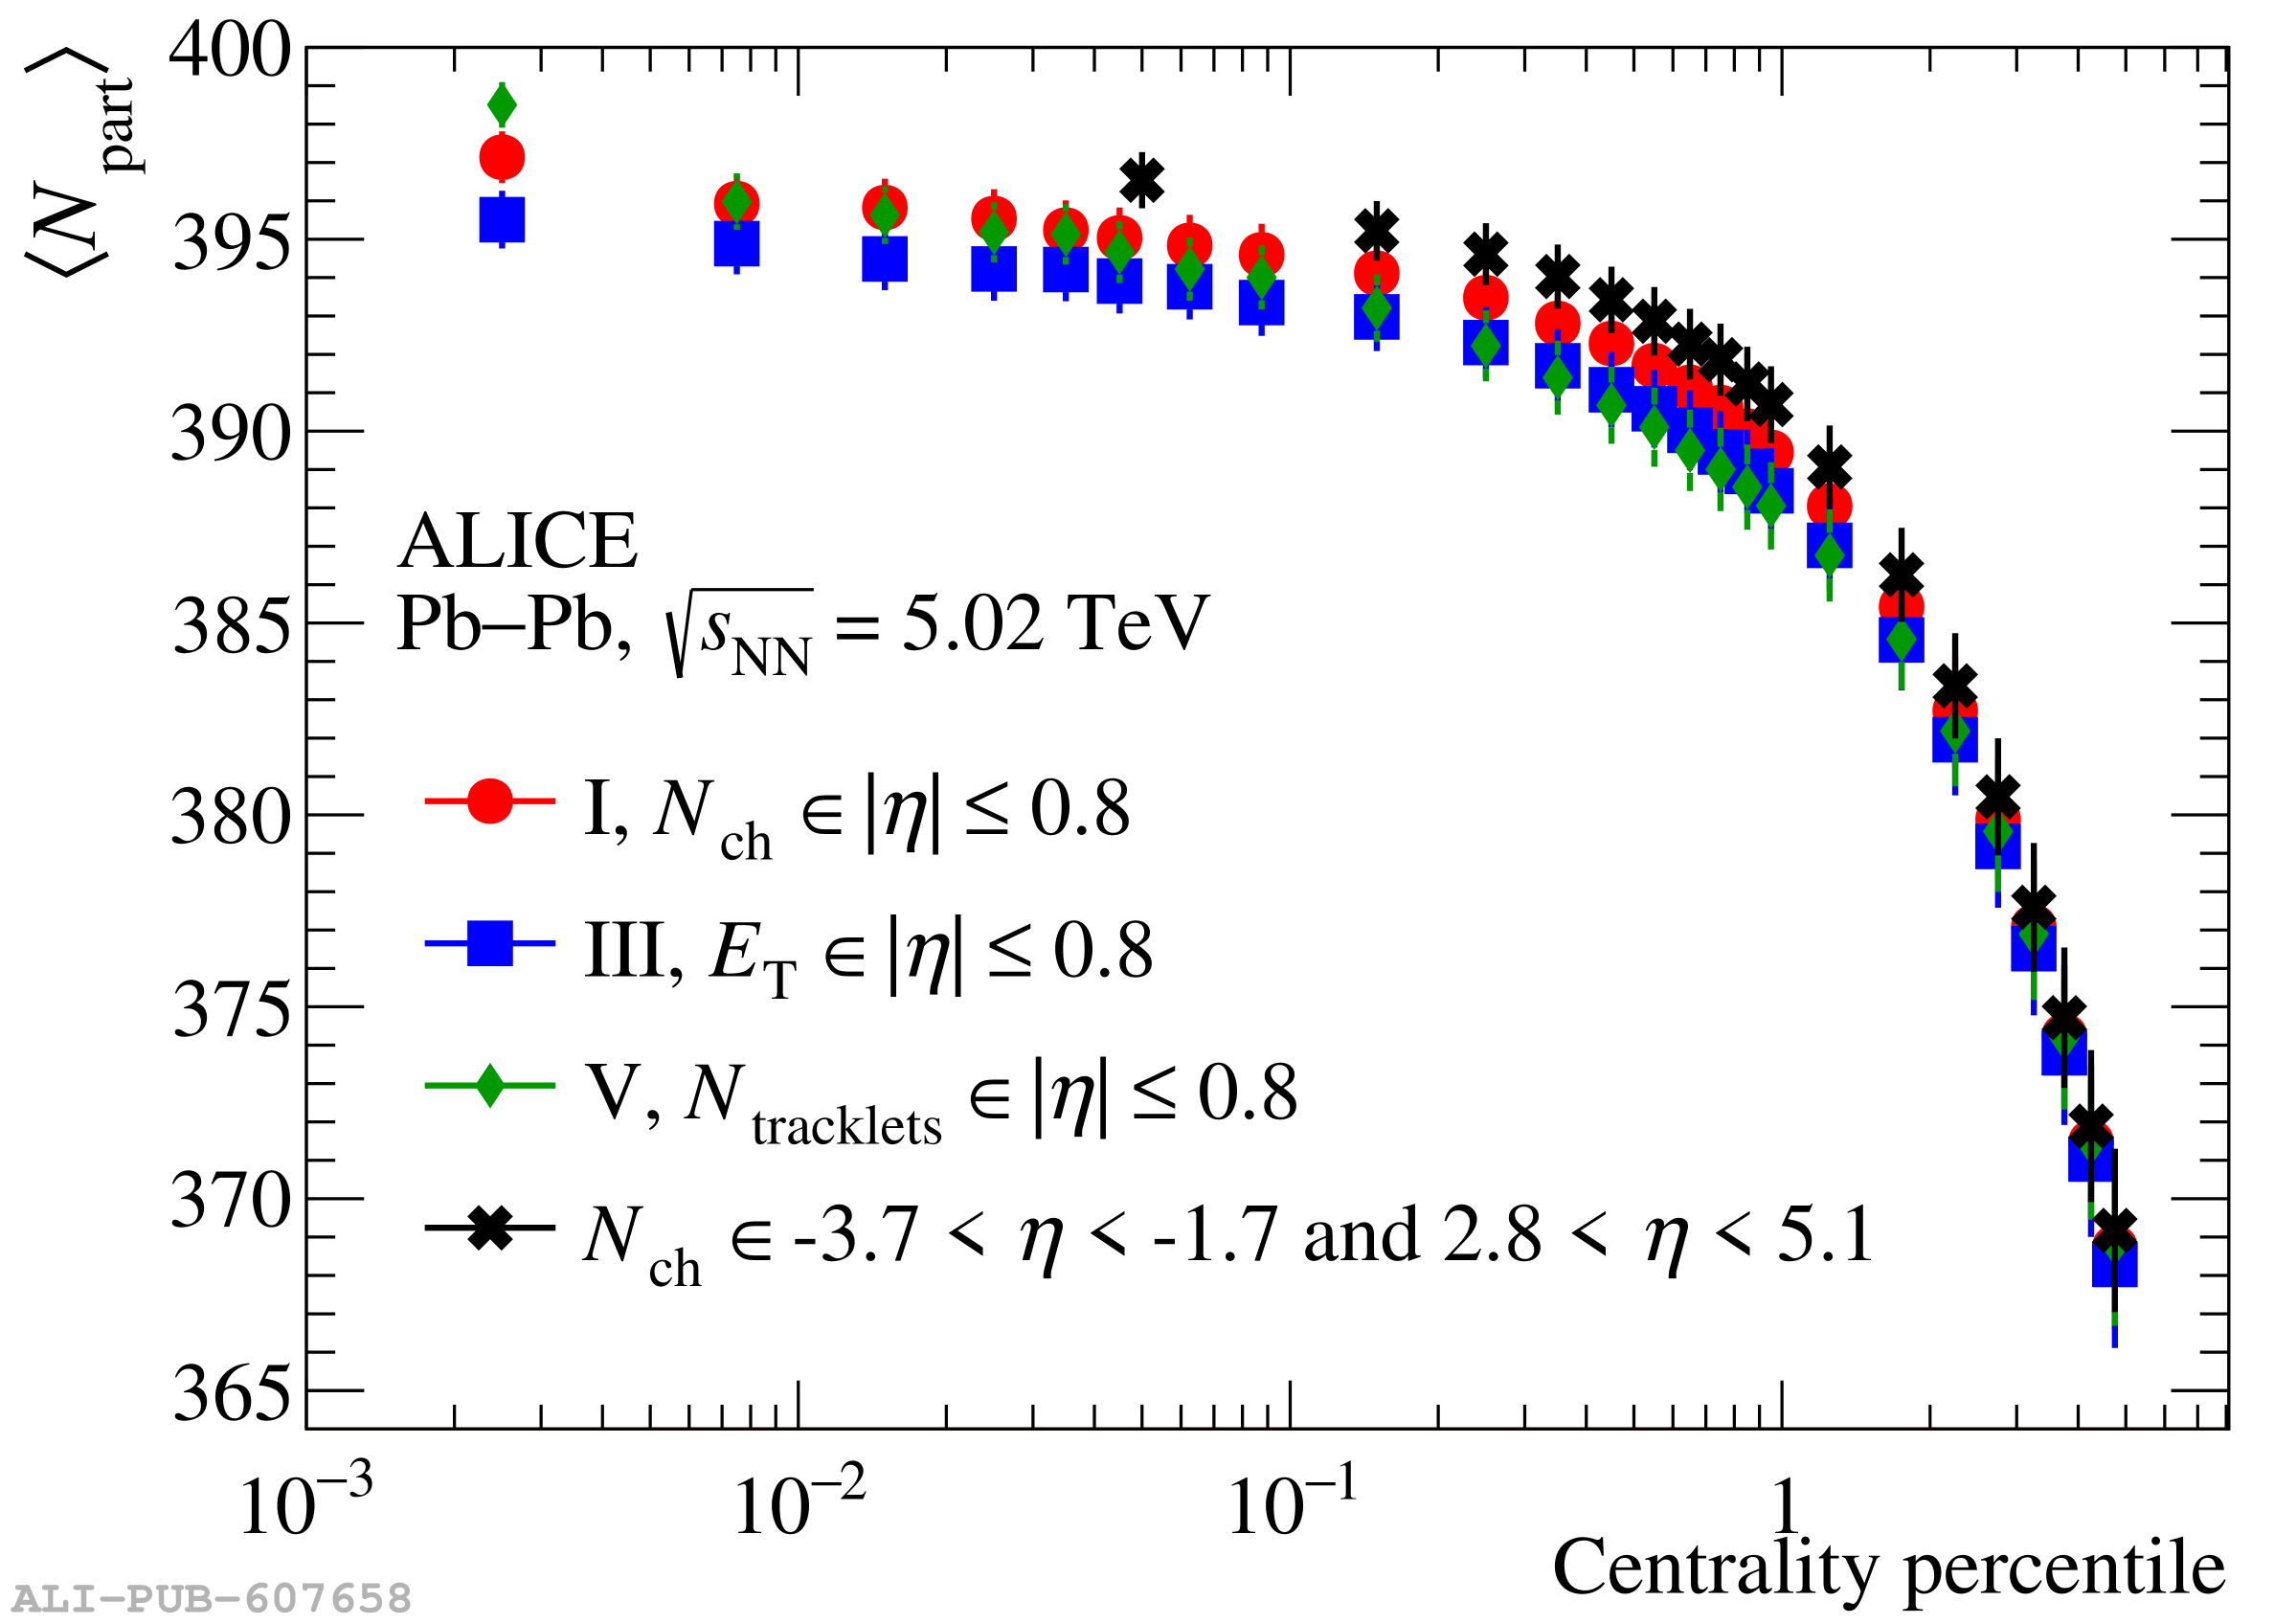 |