Simultaneous fit of the dielectron invariant mass and pseudo-proper decay length two-dimensional distribution in the $8\pt^{\jpsi}15$ \GeVc interval. Left: projection on the invariant mass axis. Right: Projection on the pseudo-proper decay length axis. The various components of the fit are also shown. The vertical black line at $x\approx$100 ${\upmu}$m shows the lower cut value selecting a non-prompt \jpsi sample with less than 10\% contamination from prompt \jpsi. |  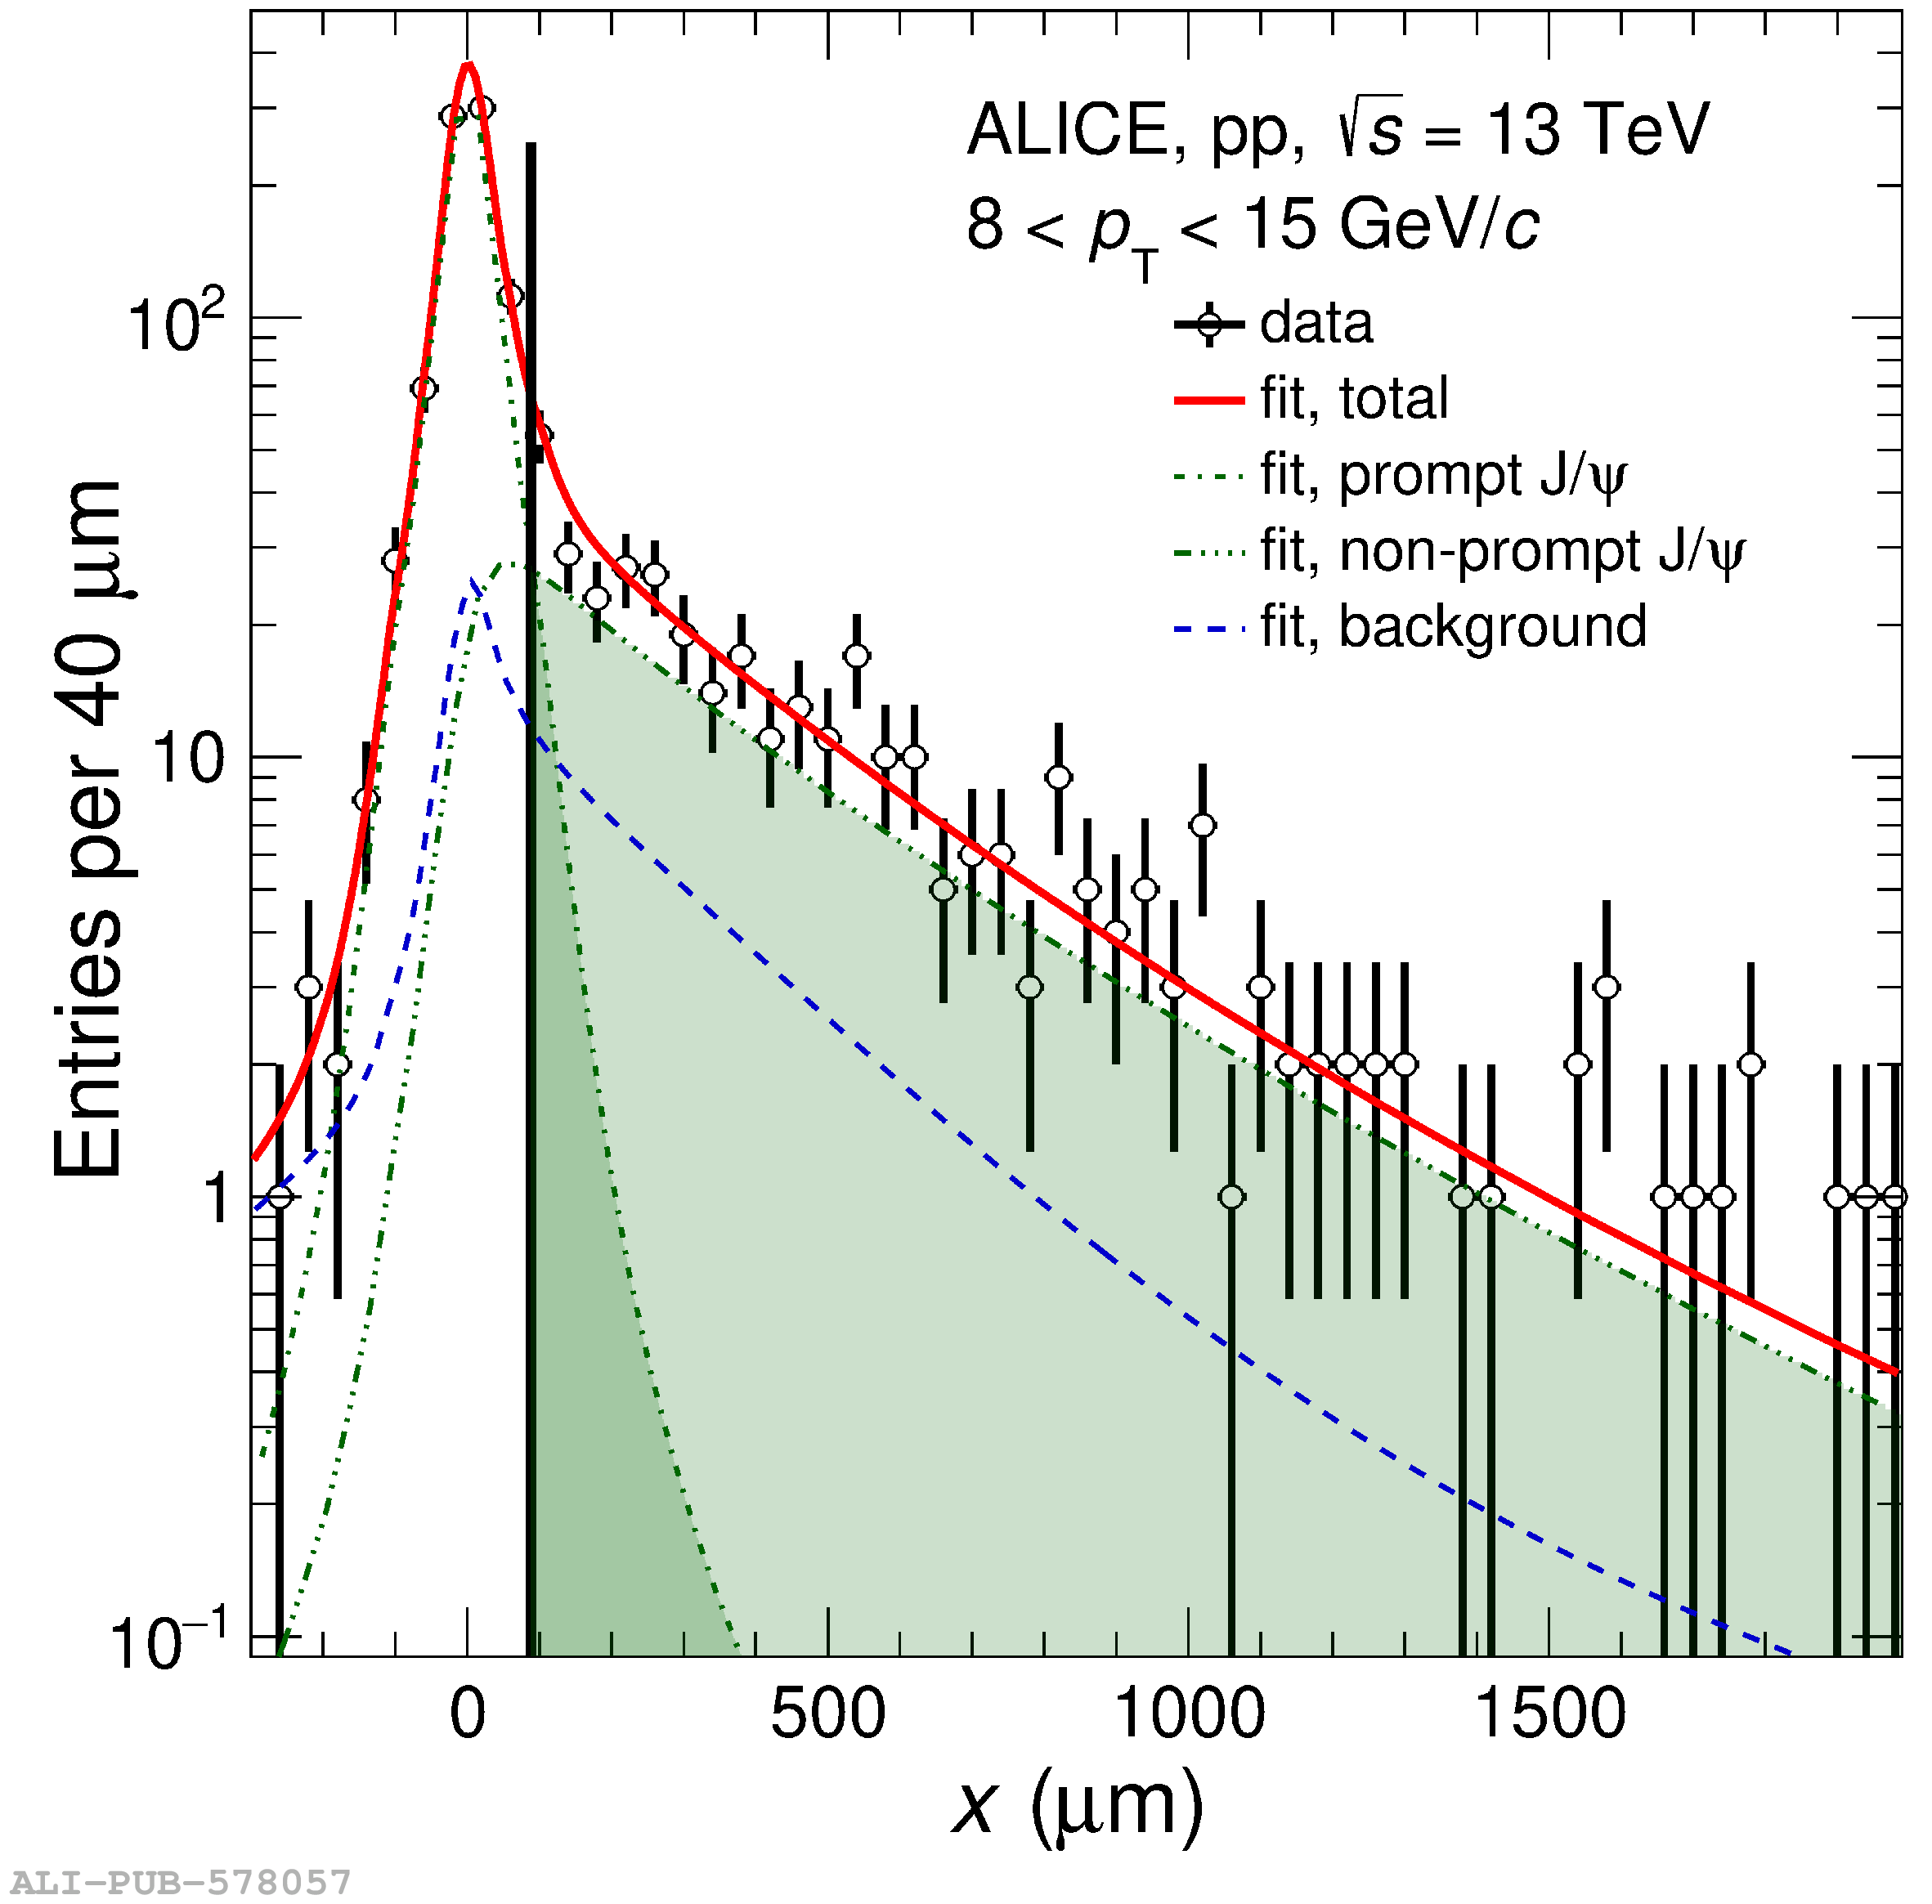 |