The first measurement of the elliptic flow coefficient of (anti)${}^3_Λ$H and the study of the $v_2$ of $^3\overline{\mathrm{He}}$ measured in Pb-Pb collisions at $\sqrt{s_{\rm NN}} = 5.36$ TeV with the ALICE detector are presented. Based on the large data sample of approximately five billion events collected in 2023 during the LHC Run 3 data taking, these measurements provide important insights into the production mechanism of (anti)(hyper)nuclei, as well as into the phase-space distributions of nucleons and hyperons produced in heavy-ion collisions. The results are discussed in the context of hydrodynamic and coalescence models, highlighting how the measurement of the elliptic flow of nuclei, such as helium and hypertriton, provides critical constraints on hadronization models.
Submitted to: PLB
e-Print: arXiv:2603.19398 | PDF | inSPIRE
CERN-EP-2026-079
Figure group
Figure 1
Invariant-mass distribution of $^{3}_{\Lambda}\mathrm{H}$ candidates (left) and $v_{2}$ as a function of the invariant mass (right), in the $5< p_ gev transverse-momentum interval and the centrality interval. in left solid red line represents fit with a dscb function while dotted displays of background second-order polynomial function. total is shown blue line. right described>< /p_> | 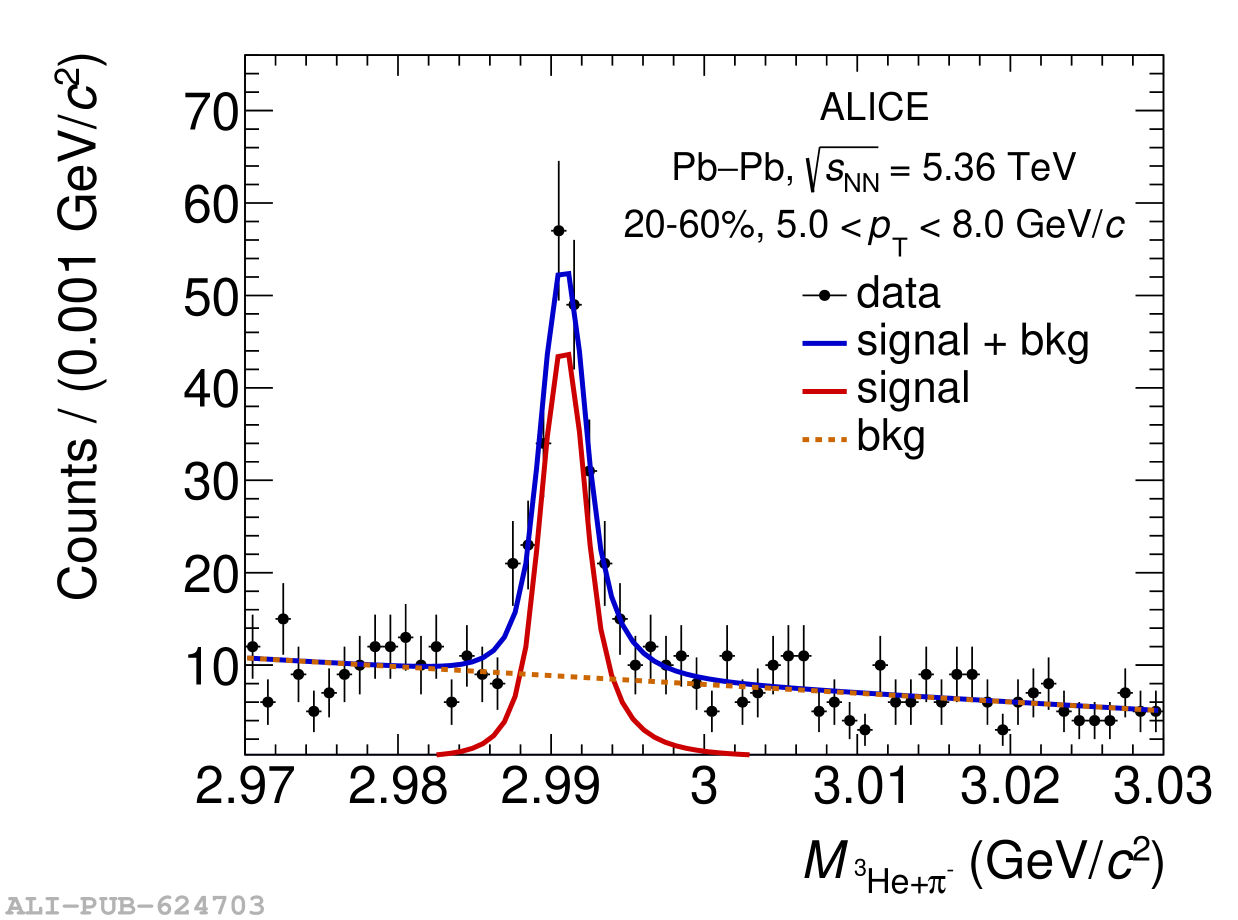 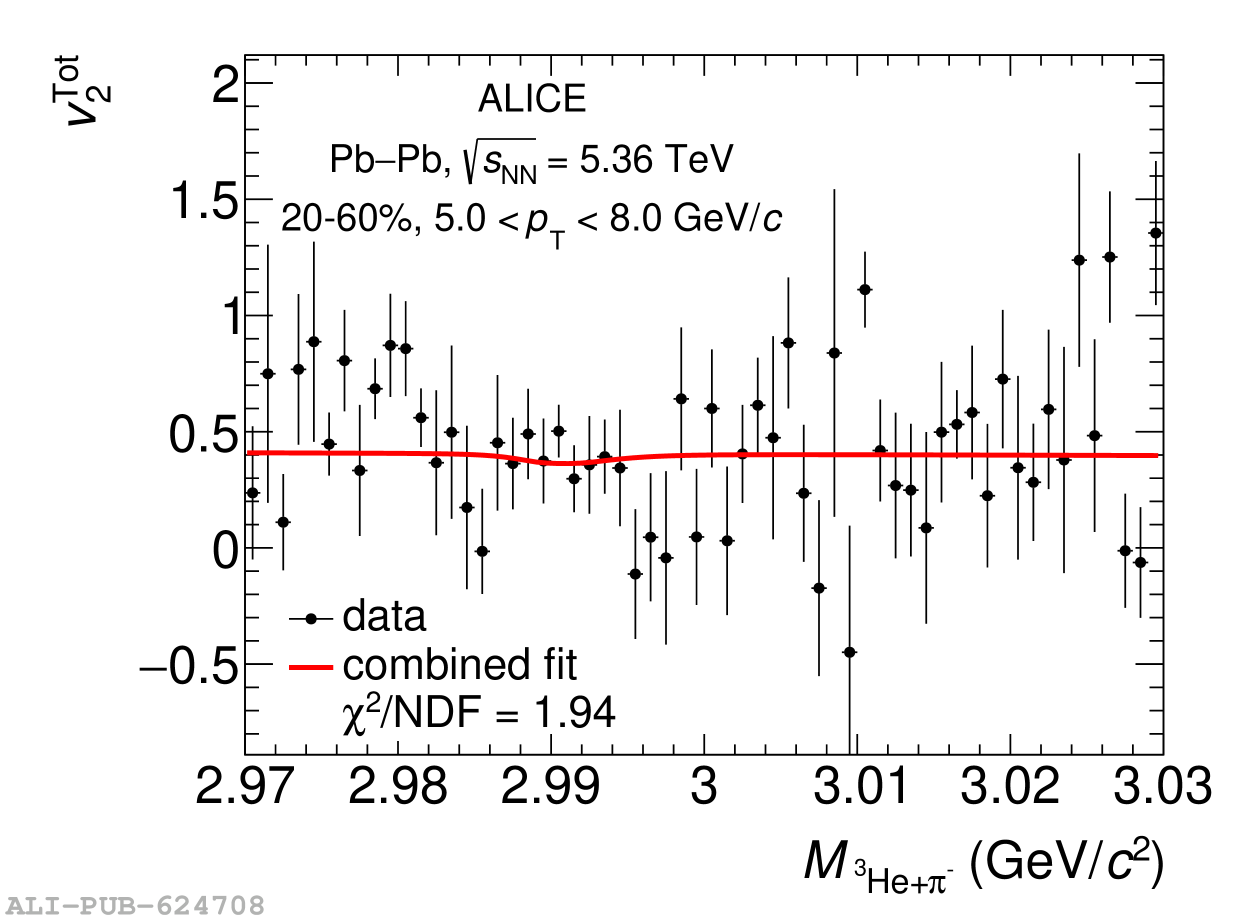 |
Figure 2
Measured $v_2$ of $^3\overline{\mathrm{He}}$ as a function of $p_{\mathrm T}$ for the various centrality intervals (left) and comparison with predictions of hydrodynamical models with and without a coalescence afterburner for two selected centrality intervals (right). Error bars represent statistical uncertainties, while boxes indicate systematic uncertainties, respectively. The widths of the model bands represent their statistical uncertainties. | 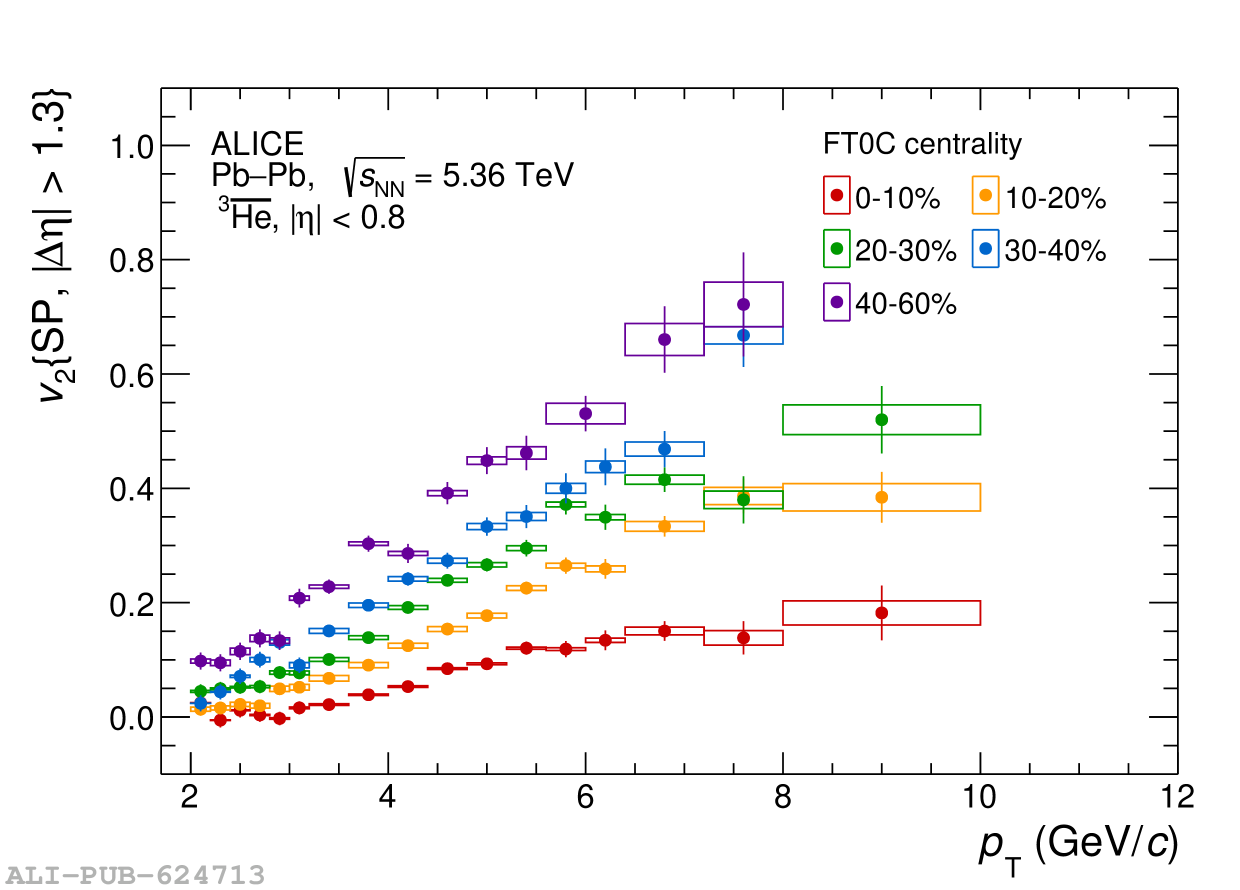 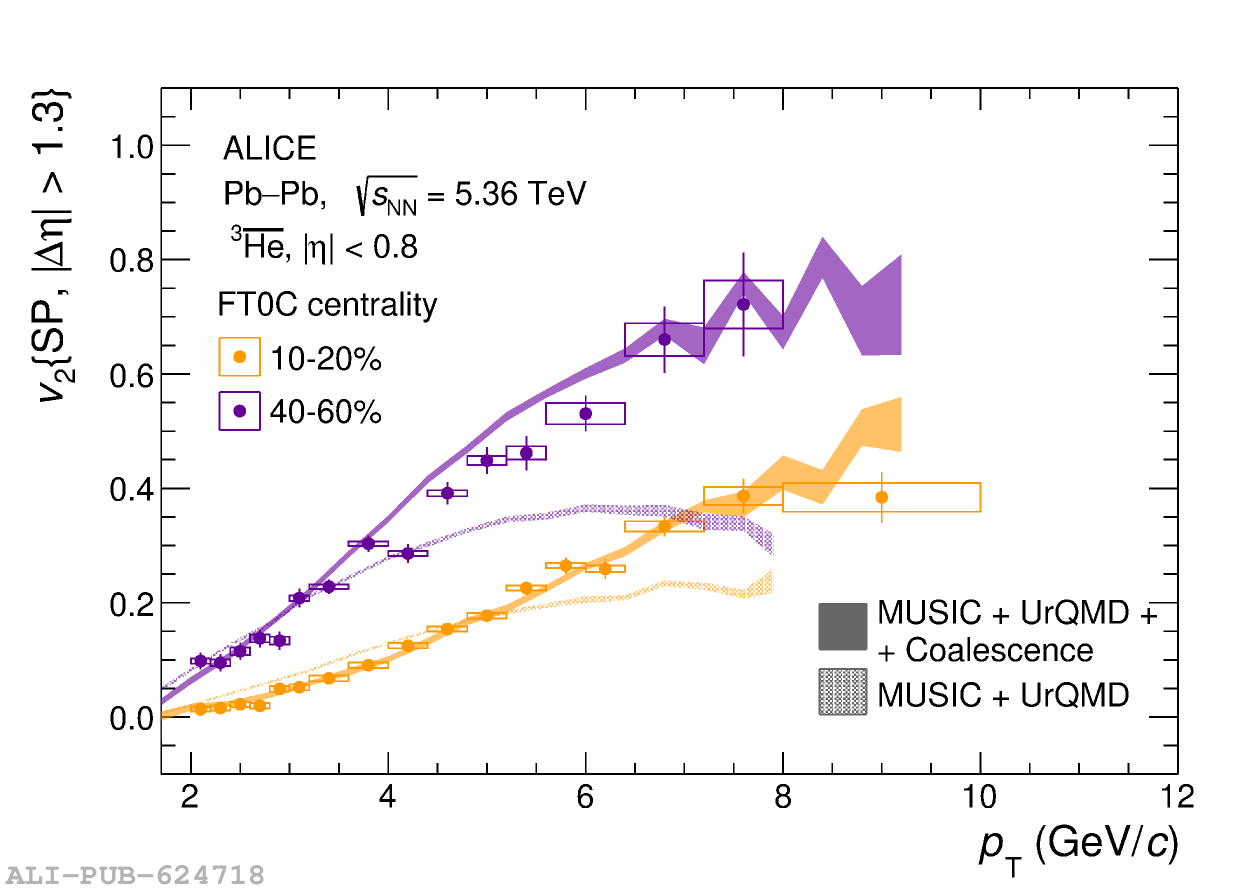 |
Figure 3
Azimuthal distributions of $^3\overline{\mathrm{He}}$ nuclei in the transverse-momentum range $4 \leq p_{\mathrm{T}} 5.6$ GeV/$c$, fitted with periodic functions including even harmonics up to the fourth order. The experimental data are selected in the 40--60\% centrality interval, and the fit includes the second and fourth harmonics (blue line). See the text for details. | 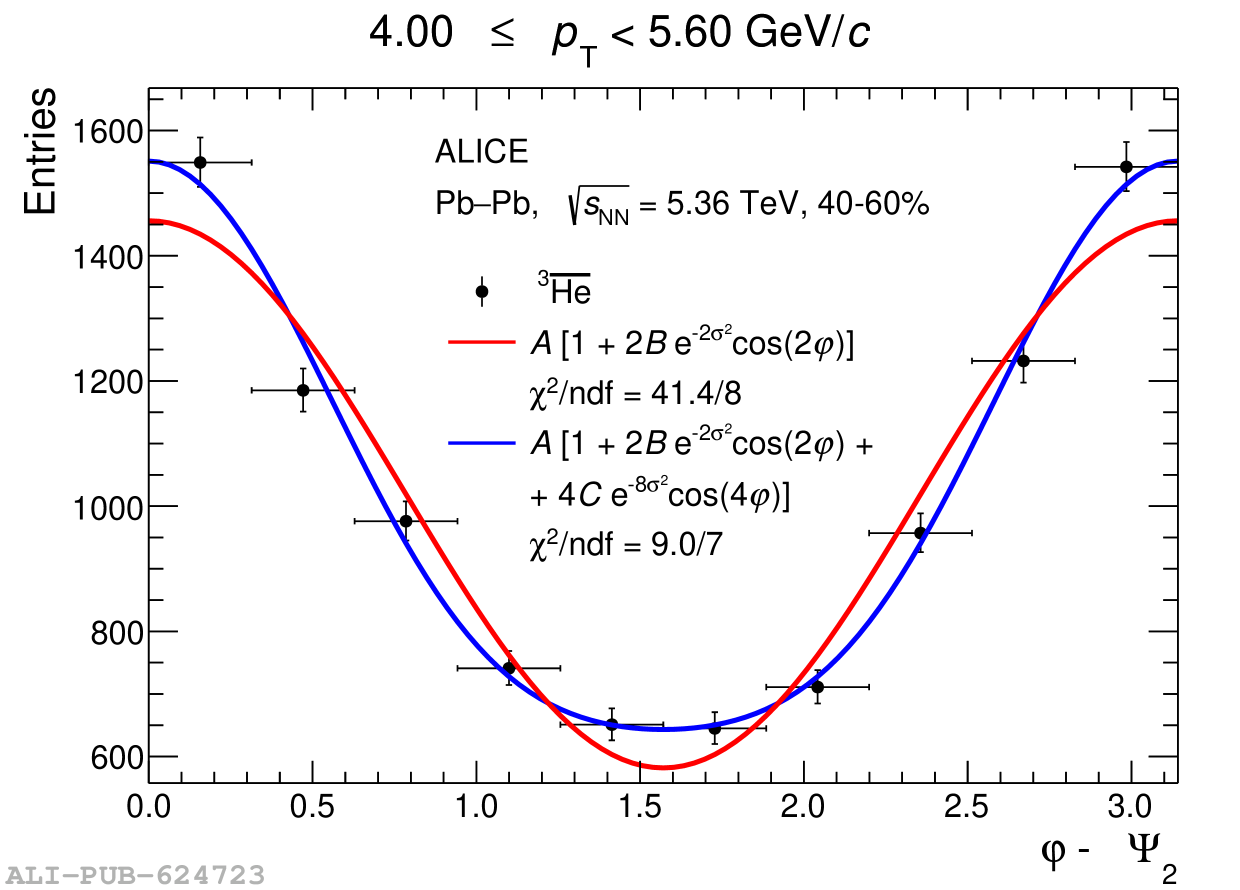 |
Figure 4
$v_2$ of $^3\overline{\mathrm{He}}$ (red markers) and hypertriton (blue markers) as a function of $p_{\mathrm T}$ for the 0-20\% (left panel) and 20-60\% (right panel) centrality intervals. Error bars represent statistical uncertainties, while boxes indicate systematic uncertainties, respectively. The data points are compared with the coalescence model expectations (see the text for details) for the two nuclear species. | 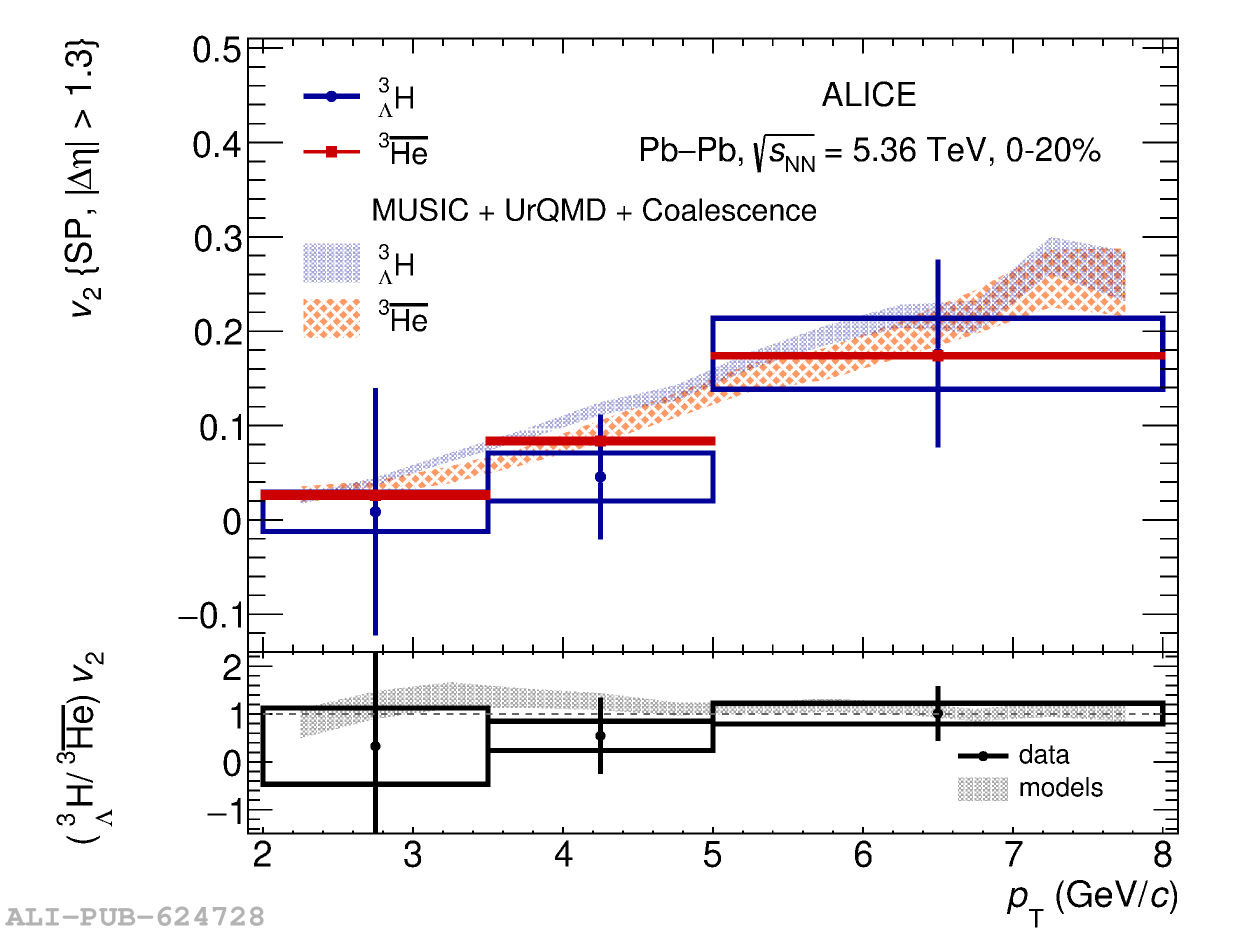 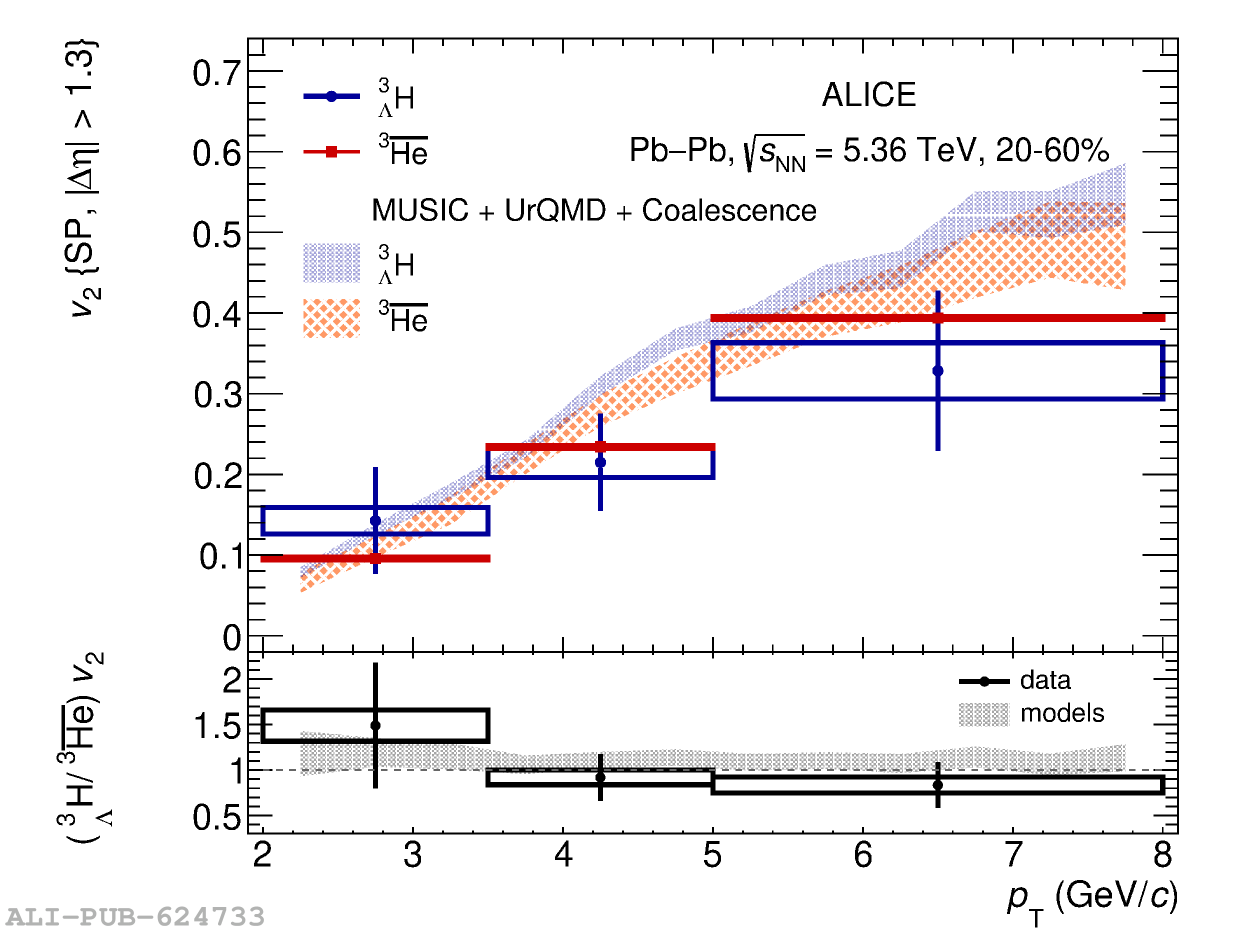 |