Measured $v_2$ of $^3\overline{\mathrm{He}}$ as a function of $p_{\mathrm T}$ for the various centrality intervals (left) and comparison with predictions of hydrodynamical models with and without a coalescence afterburner for two selected centrality intervals (right). Error bars represent statistical uncertainties, while boxes indicate systematic uncertainties, respectively. The widths of the model bands represent their statistical uncertainties. | 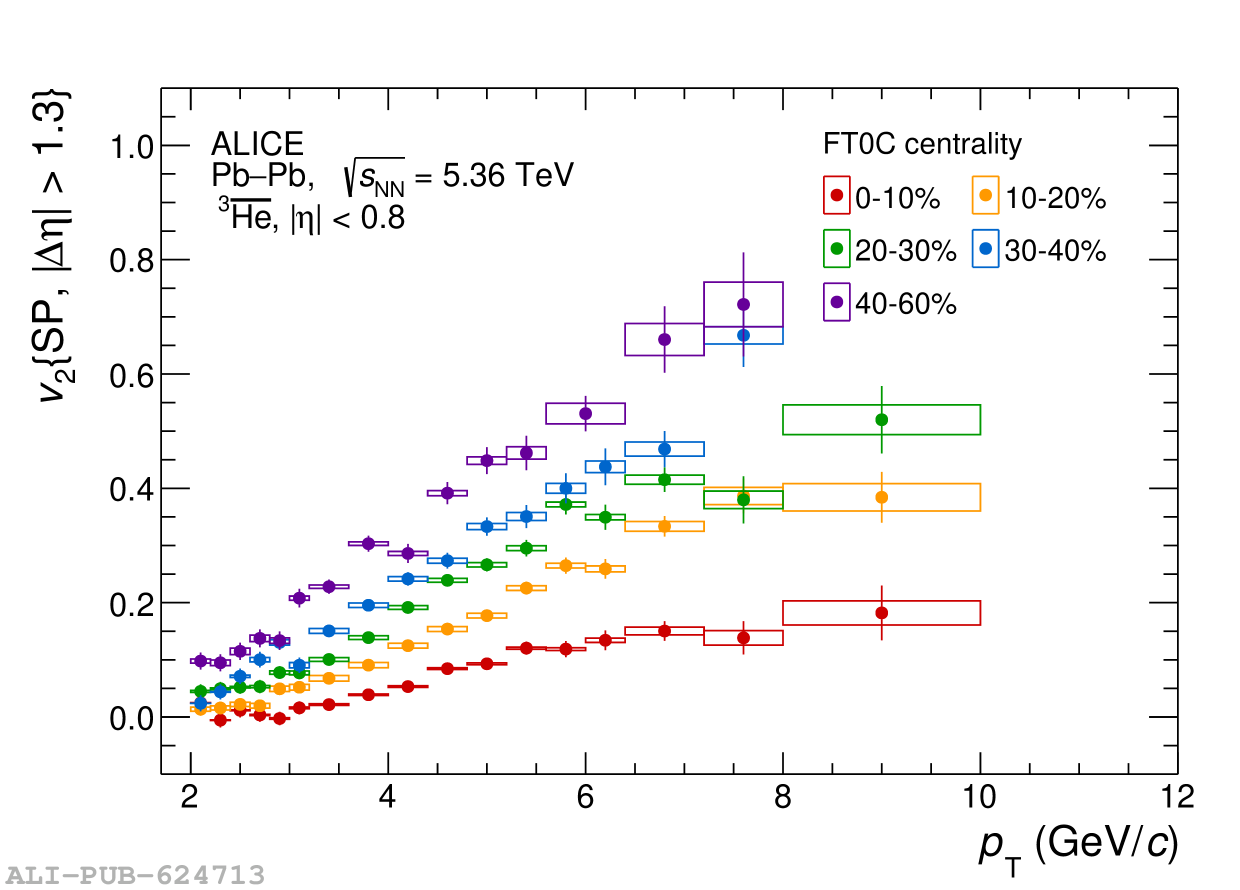 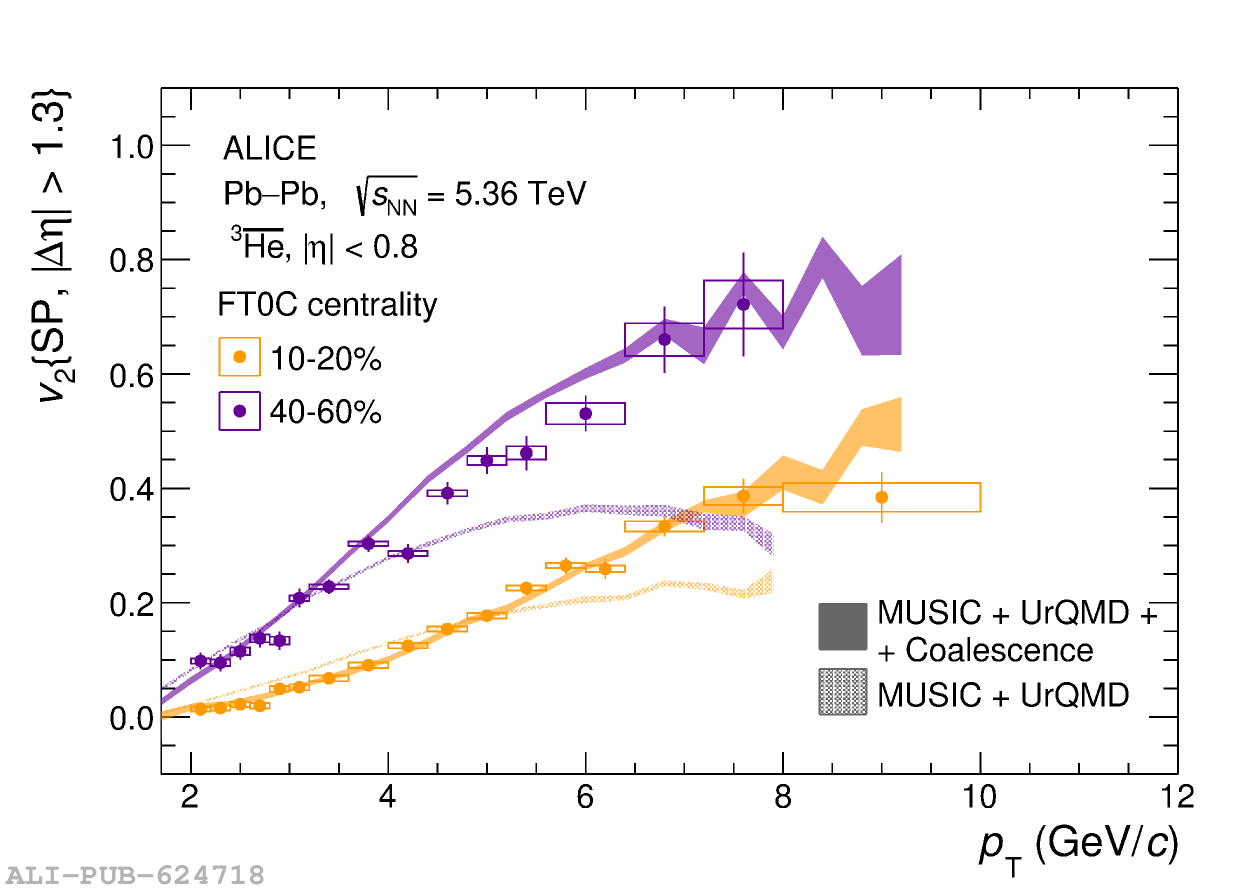 |