Instrumental effects on the jet energy measurement in the 0$-$10% (red) and 30$-$50% (green) central Pb$-$Pb collisions at $\sqrt{s_{\rm NN}}=5.02$ TeV for the jet resolution parameter $R=0.4$ for jets corrected with the area-based method as well as the ML-based background description for the 10% most central events (red open circle). When using the area-based correction method the jet reconstruction is done with a leading track bias of $p_{\rm T}=$ 7 GeV/$c$, while this is not the case for the machine learning based background description. For comparison, also the pp results at $\sqrt{s}=$ 5.02 TeV are shown with a leading track bias of $p_{\rm T}=$ 7 GeV/$c$ are shown in black. Upper panel: jet-by-jet distribution for various intervals in jet $p_{\rm T}$. Lower panels: the JES is the mean (left) and JER is the standard deviation (right) of these distributions. The gray bands indicate the $p_{\rm T}$ regions not taken into account for the final measurements. | 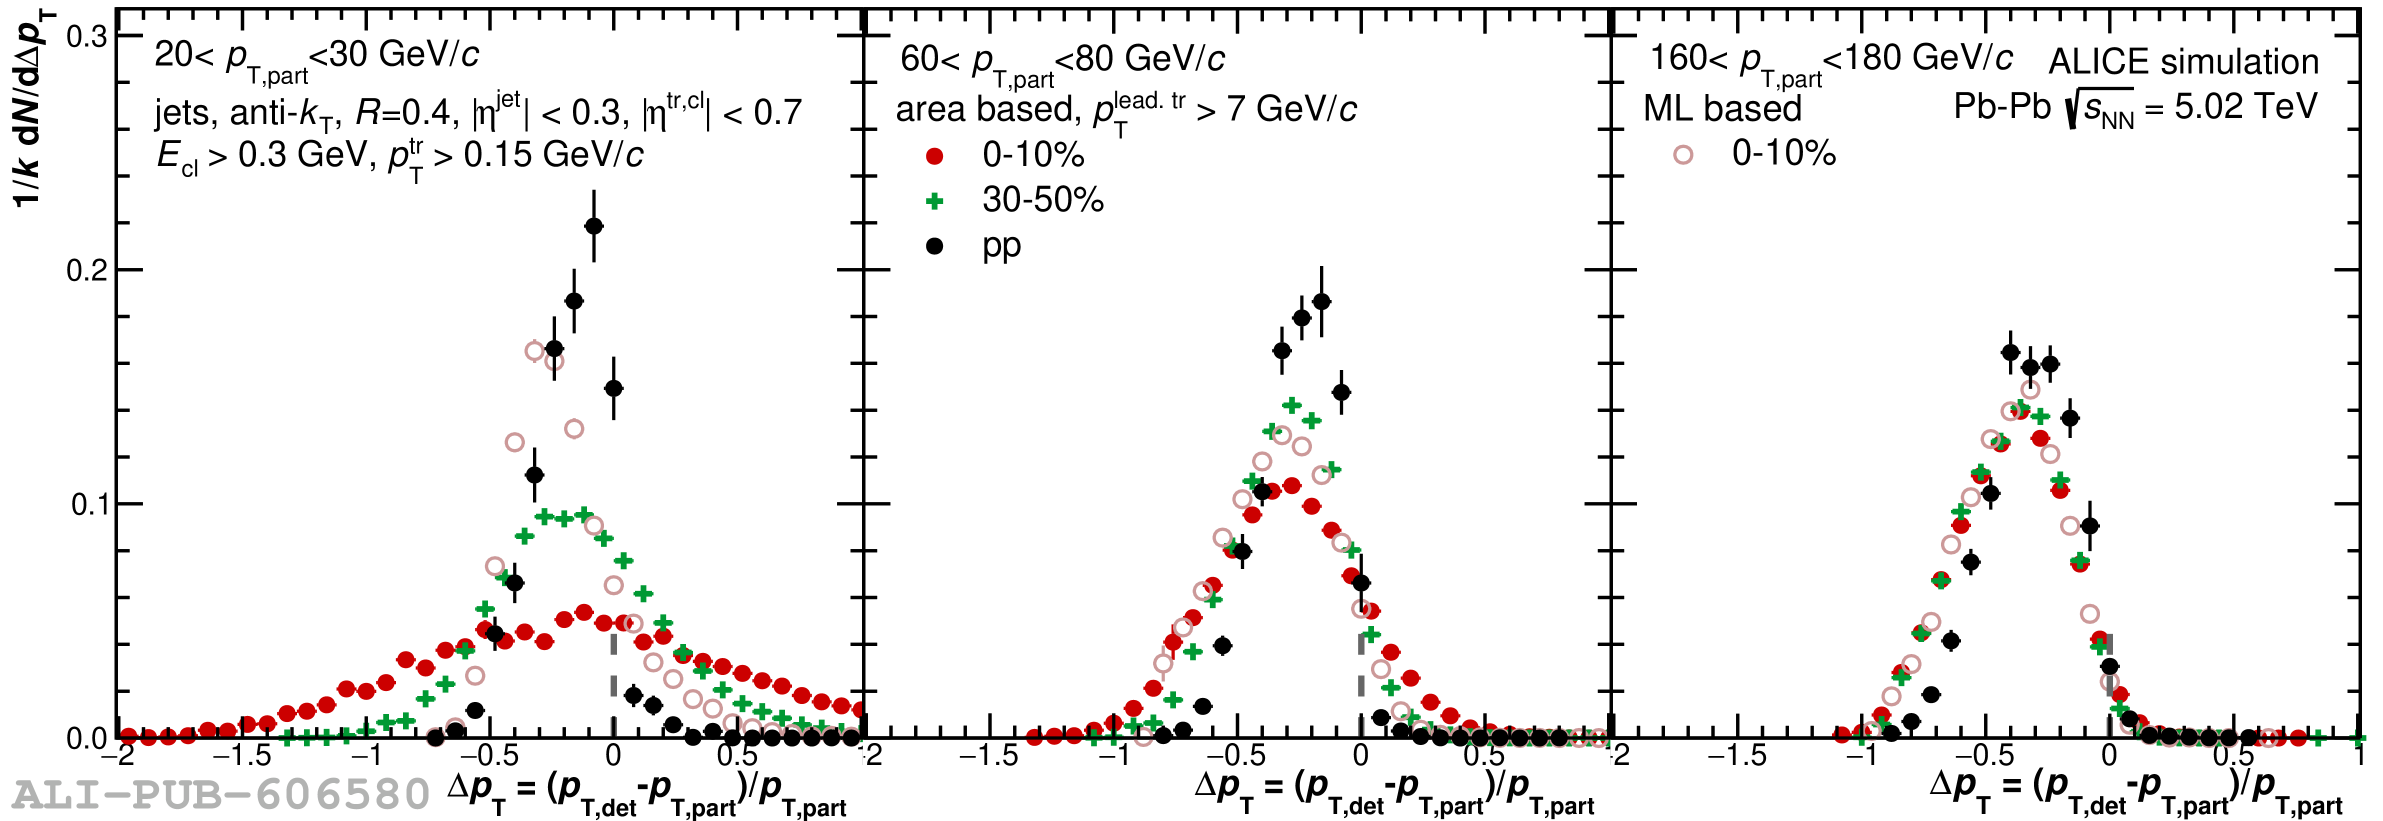 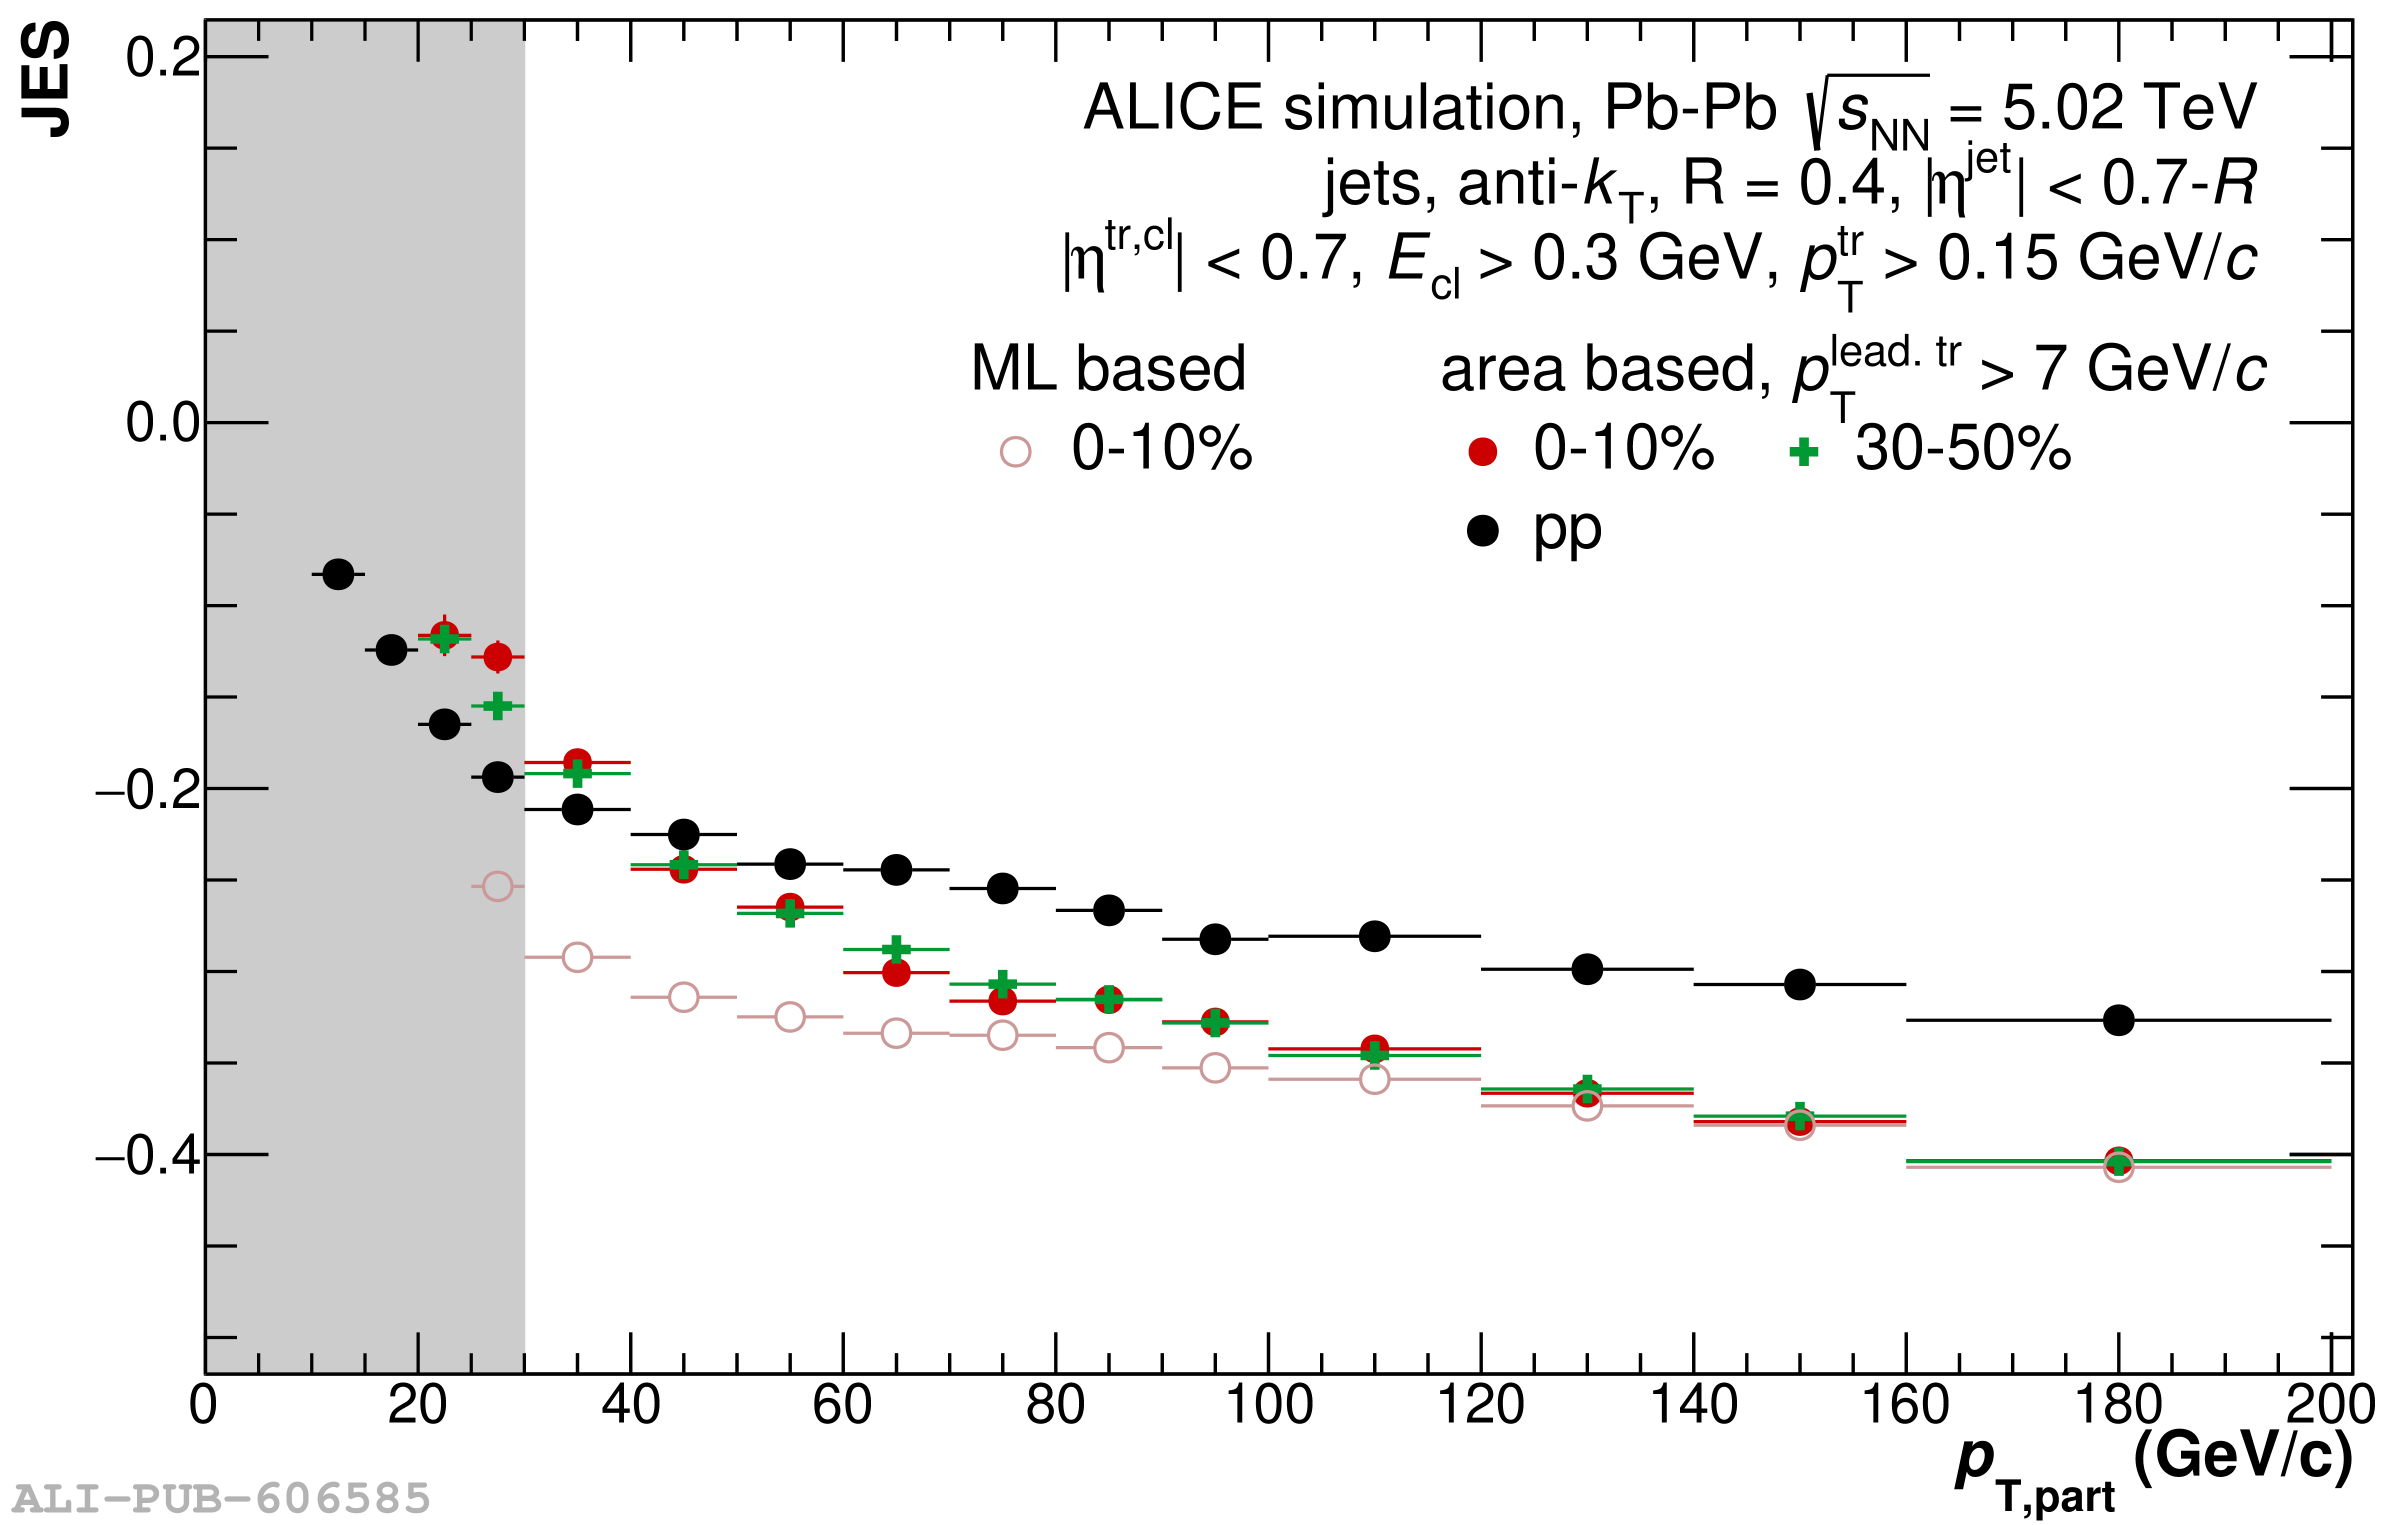 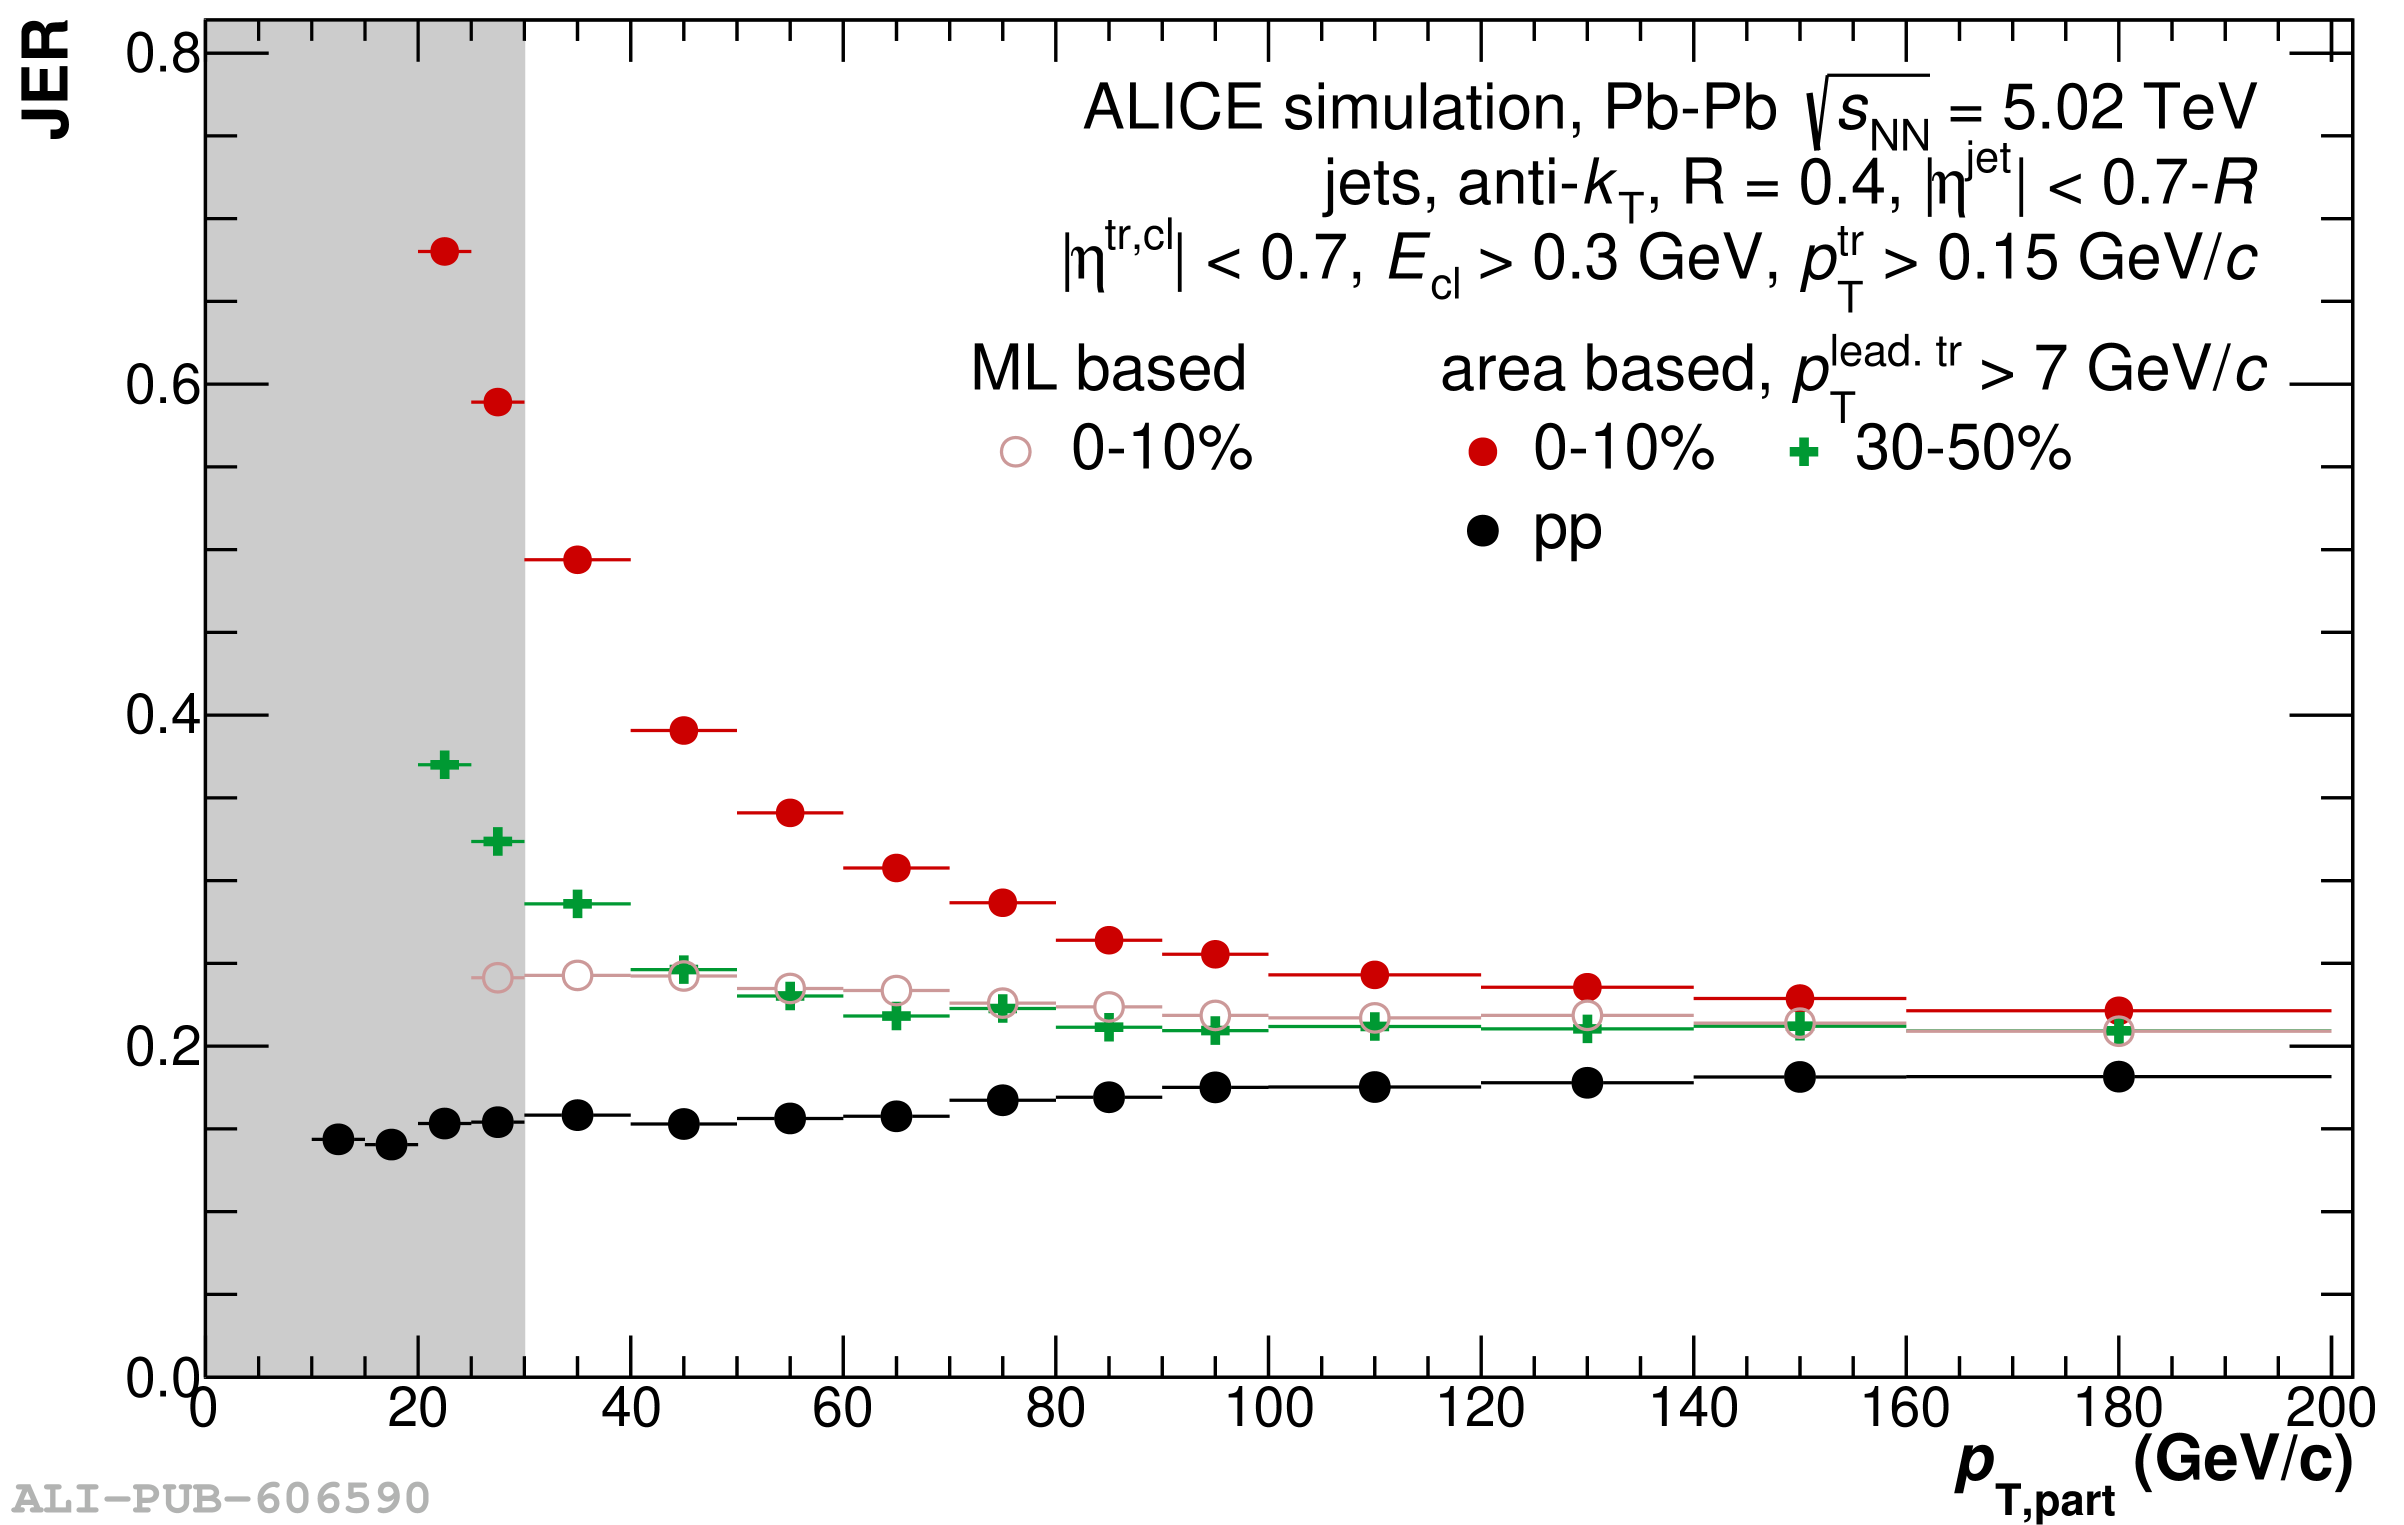 |