Left: Decomposition of the $\sigma_{\rm long}^{2}$ distribution at 90 $ < p_{\rm T} < $ 100 GeV/$c$ in its contributions from neutral pions reconstructed with both photons in one cluster (full black dots) or only one photon (open black dots) based on PYTHIA8 di-jet simulations. Additionally, the contributions from $\eta$ mesons (open blue dots), direct photons (orange histogram), primary electrons (green histogram) and other hadrons (blue histogram) are displayed. Right: Comparison of the $\sigma_{\rm long}^{2}$ distribution between data (black) and simulation (red). | 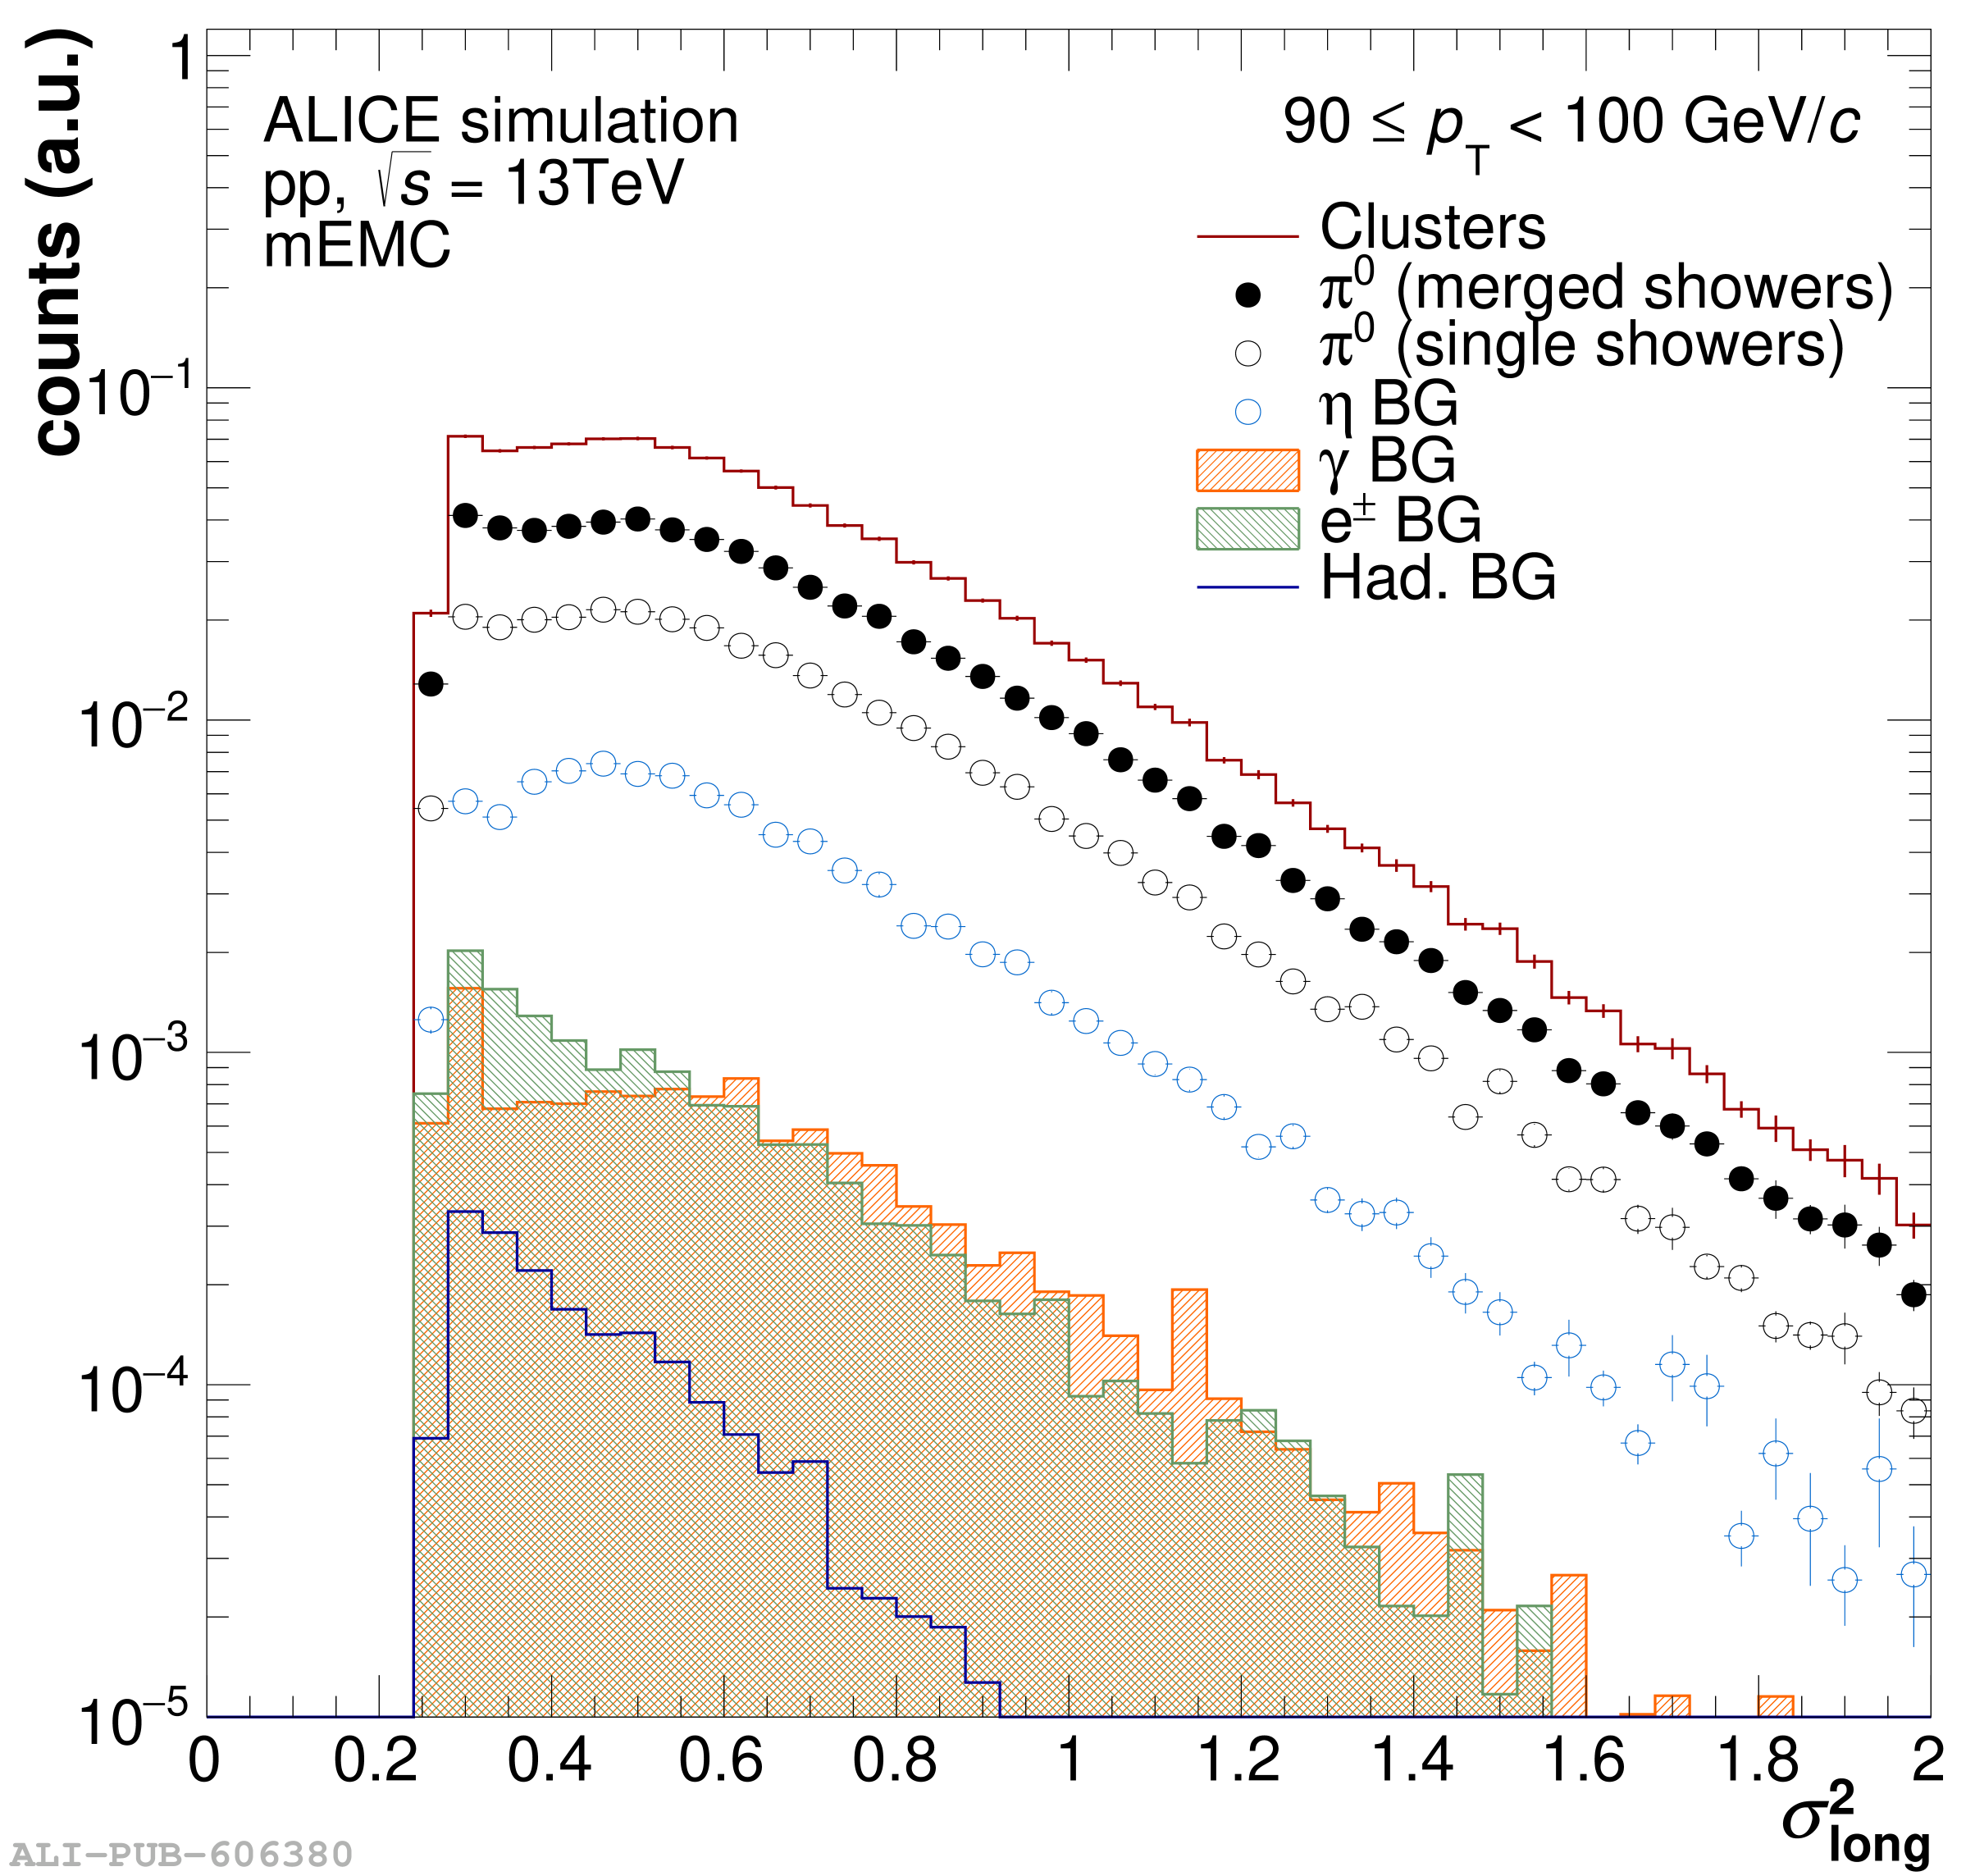 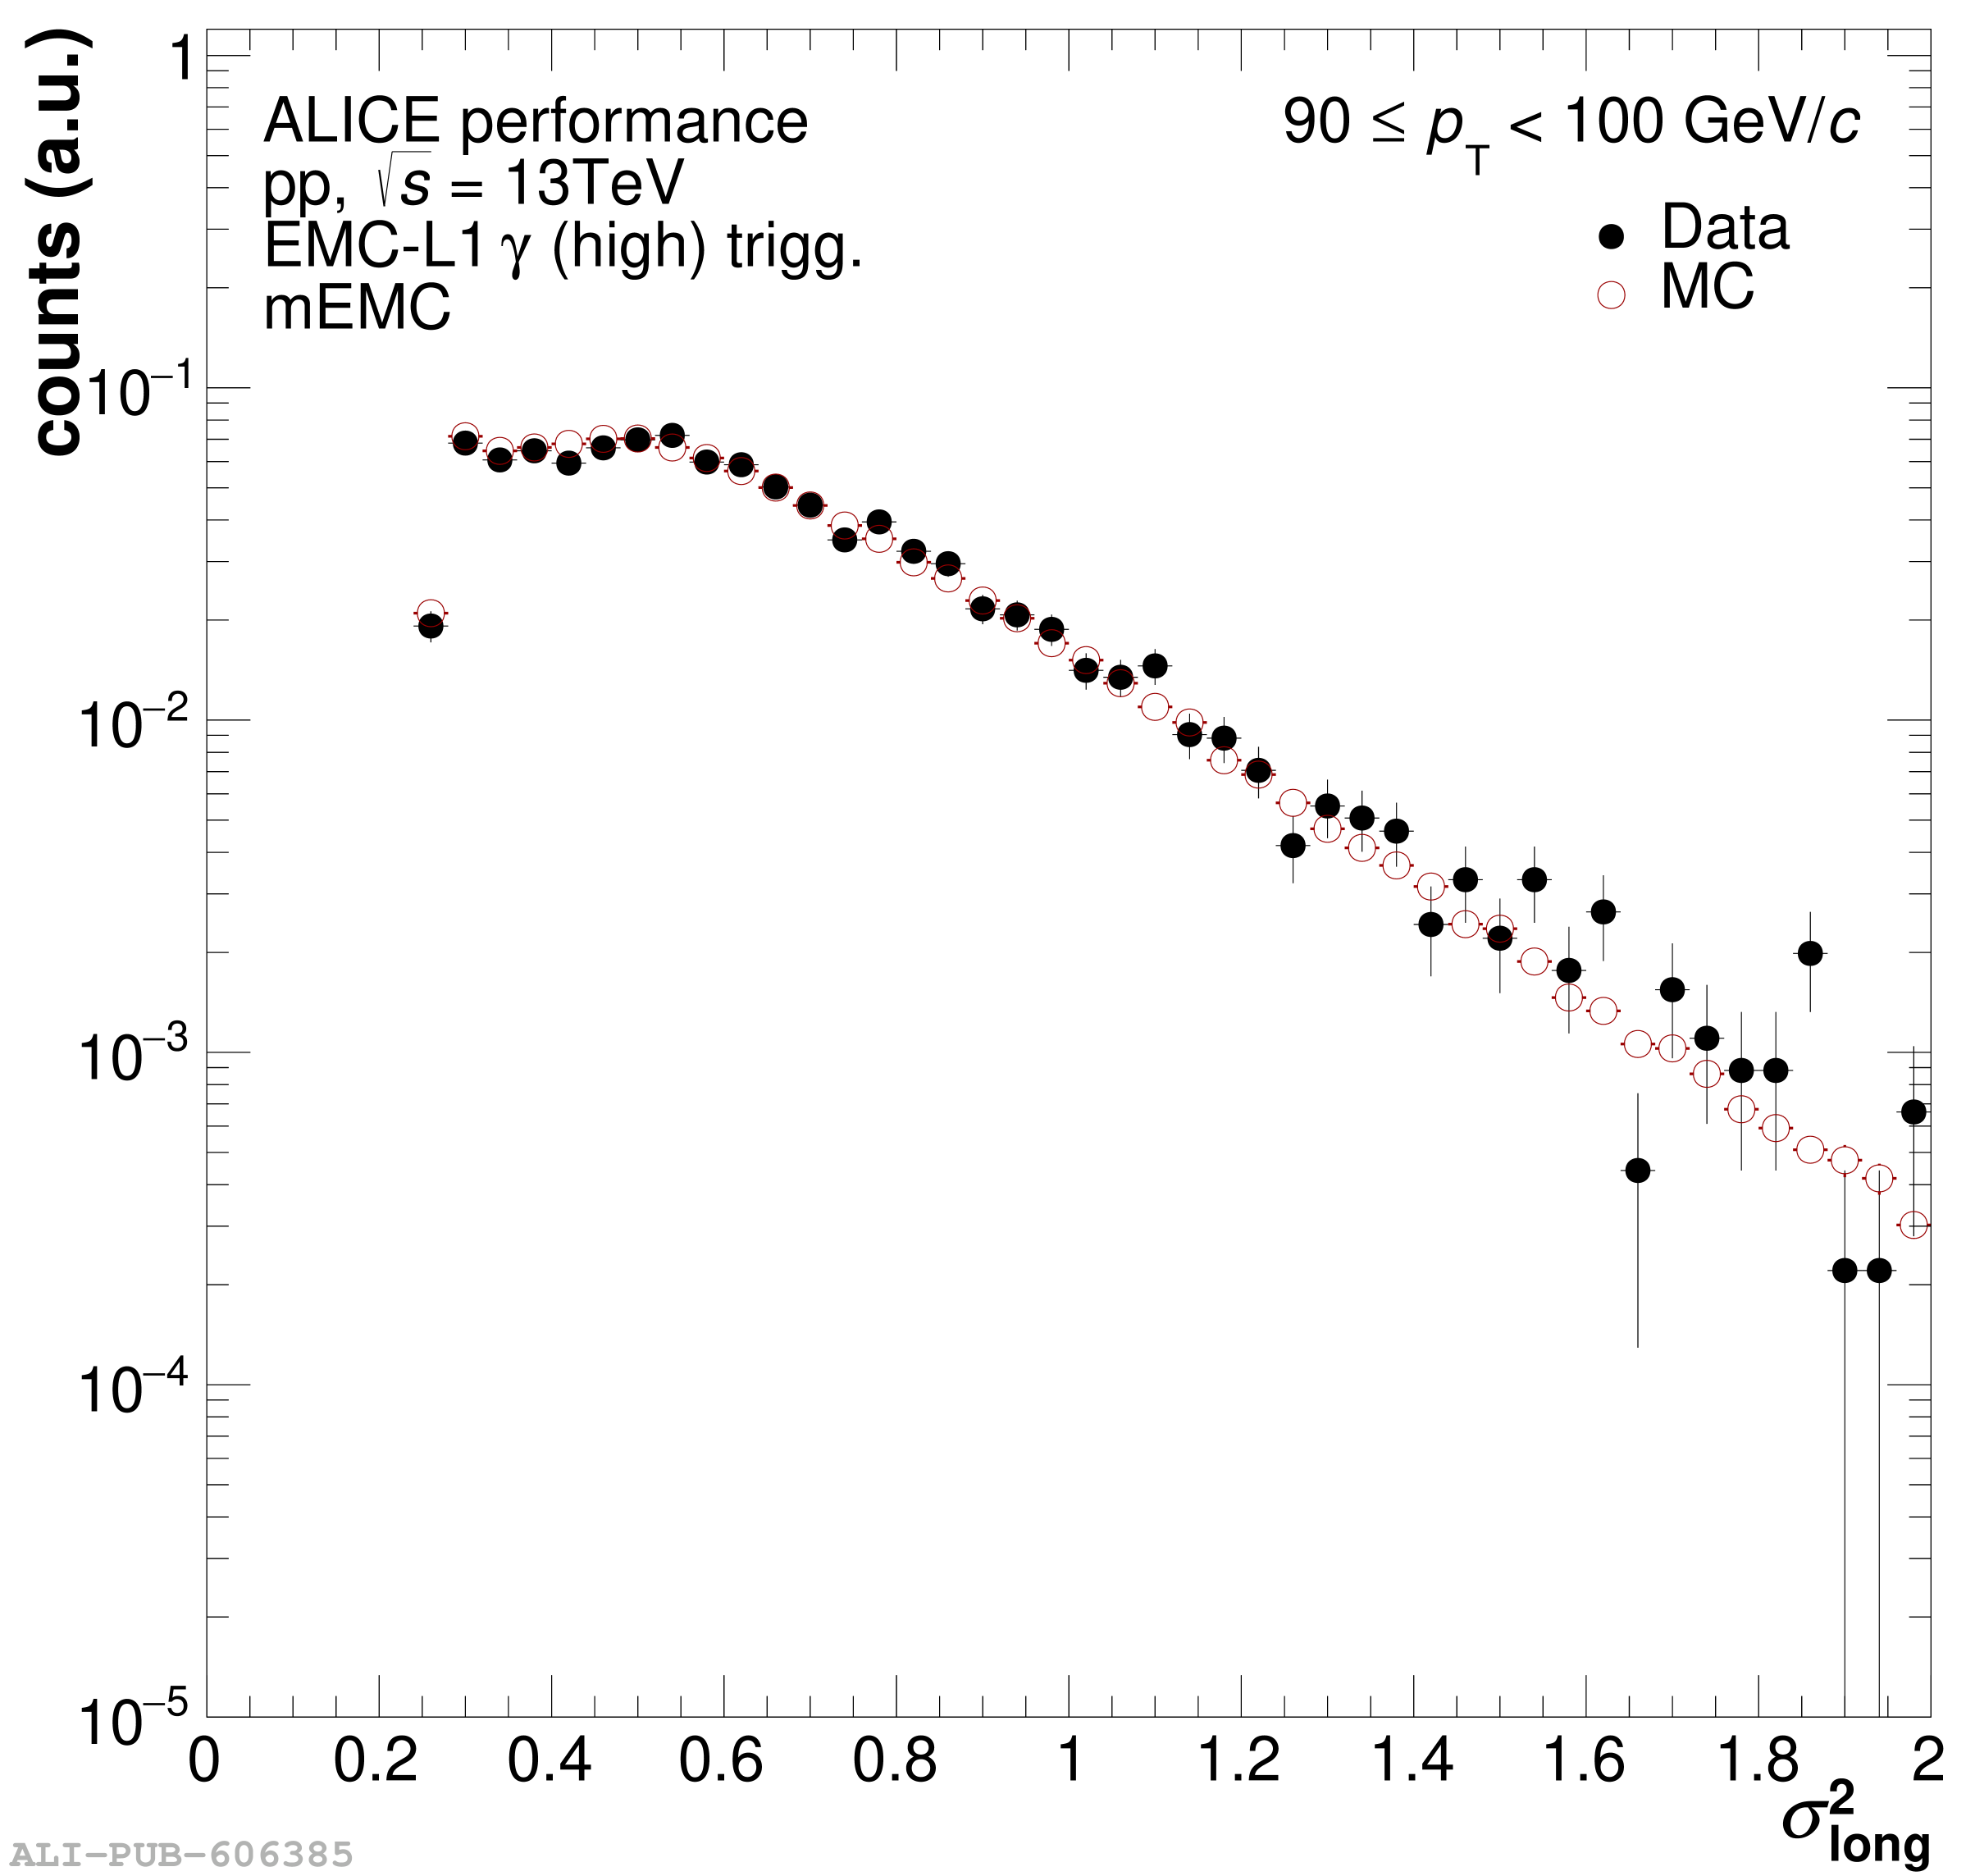 |