Left: energy distribution of single cell clusters obtained from scans with a 6 GeV muon-beam. Right: energy distribution of clusters obtained from scans with a 6 GeV electron beam. For both cases, the data are shown with black markers and compared with the predictions from MC simulations with GEANT3 and GEANT4 transport codes. | 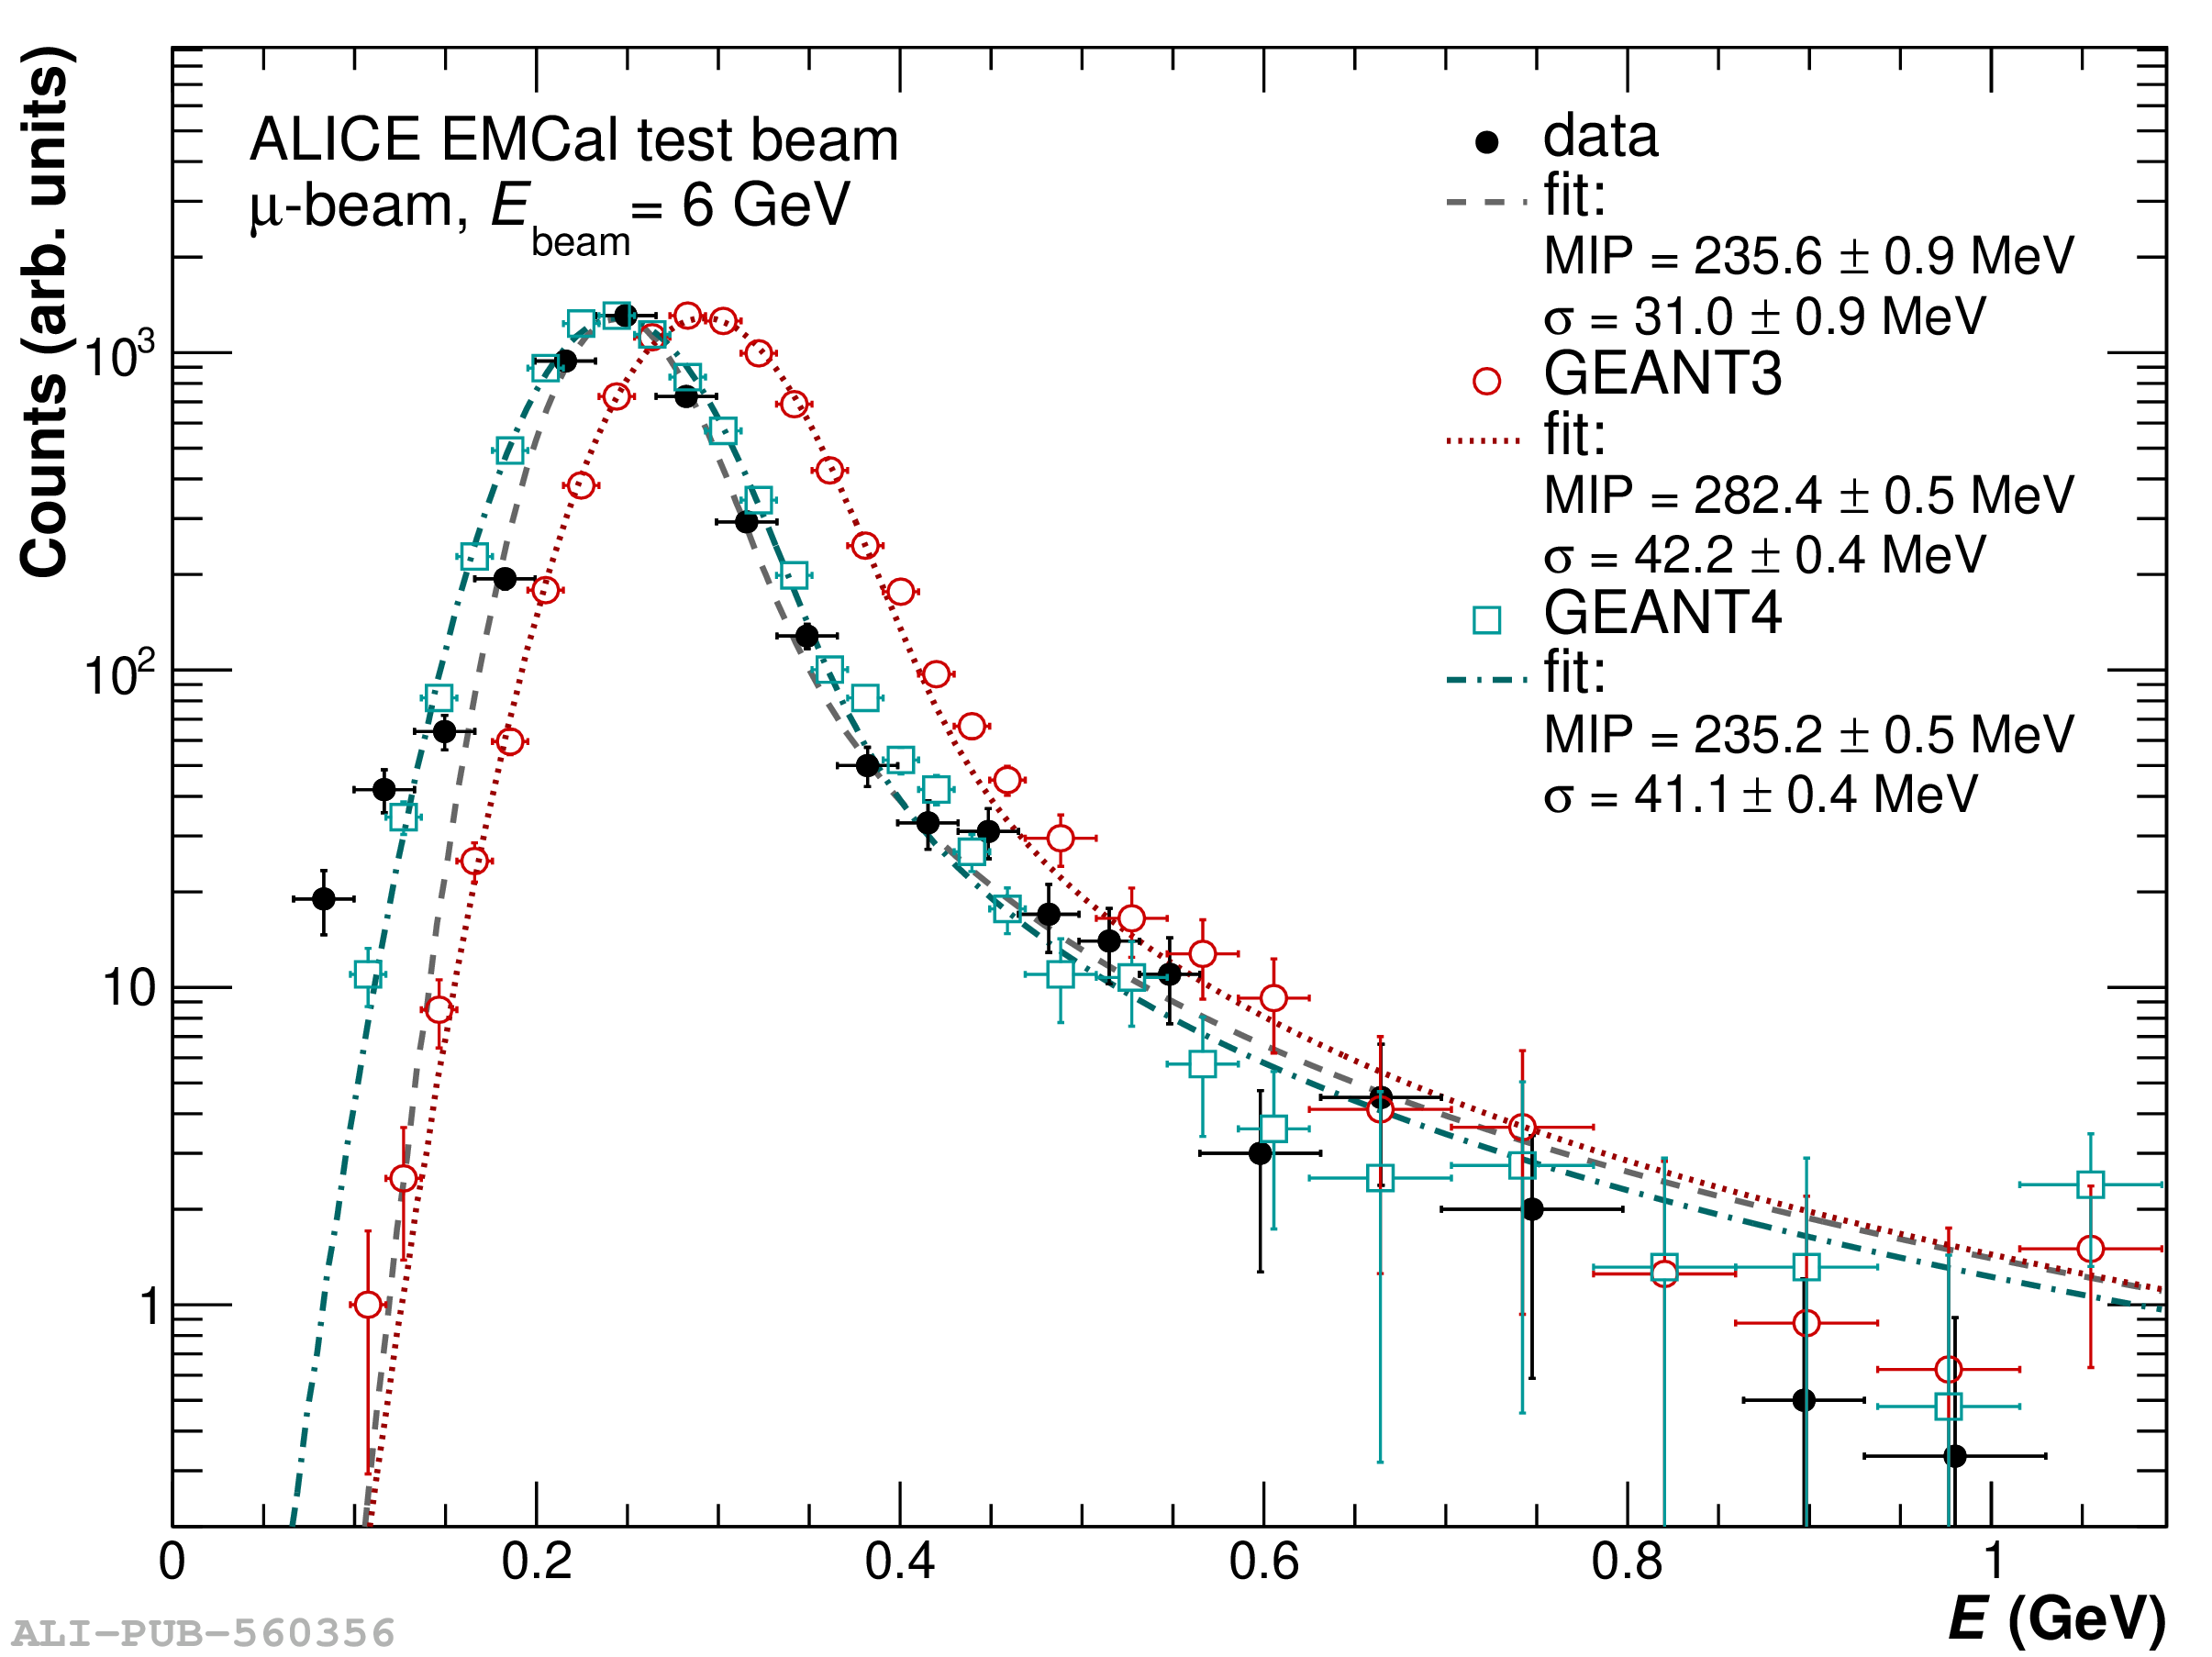 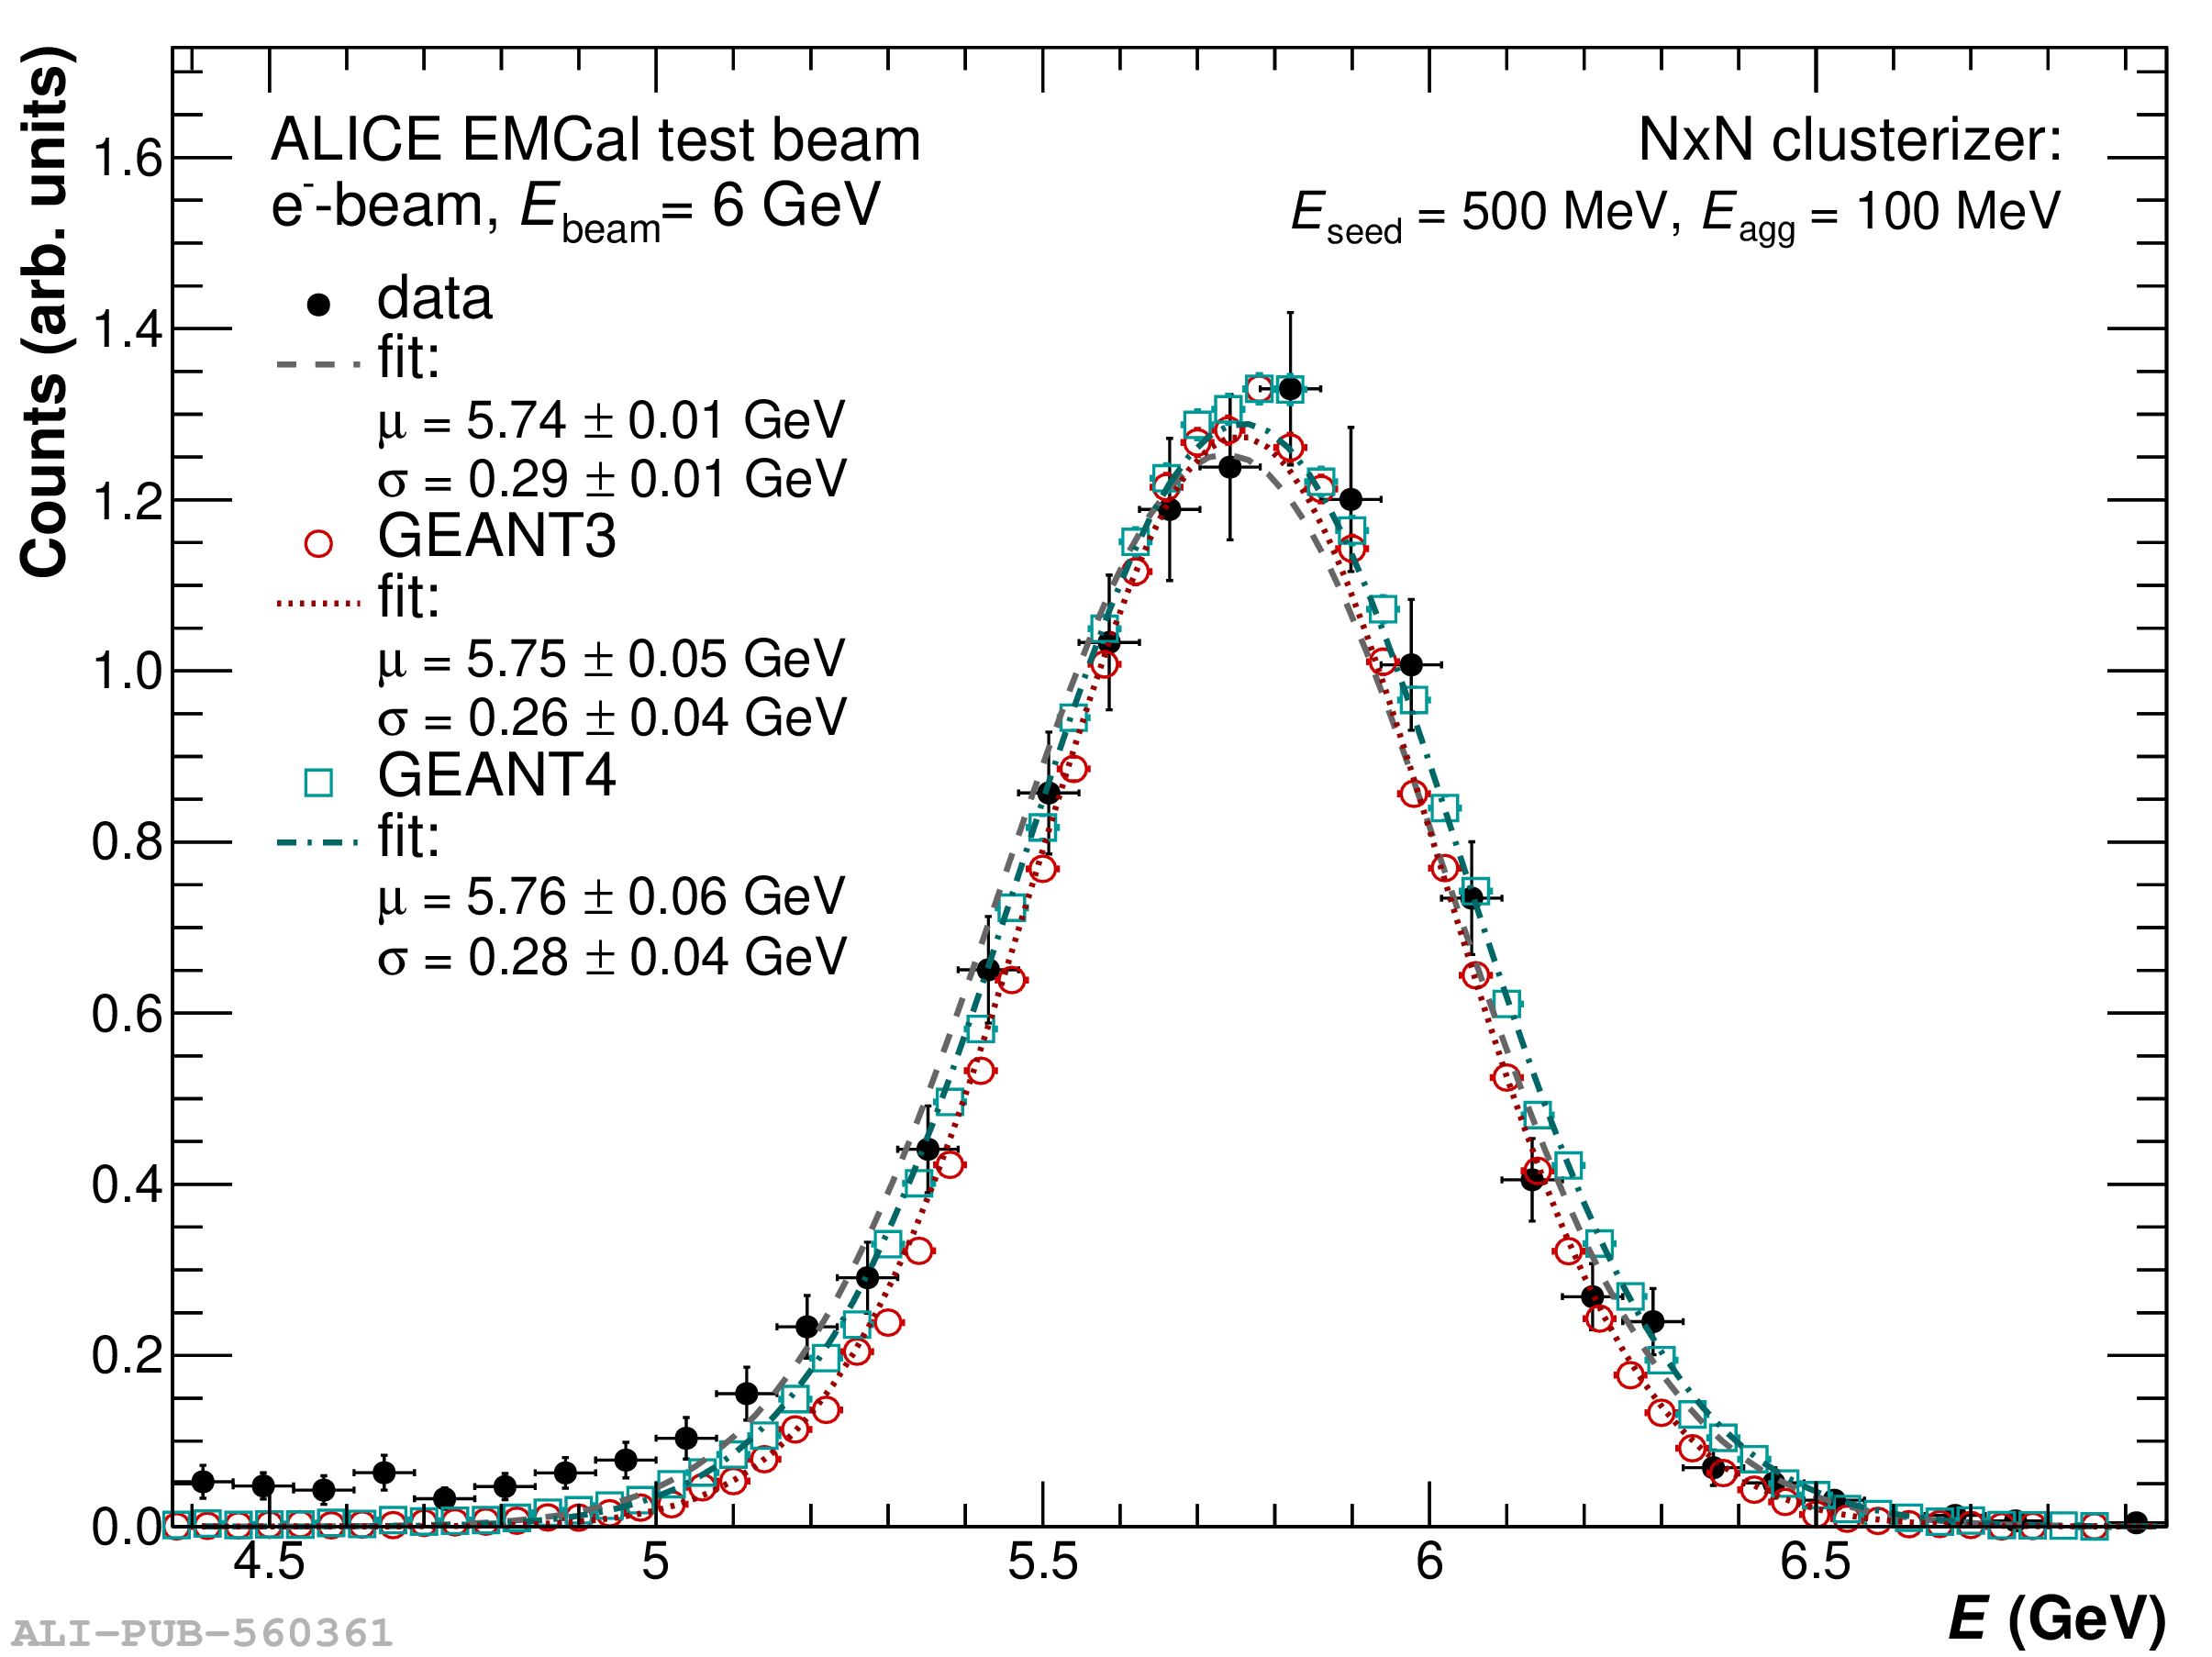 |