Mean number of clusters per event as a function of the run index for pp collisions at $\sqrt{s}=$ 13 TeV. Example runs with similar data-taking conditions are displayed. Only clusters with energy above 0.5 GeV were used for the mean estimation. The gray vertical lines correspond to the start of different data-taking years. | 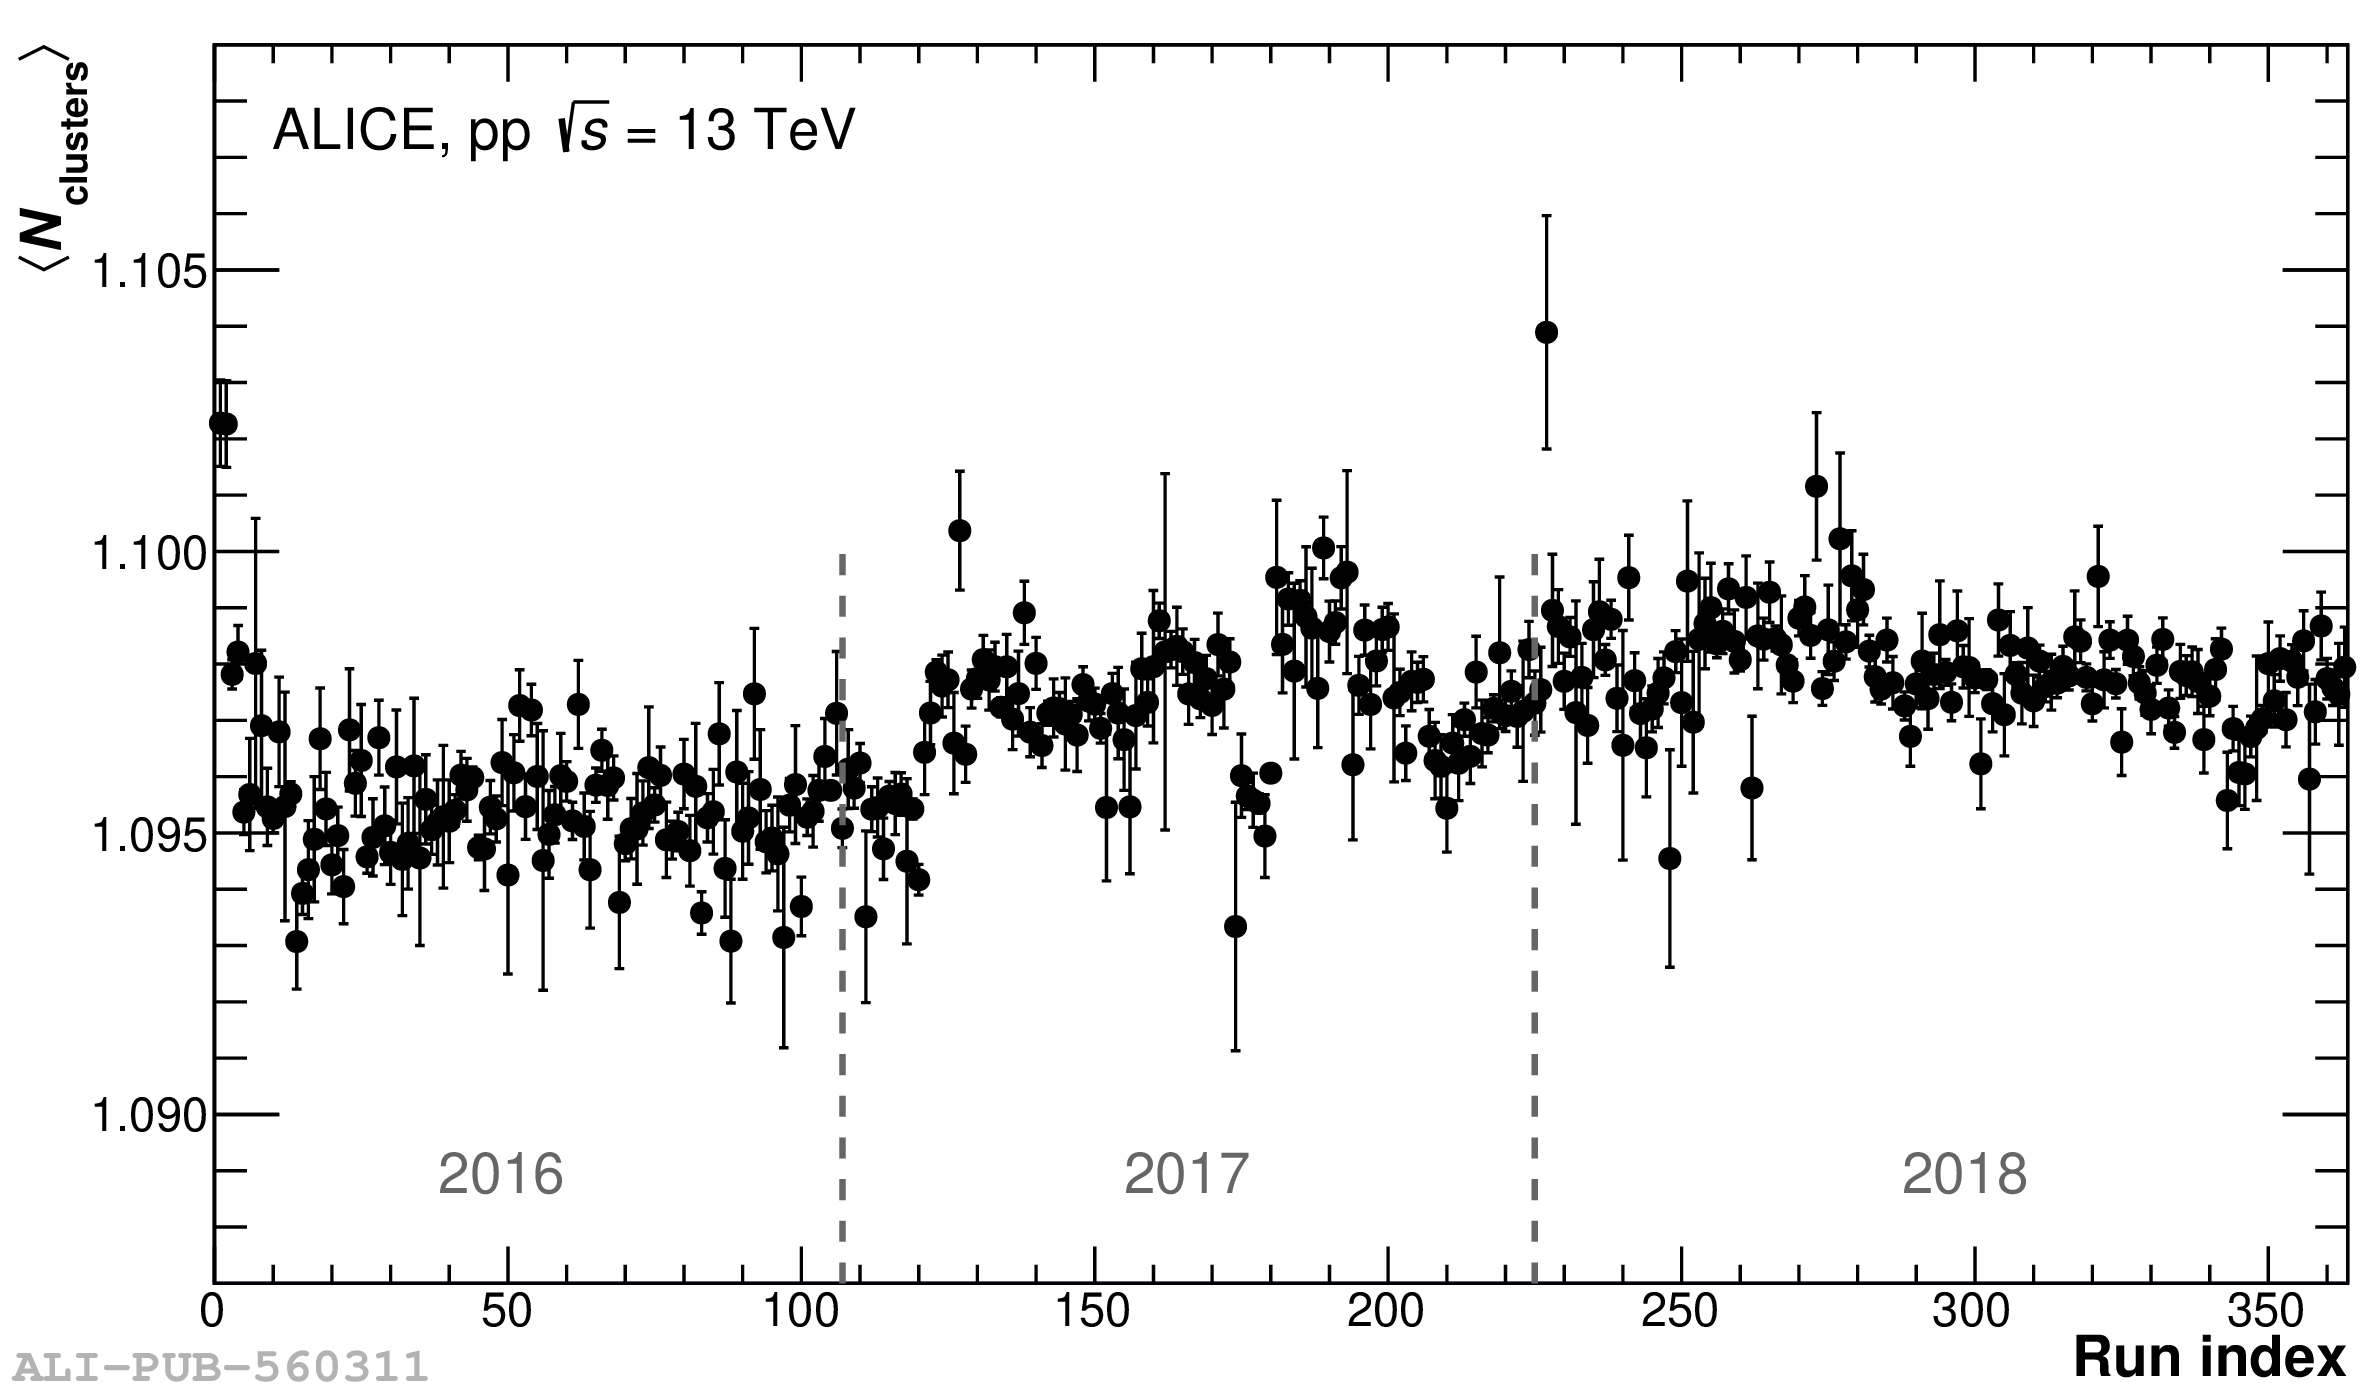 |