Distribution of the opening angle $\theta_{12}$ of two decay photons from $\pi^{0}$ (left) and $\eta$ (right) mesons decays as a function of the meson energy obtained at generator level from a MC simulation. The horizontal lines indicate the opening angle corresponding to a width of approximately 1, 3 and 5 cells separating the two photons. Two photons completely merge into one cluster if they fall below the one cell distance, while they start merging at a width of approximately 3 cells, depending on the clusterizer. The colored vertical lines correspond to the energy limits where two photons could still be fully resolved using the V1 (blue) and V2 (red) clusterizers. | 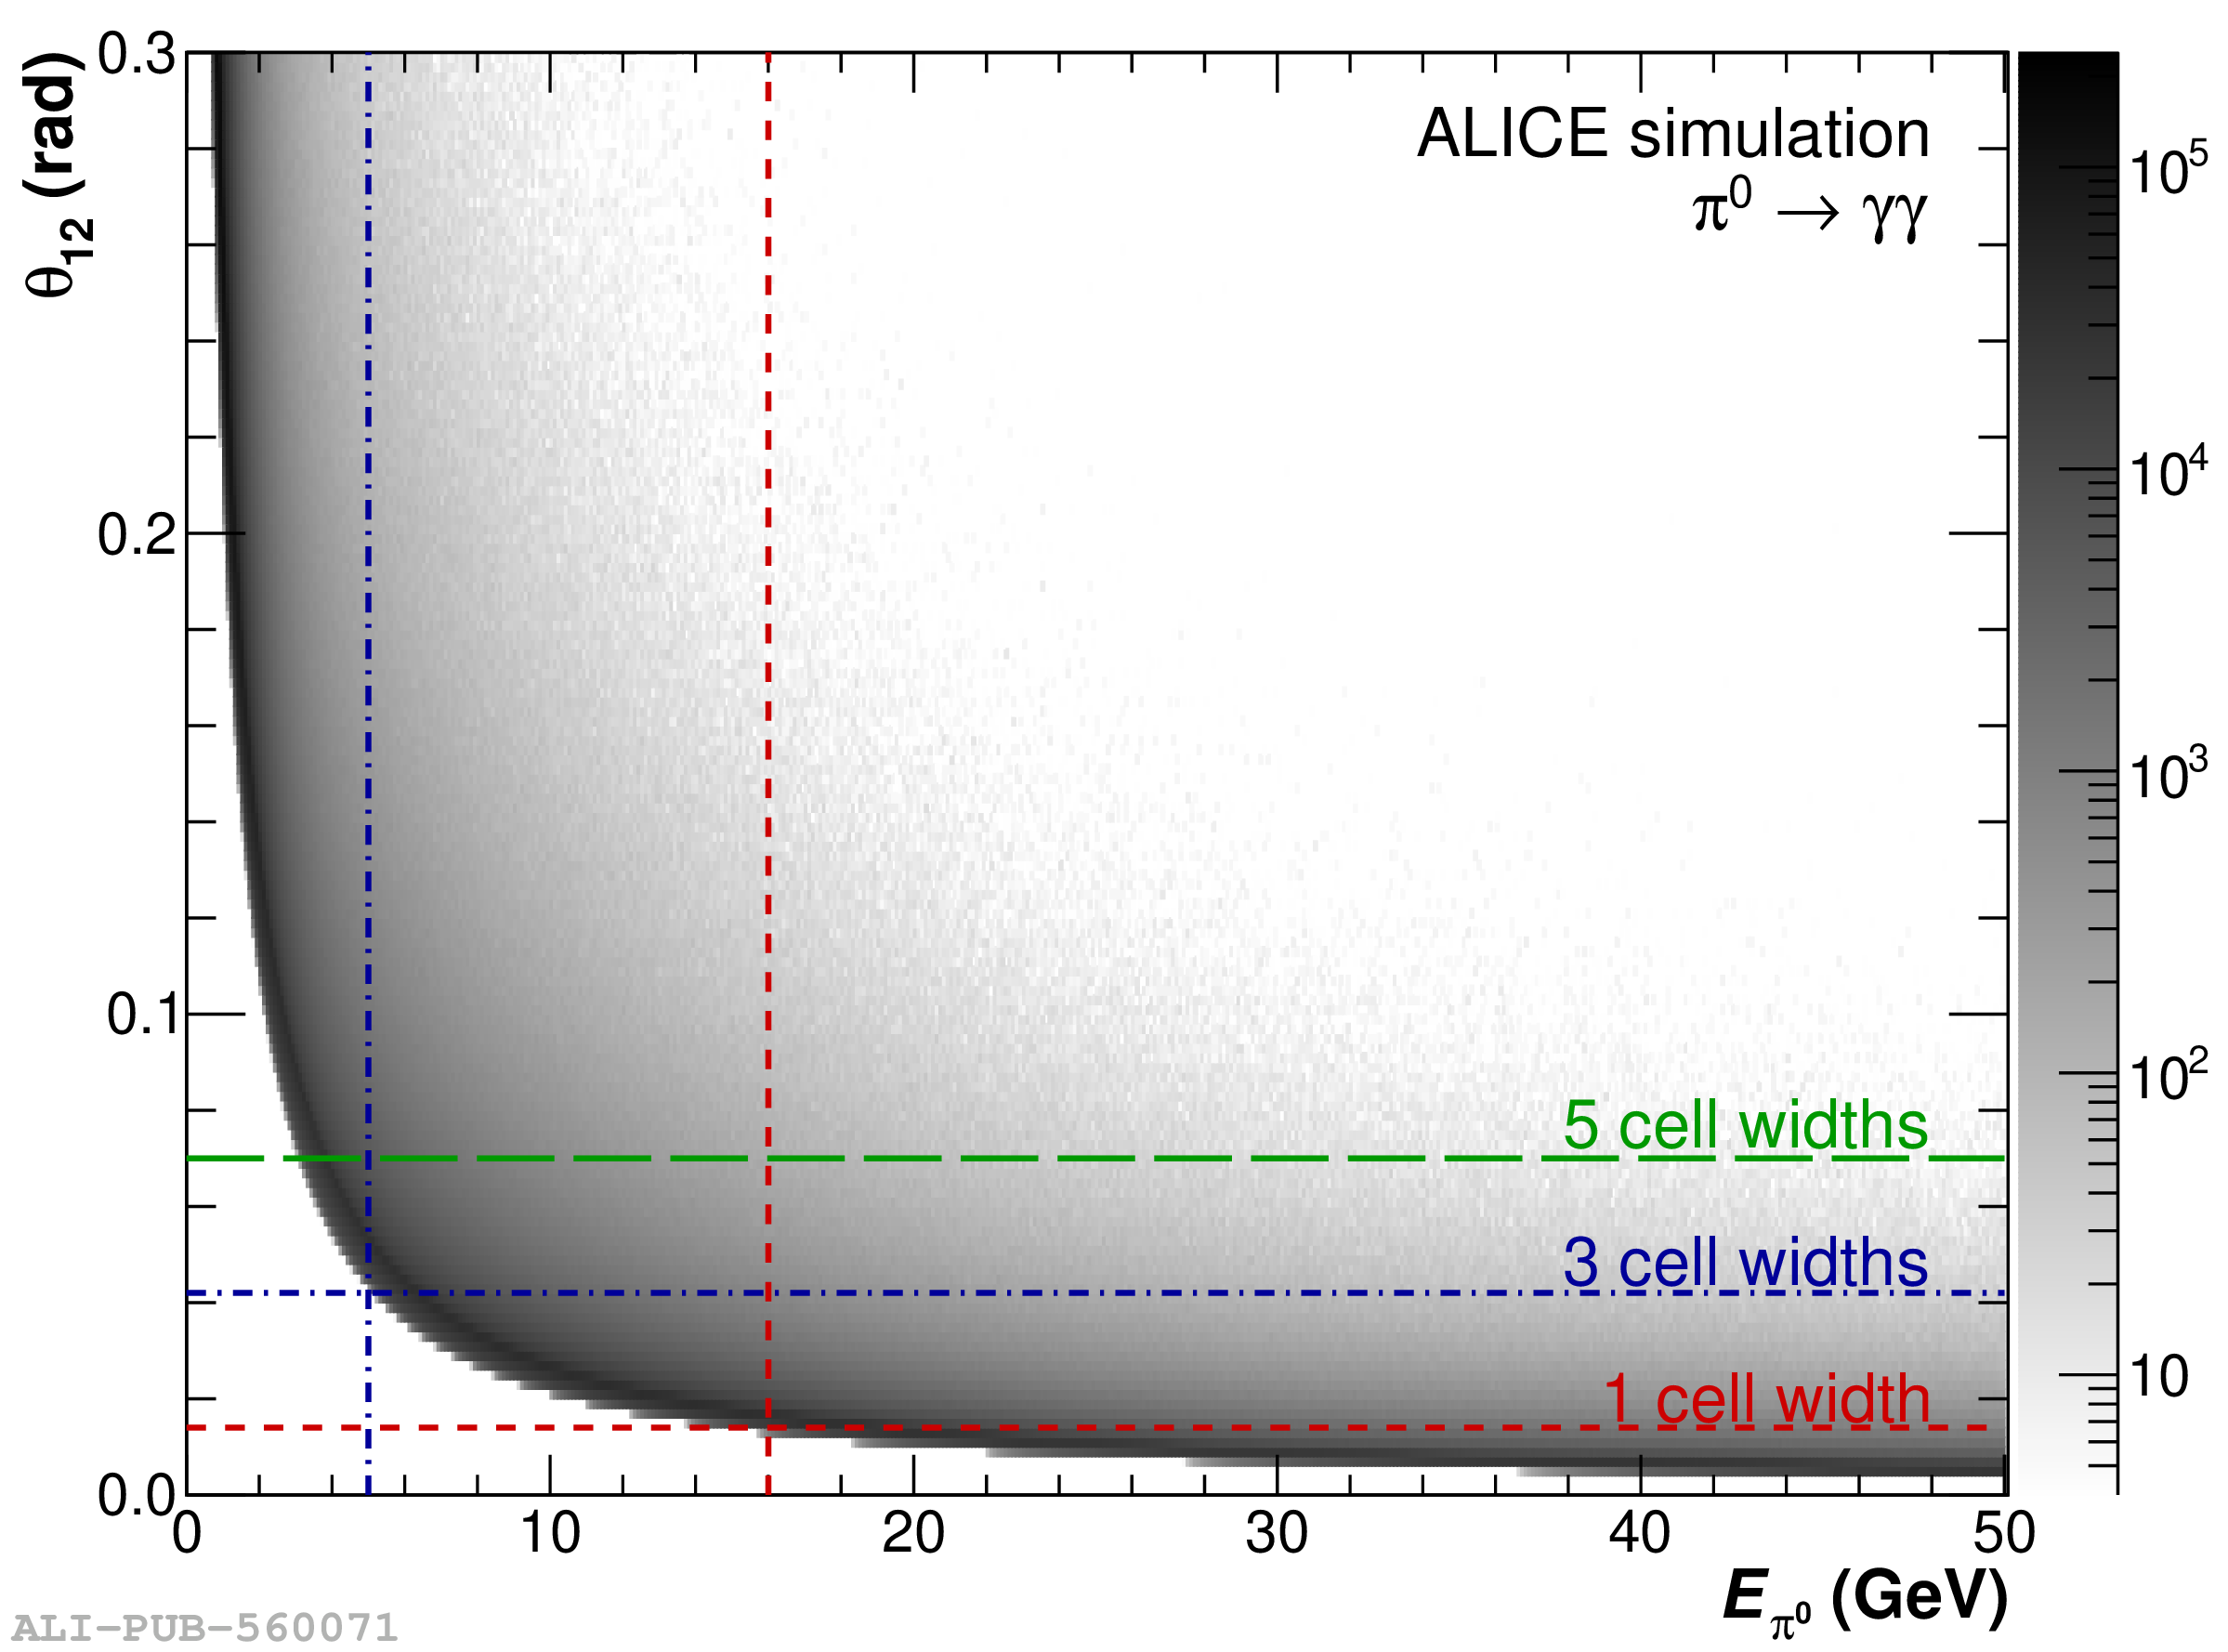 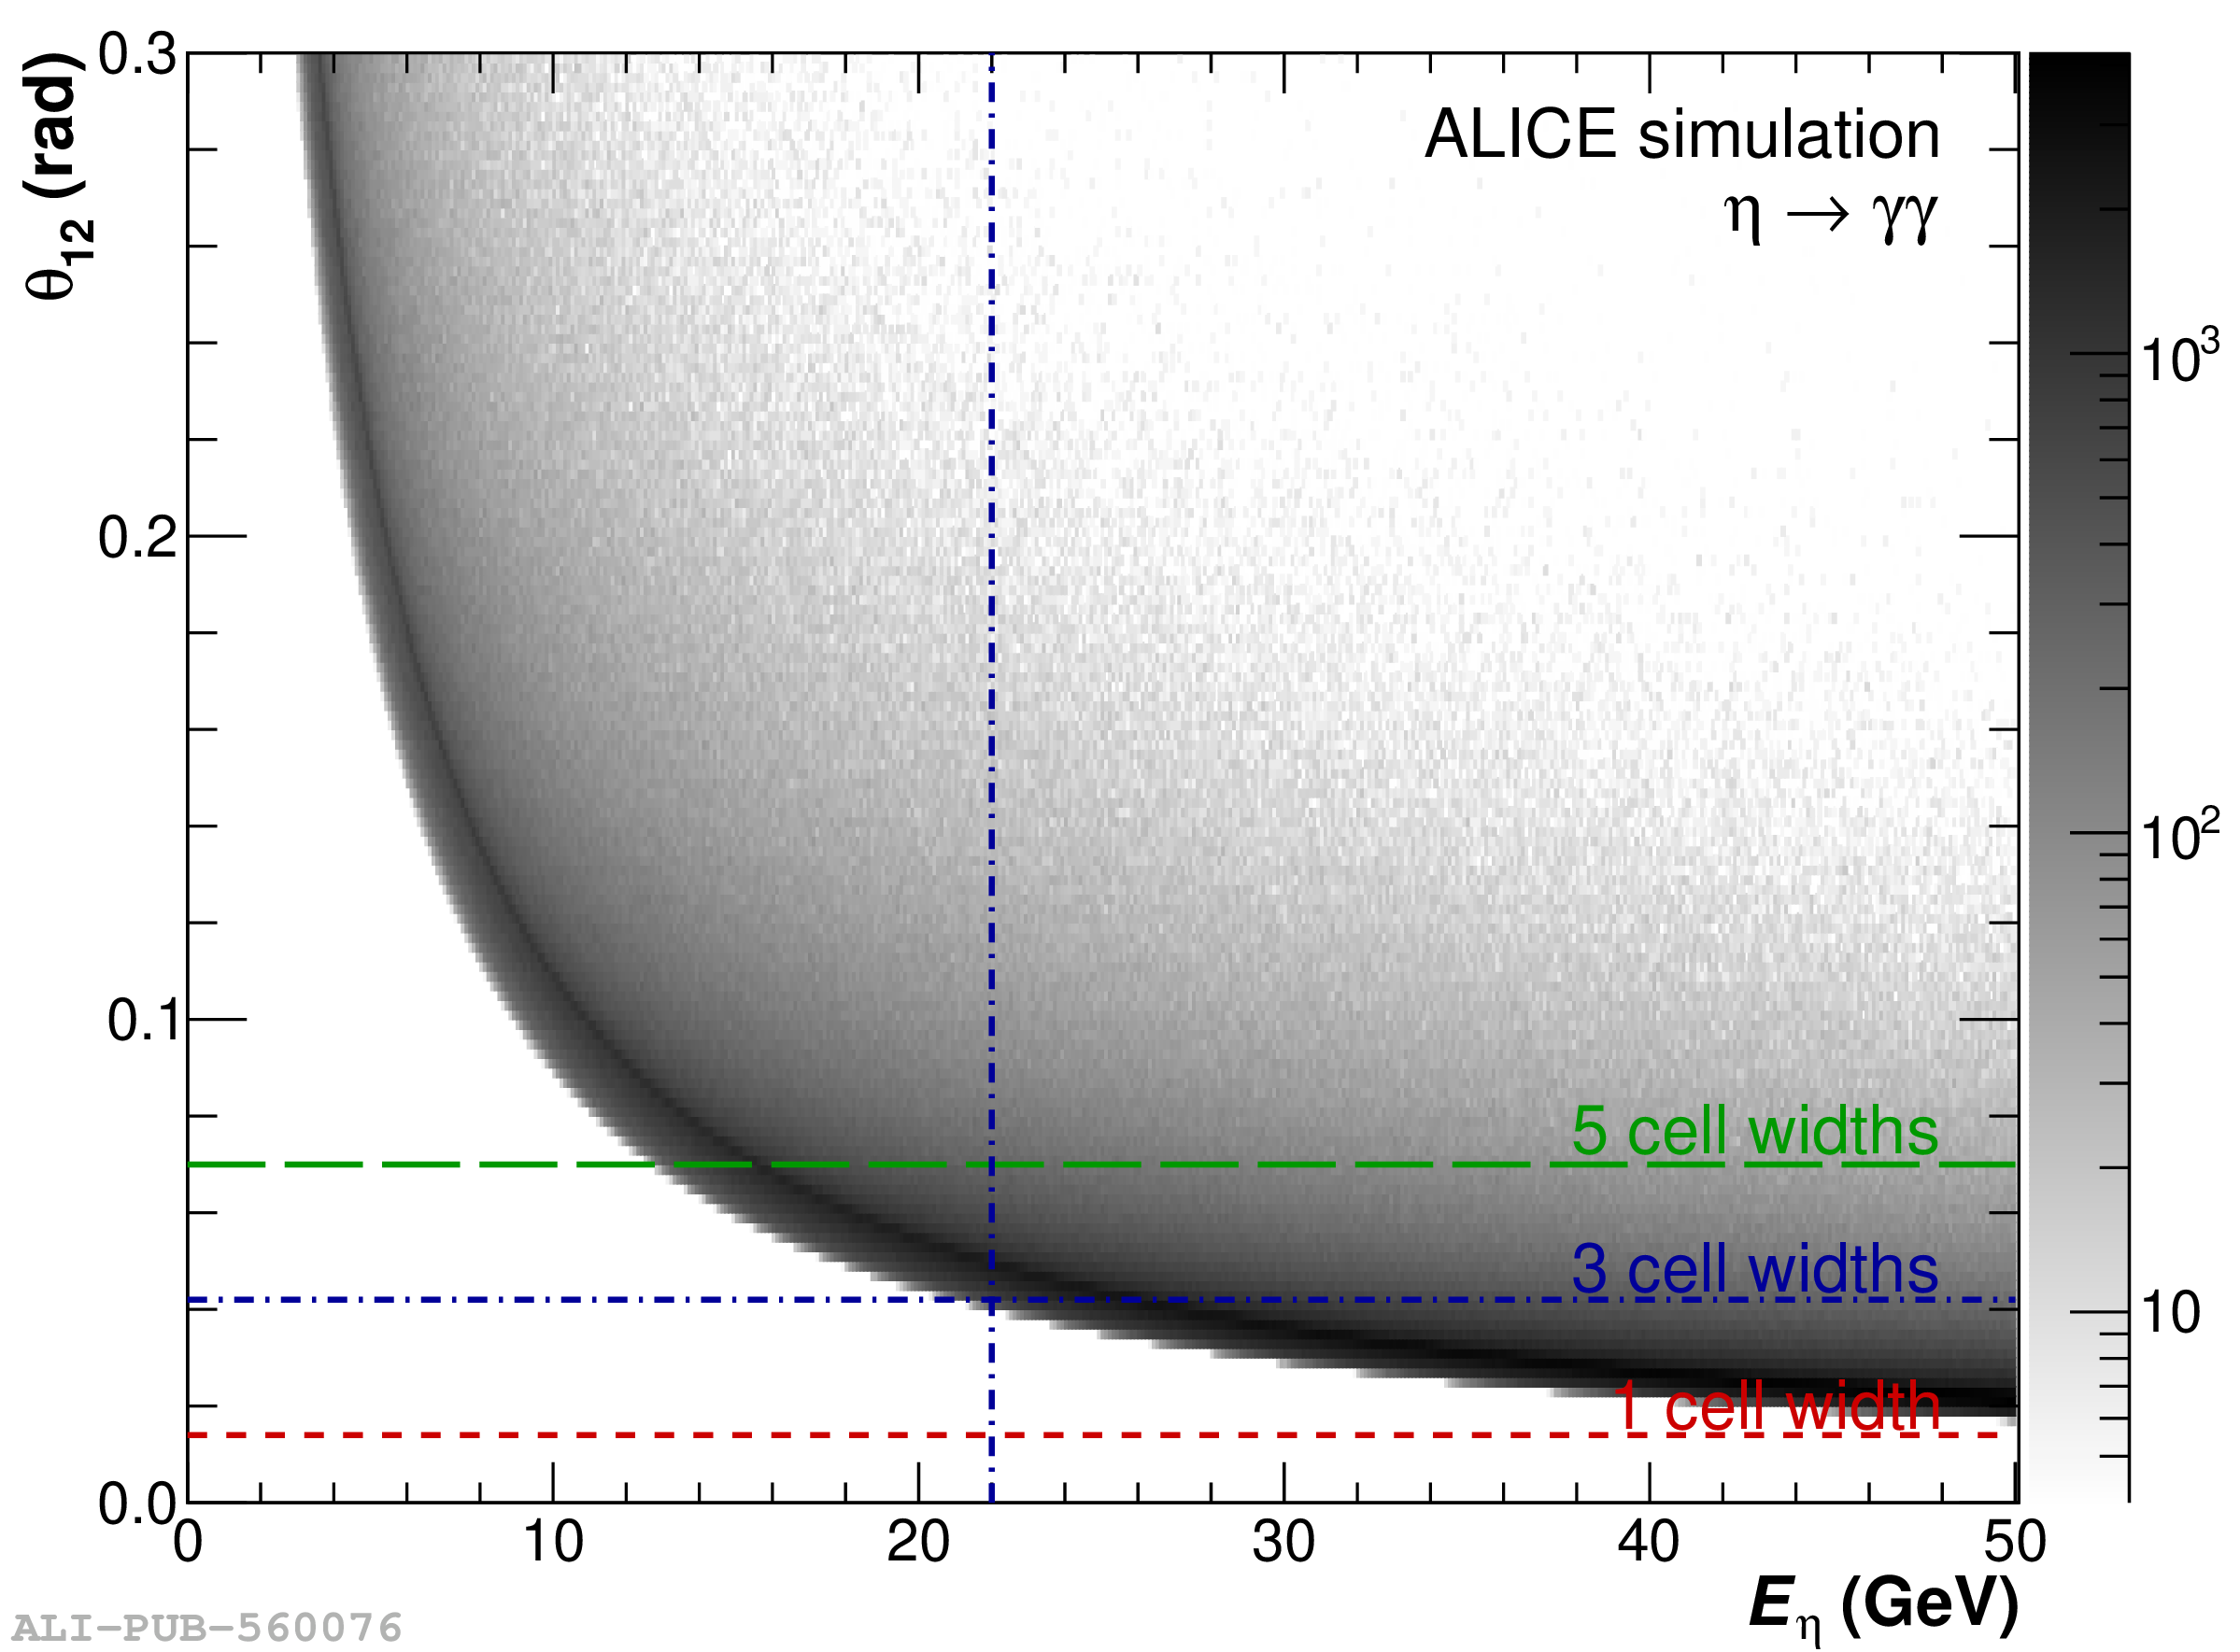 |