The V0C distributions in minimum-bias events in data and PYTHIA 8.2 Monash MC . The chosen multiplicity classes are indicated by alternating gray and white areas. The percentile ranges corresponding to the multiplicity classes (from low to high multiplicities) are 70-100%, 50-70%, 40-50%, 30-40%, 20-30%, 15-20%, 10-15%, 5-10%, 1-5%, 0.5-1%, 0.25-0.5%, 0-0.25%. The bottom panel shows the ratio between data and MC. | 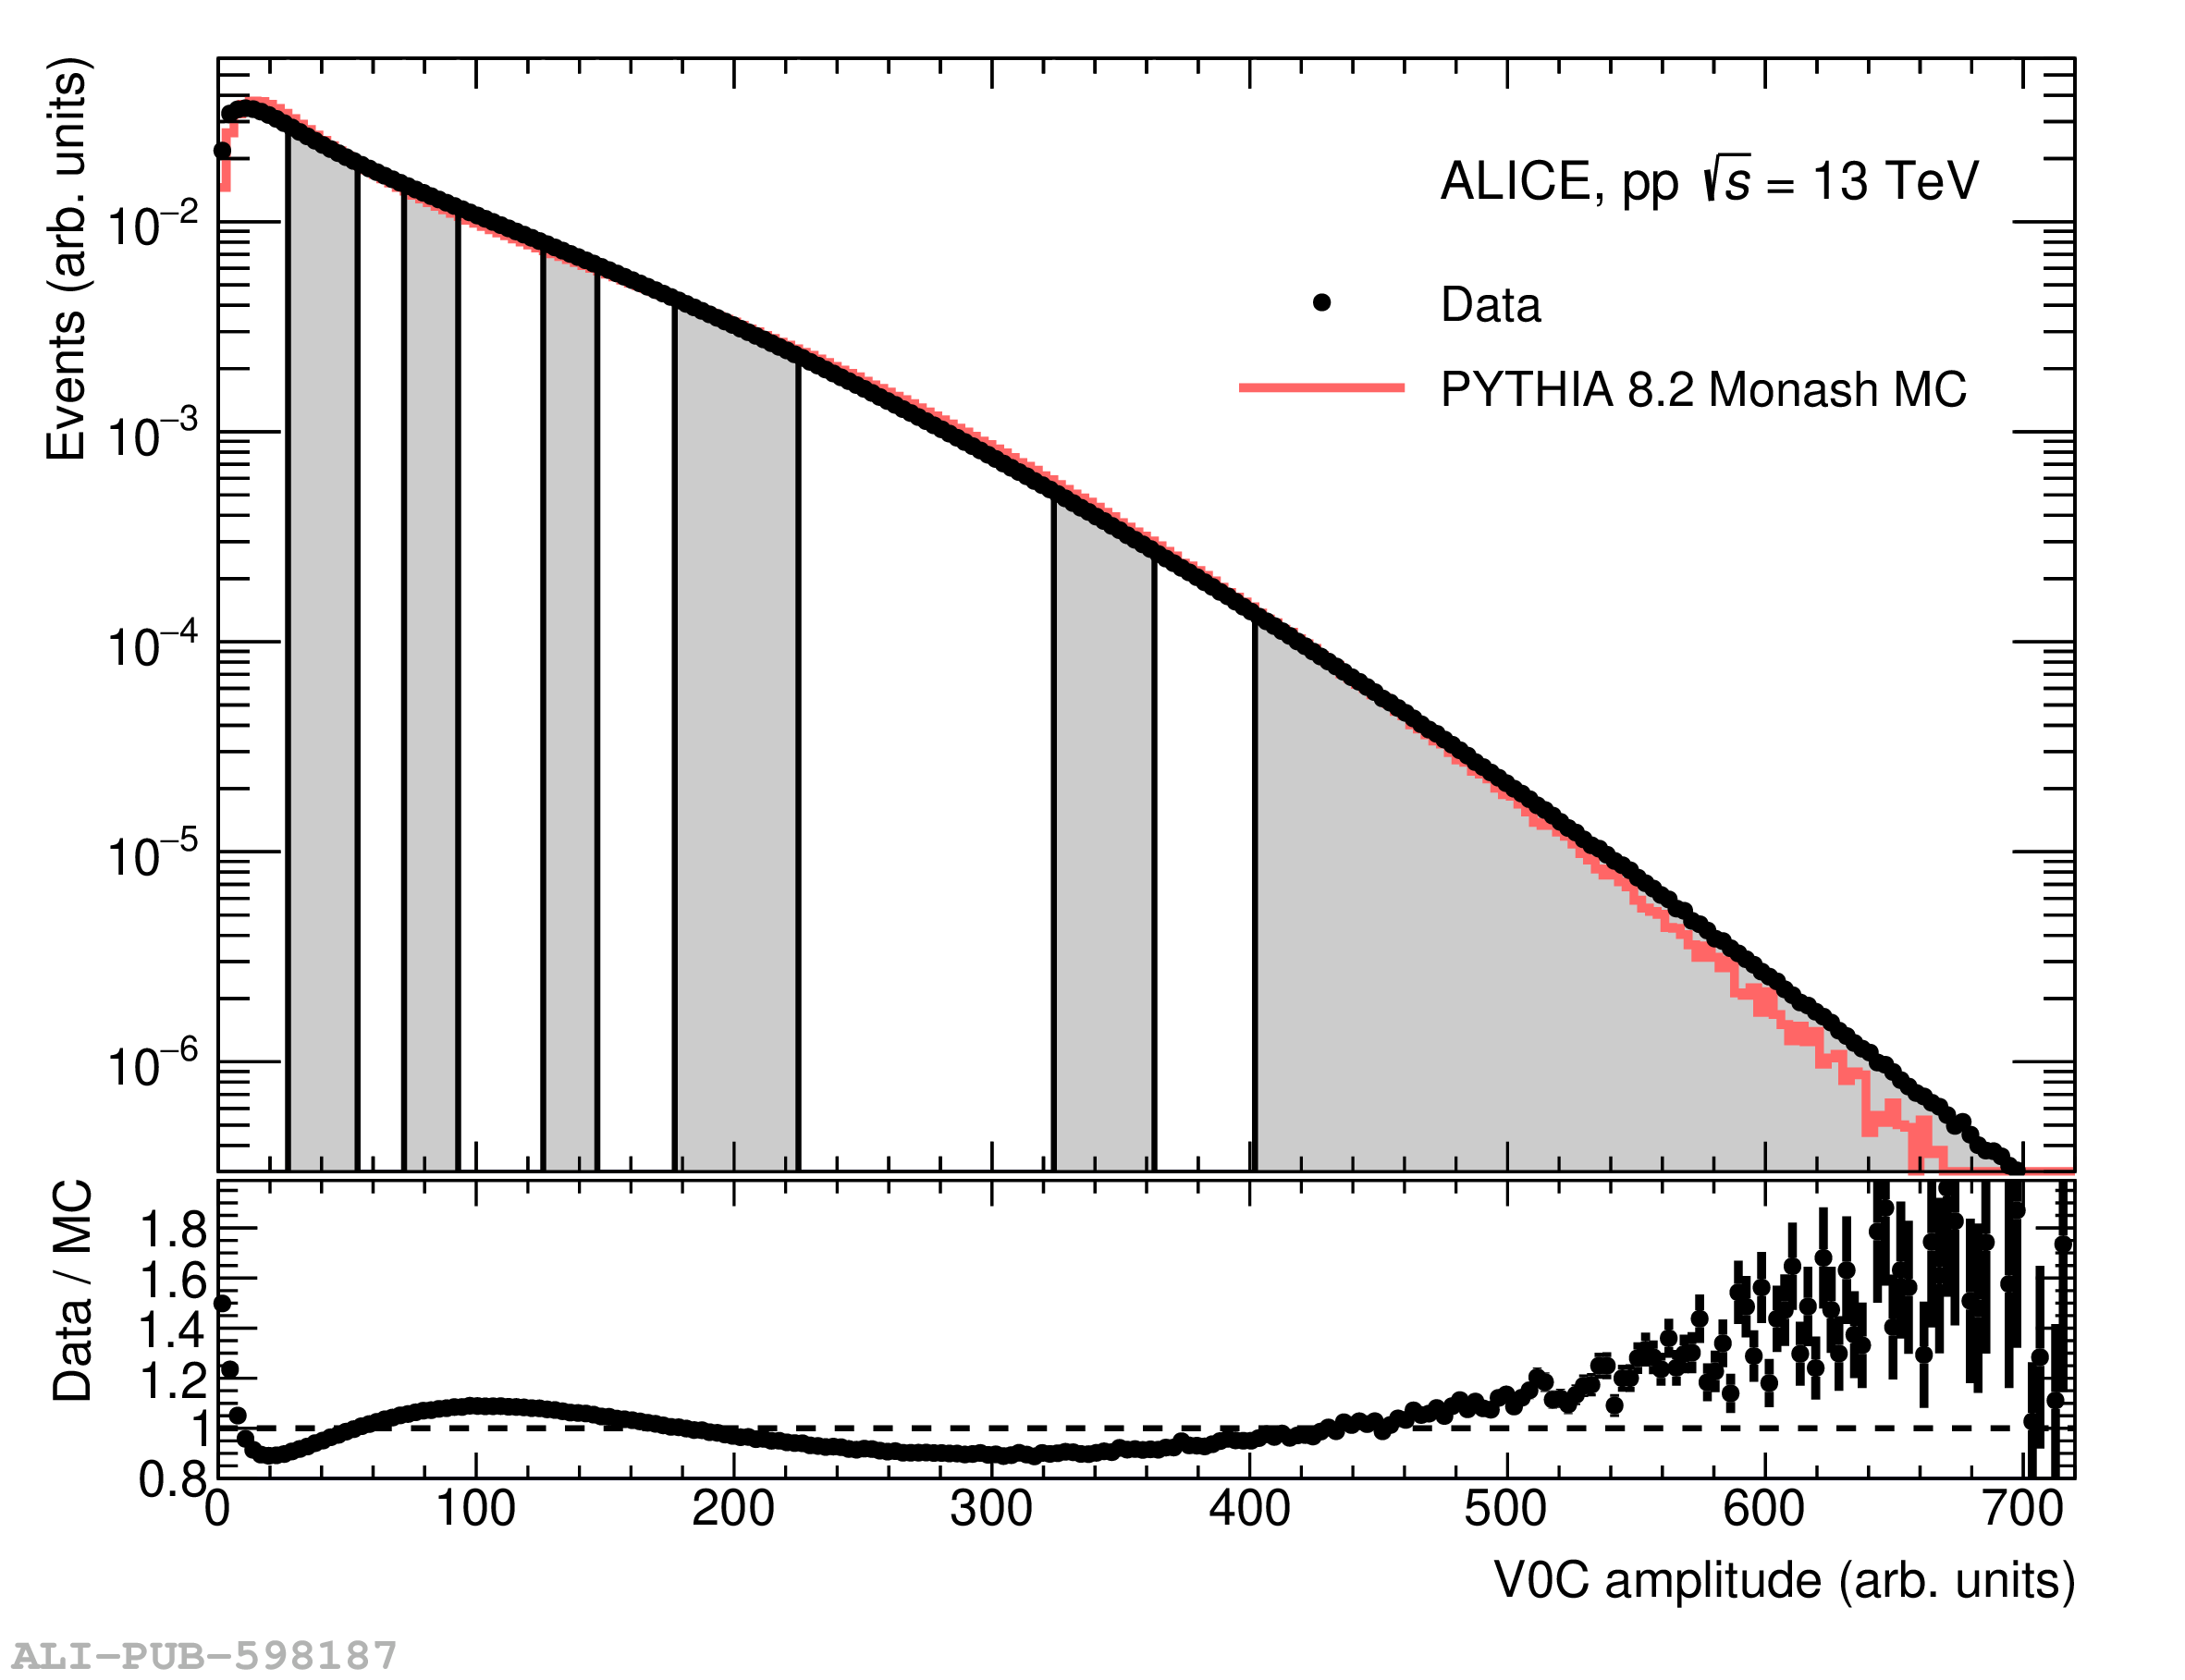 |