(a) Cluster shower shape distribution $\sigma_{\rm long}^{2}$ as a function of the cluster $p_{\rm T}$ in data. The dashed lines correspond to the upper and lower selection limit values for single photon candidate clusters used in the analysis. (b) Projected shower shape distribution in two $p_{\rm T}$ intervals in data (black circles) and simulation (red crosses, PYTHIA 8 $\rm jet-jet$ and $\gamma-{\rm jet}$ events). For the simulation, the $\sigma_{\rm long}^{2}$ distribution for clusters with different particle origins are also shown as shaded areas except for prompt photons from $\gamma-{\rm jet}$ PYTHIA 8 processes that are presented with a blue histogram line. | 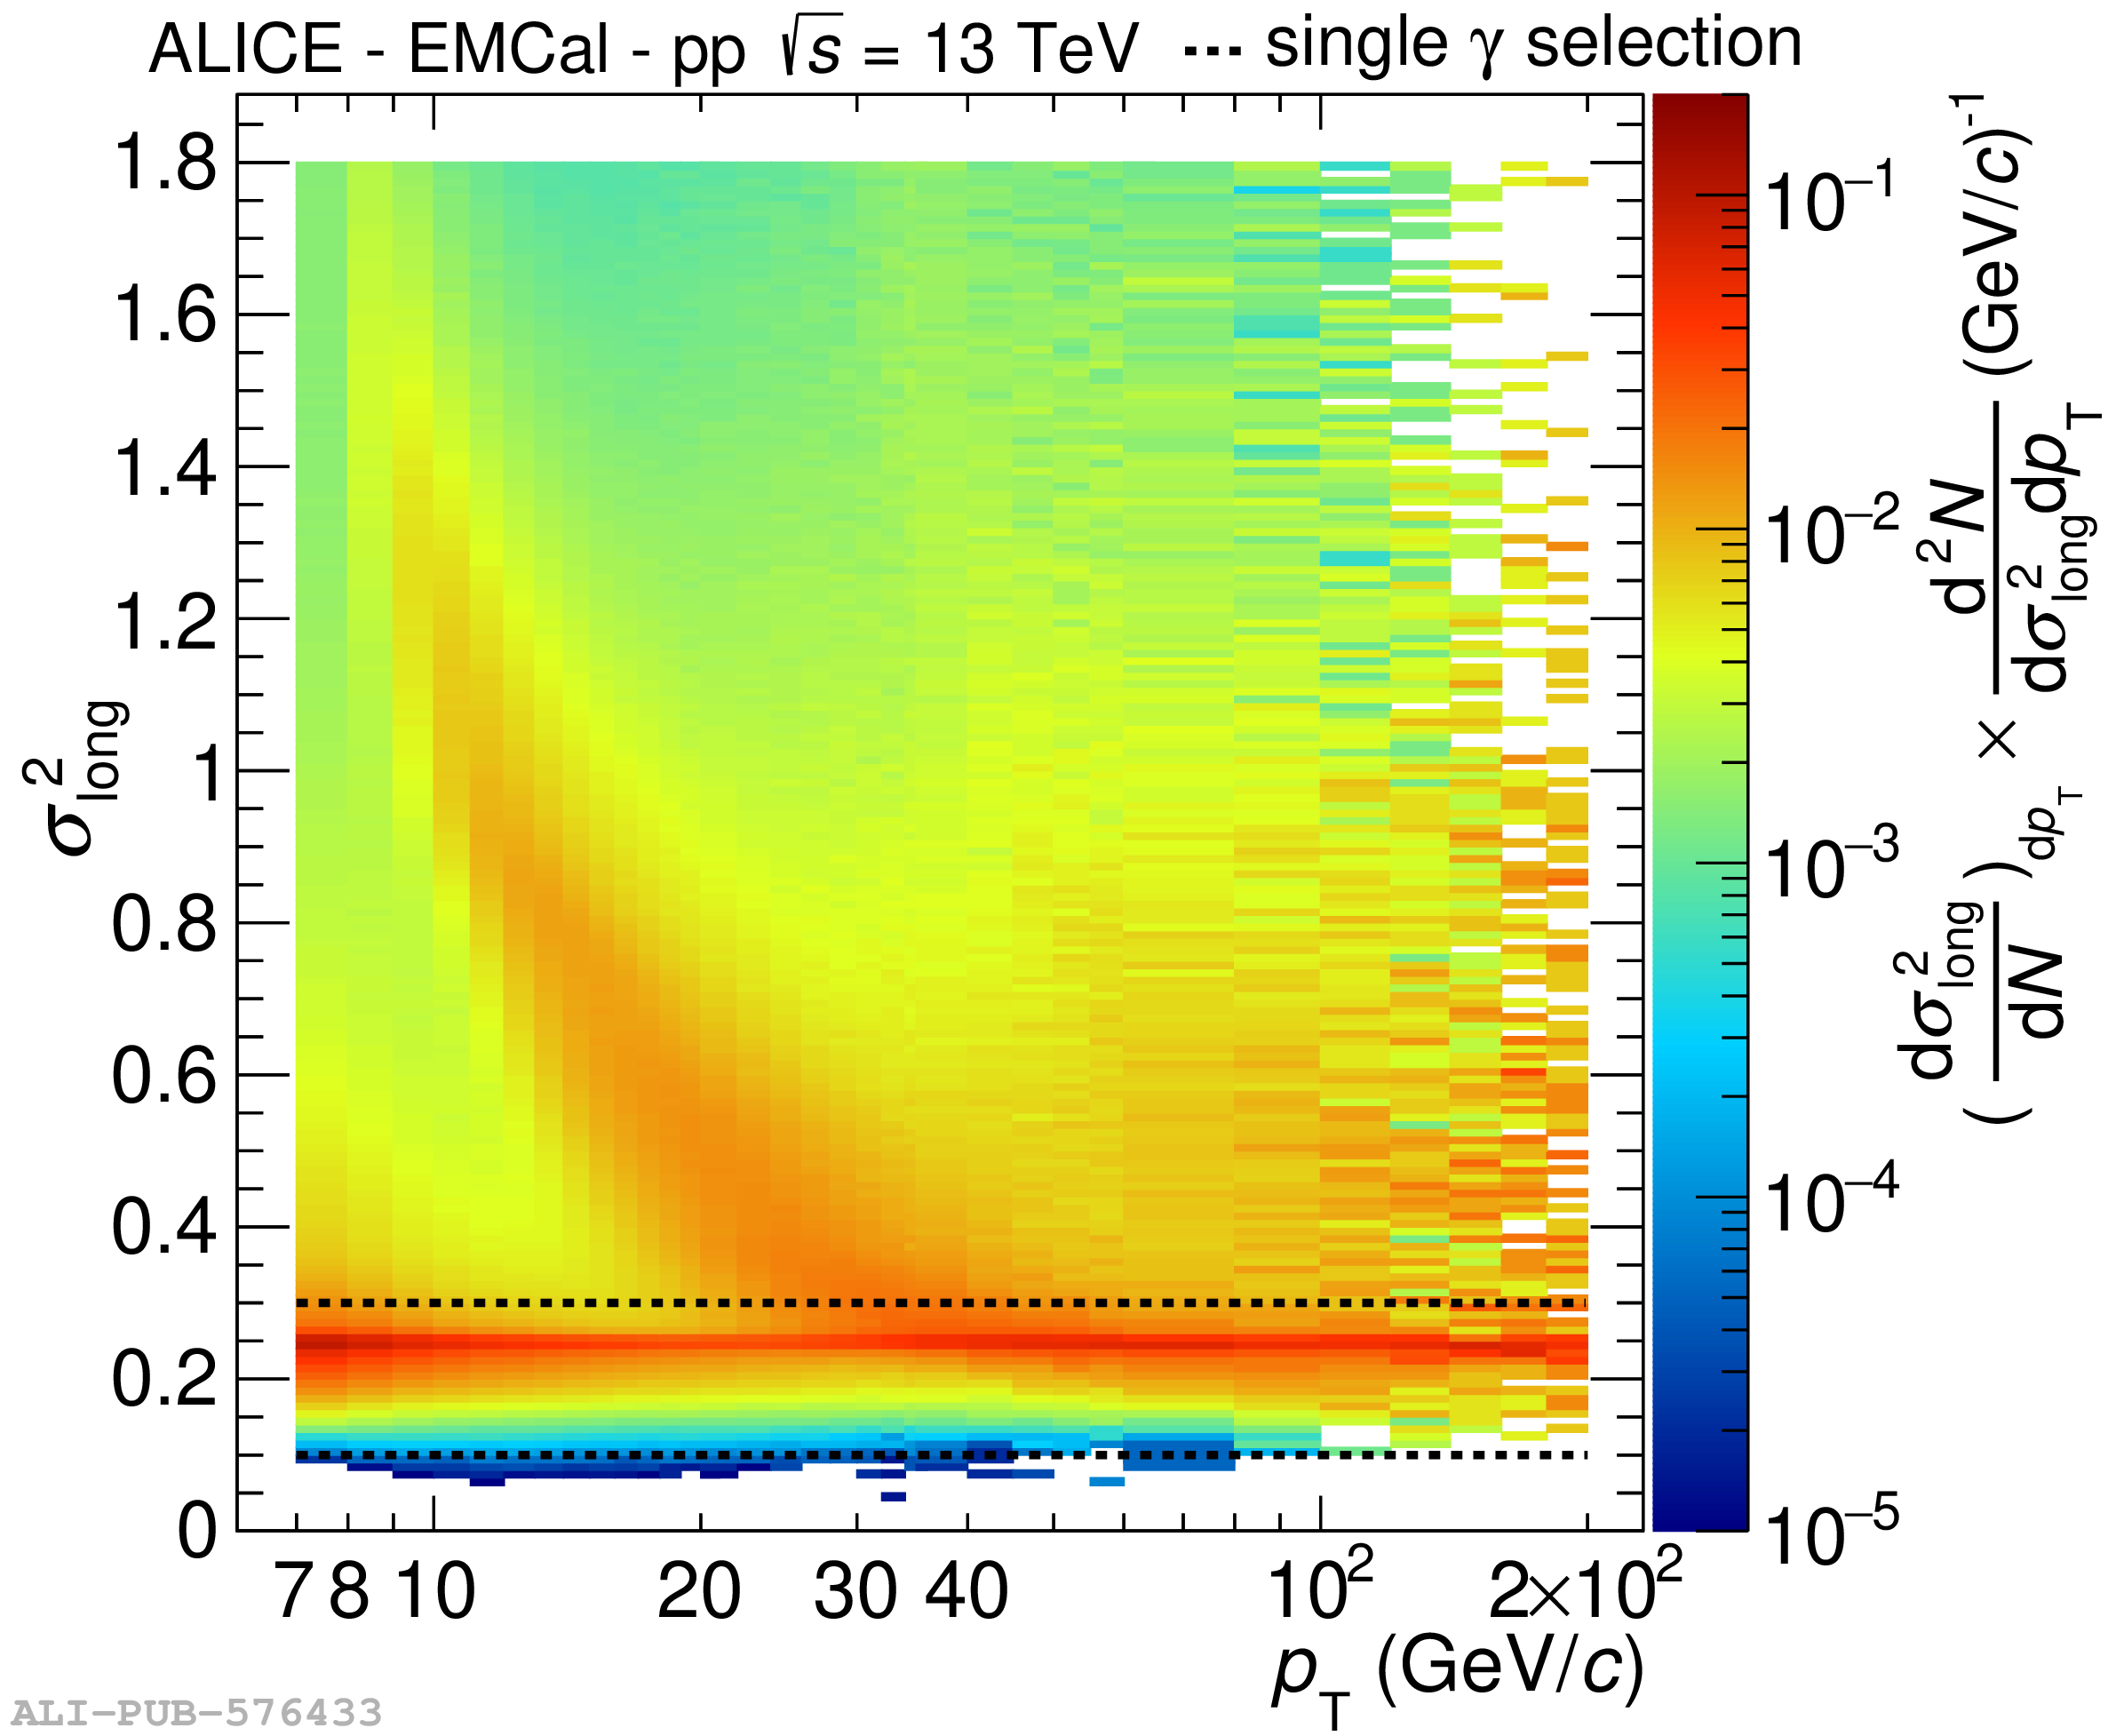 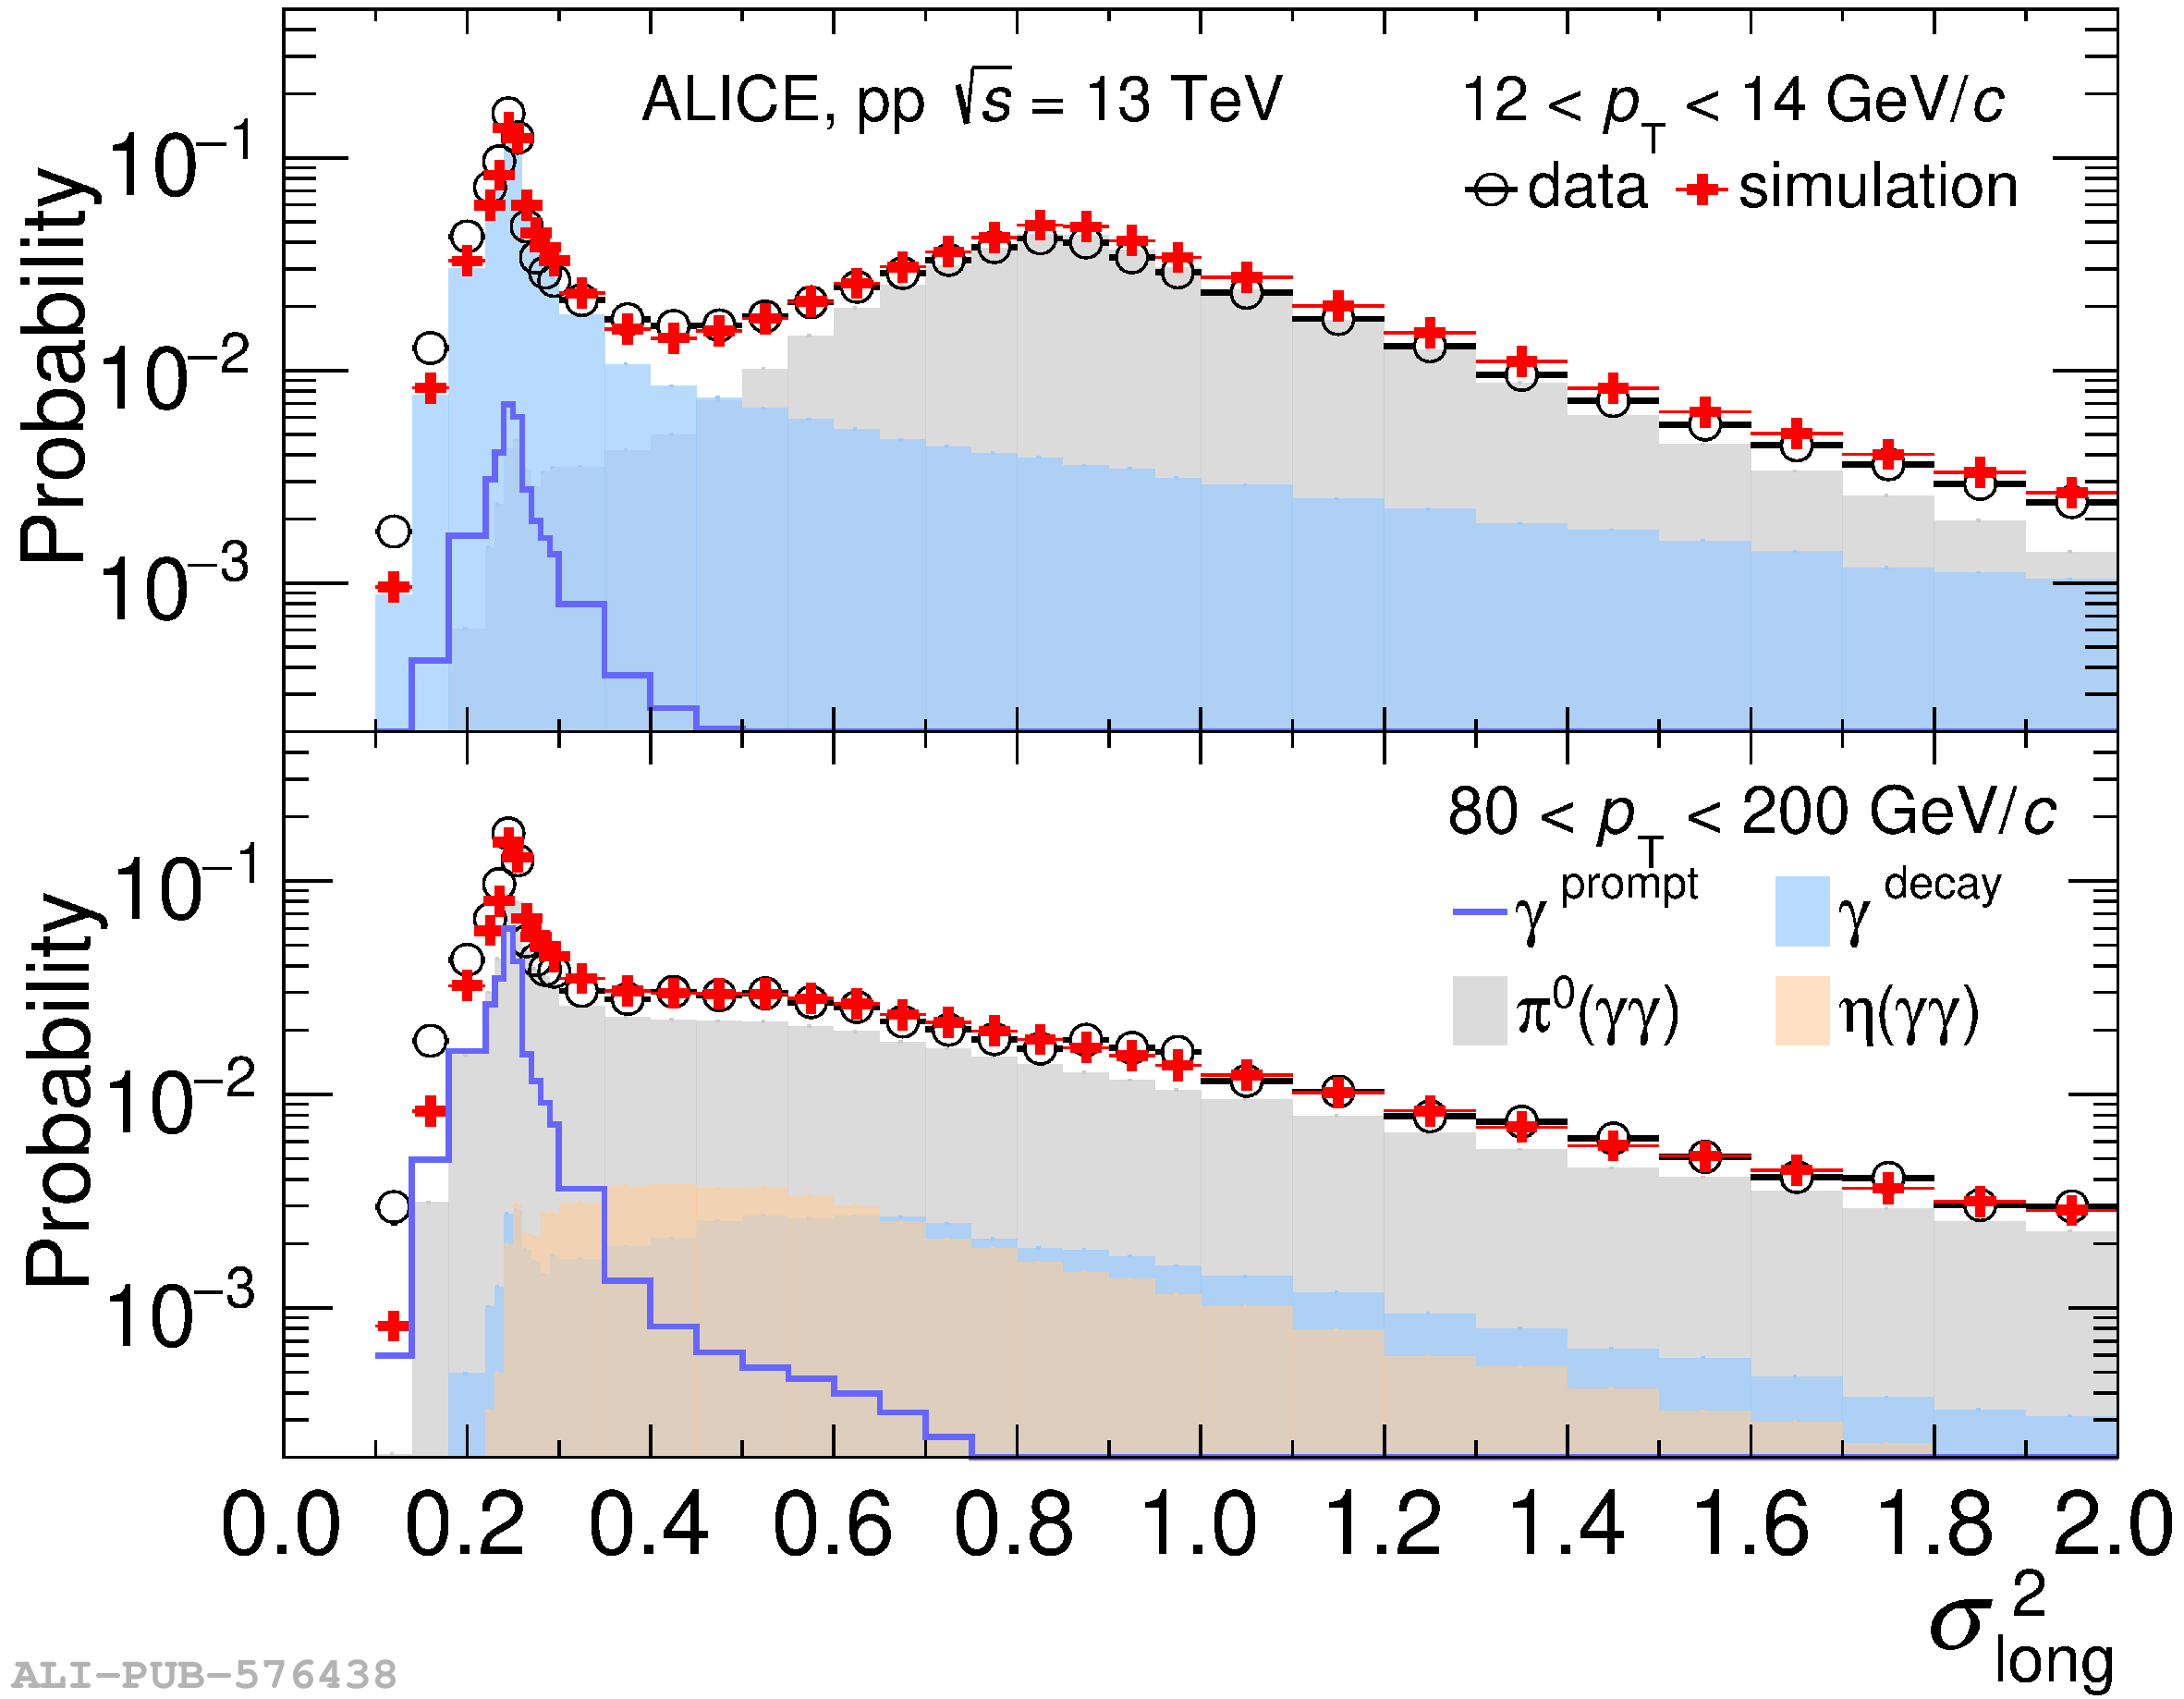 |