Distributions of the energy measured in ZPC (left) and ZPA (right) from the EMD events with at least one neutron at the same side (points) and resulting fit functions (solid curves) representing the sum of the individual Gaussians. The Gaussians representing the contributions of the individual 1p, 2p, 3p, 4p, and 5p peaks are shown by the dashed curves. | 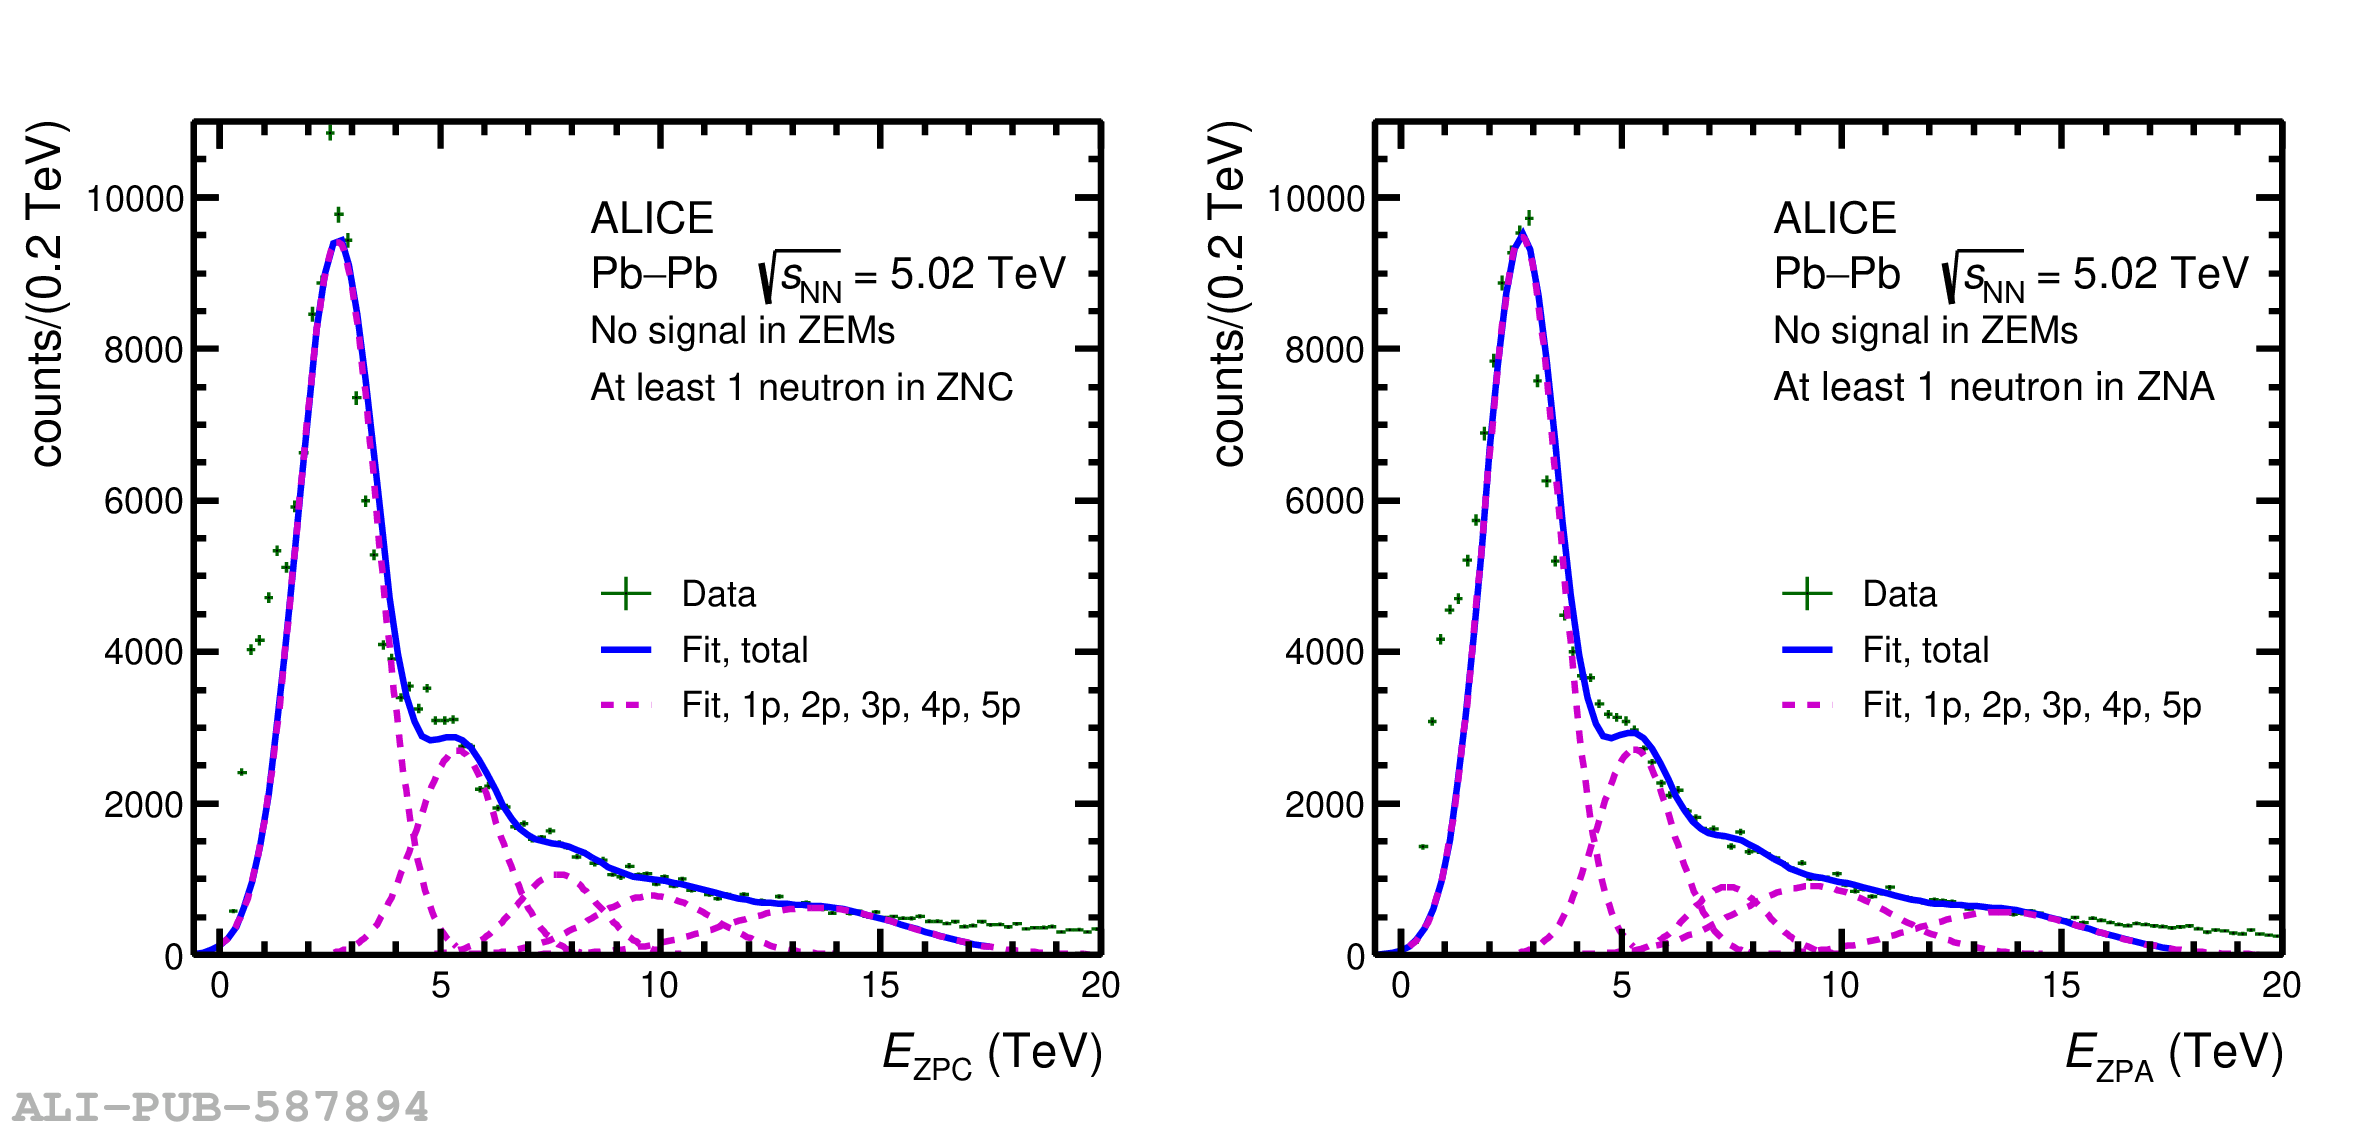 |