Proton emission in ultraperipheral Pb-Pb collisions at $\sqrt{\textit{s}_{\mathrm{\textbf{NN}}}}=5.02$ TeV

The first measurements of proton emission accompanied by neutron emission in the electromagnetic dissociation (EMD) of $^{208}$Pb nuclei in the ALICE experiment at the LHC are presented. The EMD protons and neutrons emitted at very forward rapidities are detected by the proton and neutron Zero Degree Calorimeters of the ALICE experiment. The emission cross sections of zero, one, two, and three protons accompanied by at least one neutron were measured in ultraperipheral $^{208}$Pb-$^{208}$Pb collisions at a center-of-mass energy per nucleon pair $\sqrt{s_{\rm NN}}=5.02$~TeV. These 0p, 1p, 2p, and 3p cross sections are described by the RELDIS model, and according to this model, they are associated with the production of various isotopes of Pb, Tl, Hg, and Au in the EMD of $^{208}$Pb. The cross sections of the emission of a single proton accompanied by the emission of one, two, or three neutrons in EMD were also measured. The data are significantly overestimated by the RELDIS model, which predicts that the (1p,1n), (1p,2n), and (1p,3n) cross sections are very similar to the cross sections for the production of the thallium isotopes $^{206,205,204}$Tl.


Submitted to: PRC
e-Print: arXiv:2411.07058 | PDF | inSPIRE
CERN-EP-2024-288
Figure group

Figure 1

Distributions of the energy measured in ZPC (left) and ZPA (right) from the EMD events with at least one neutron at the same side (points) and resulting fit functions (solid curves) representing the sum of the individual Gaussians. The Gaussians representing the contributions of the individual 1p, 2p, 3p, 4p, and 5p peaks are shown by the dashed curves.

Figure 2

Correlations between energies in the ZP and ZN for the EMD events with the emission of up to 7--8 neutrons: ZPC vs ZNC (left) and ZPA vs ZNA (right). The horizontal black lines mark the range $[\mu_1 - 2\sigma_1, \mu_1 + 2\sigma_1]$ of ZPC and ZPA energies which covers $\sim 95$\% of 1p events.

Figure 3

Distributions of the energy measured in ZNC (left) and ZNA (right) from the EMD events with a single proton detected, respectively, in ZPC and ZPA (points), and resulting fit functions (solid curves) representing the sum of all the Gaussians. The ZP energies associated with the detection of a single proton are determined as $[\mu_1 - 2\sigma_1, \mu_1 + 2\sigma_1]$. The Gaussians representing the contributions of individual 1n, 2n, 3n, 4n, and 5n peaks are shown by the dashed curves.

Figure 4

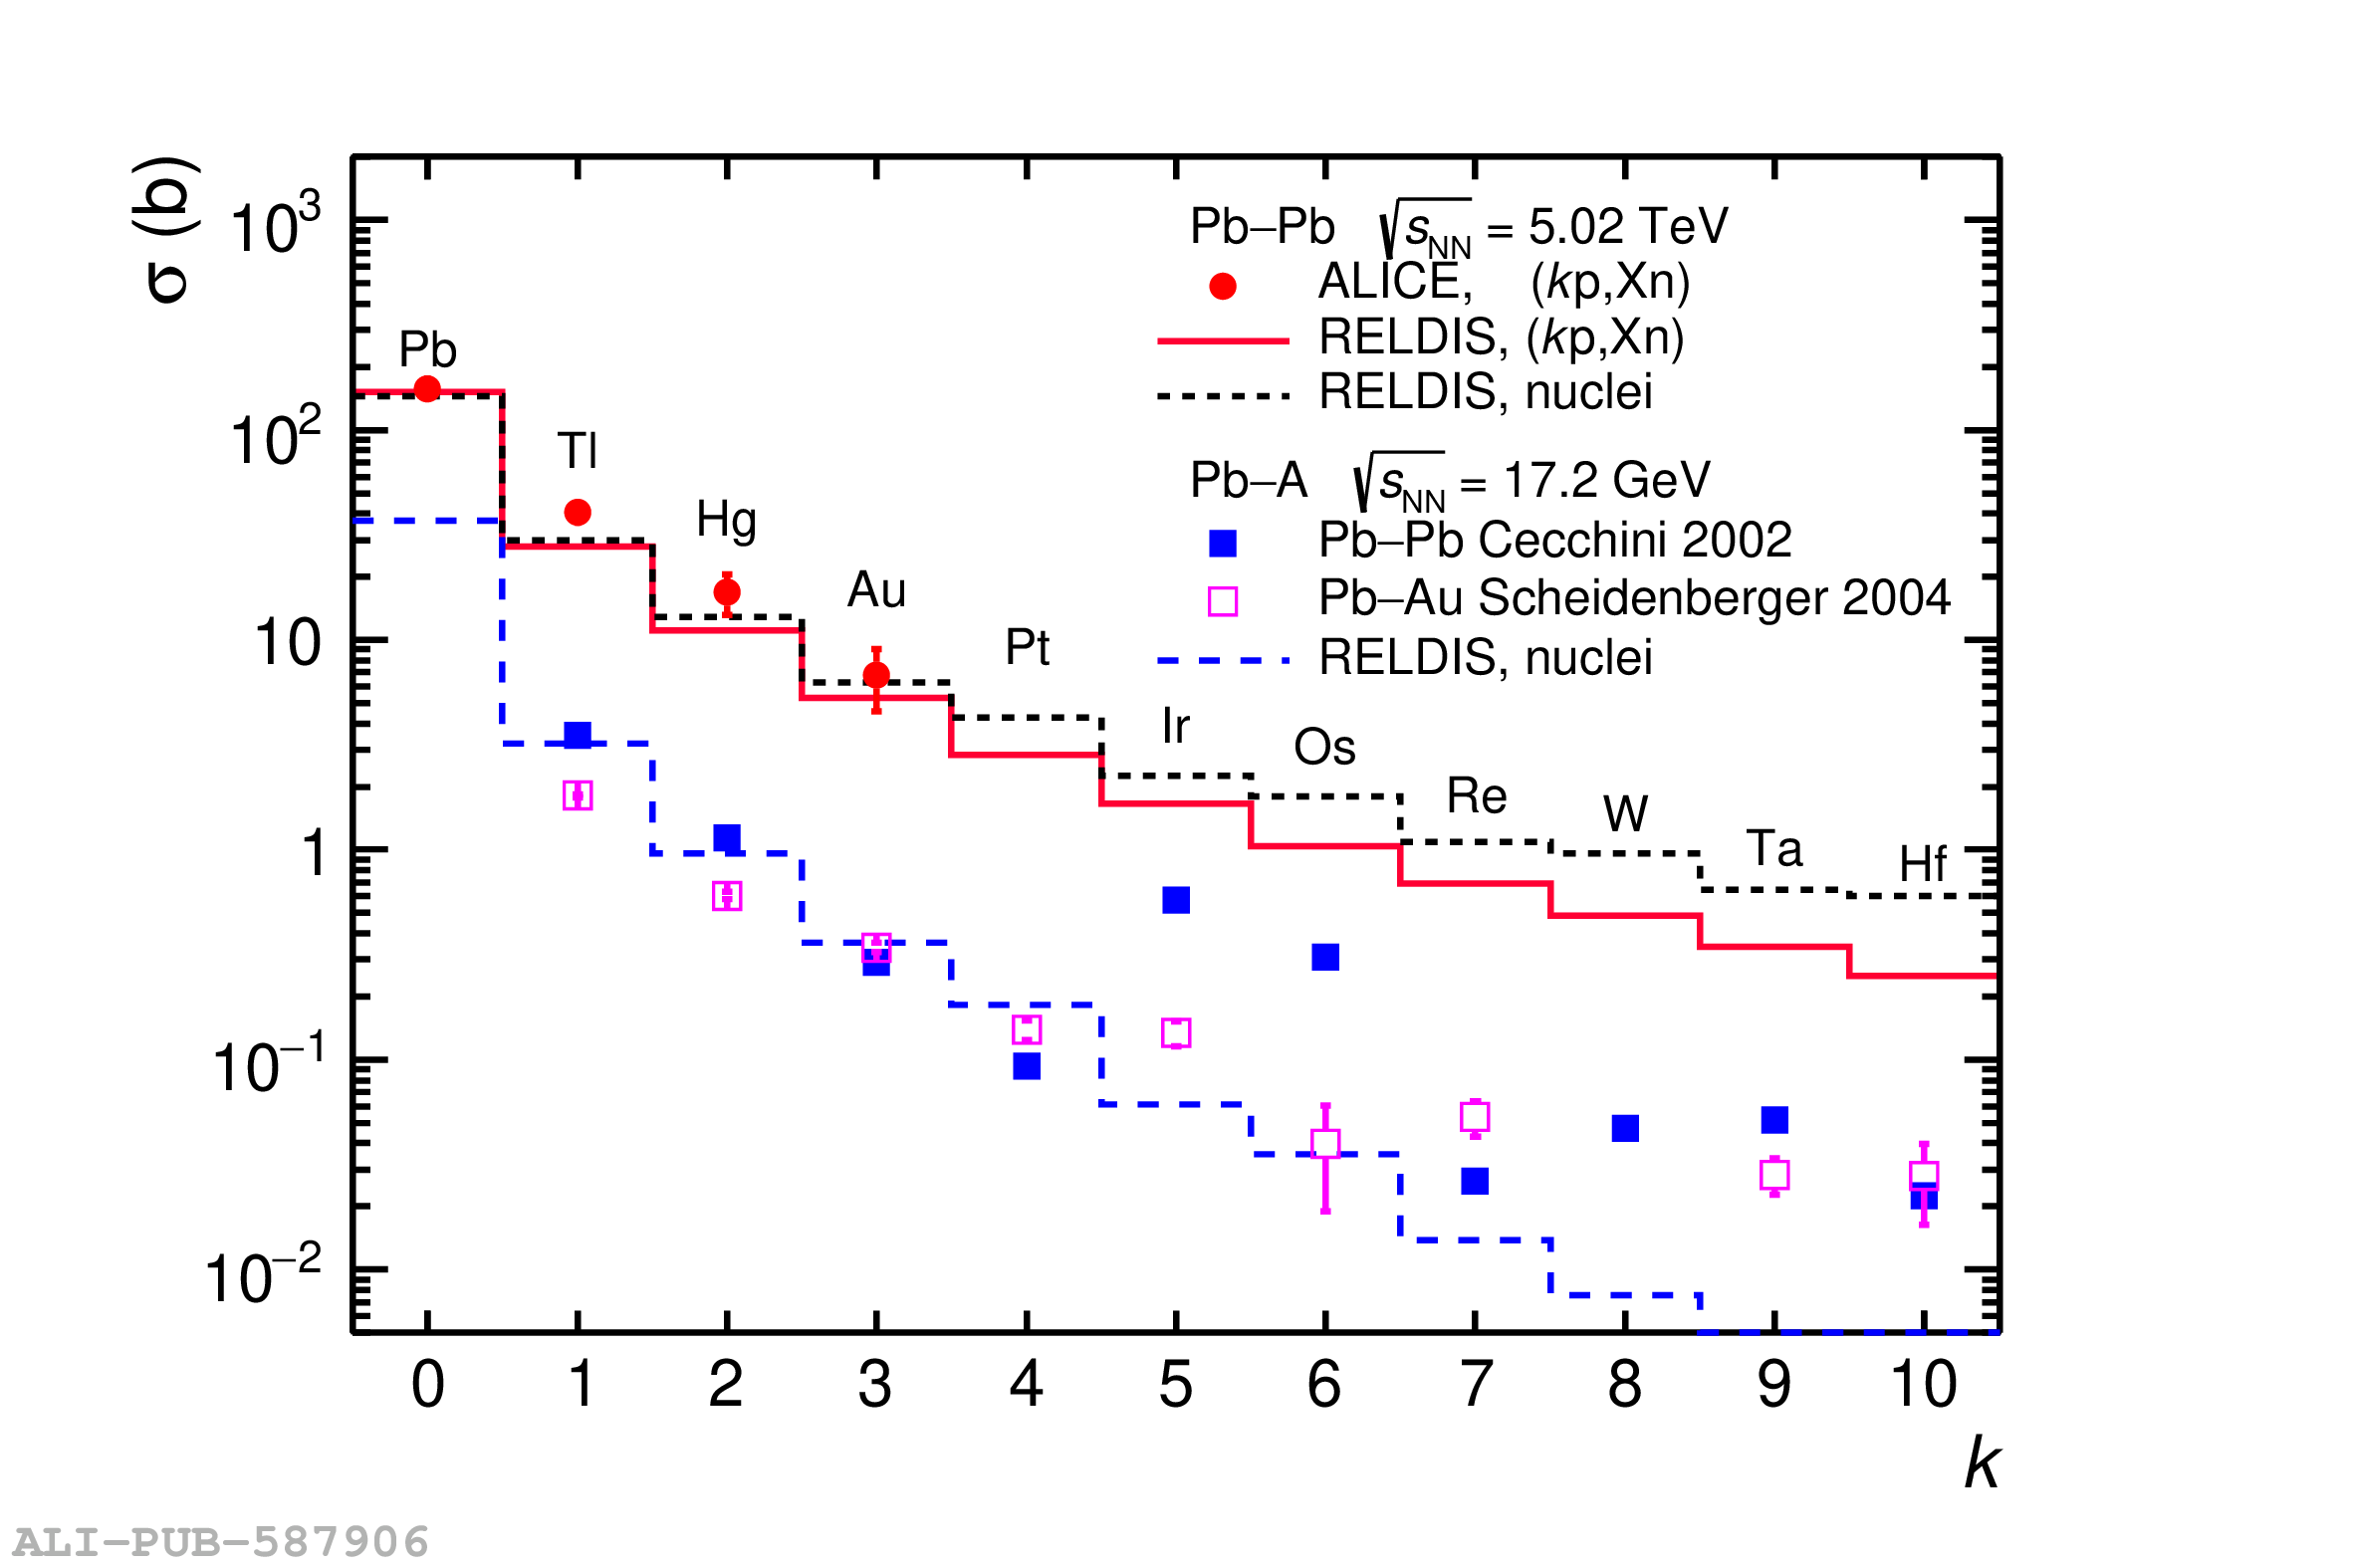
Measured (circles) and calculated with RELDIS  (red solid-line histogram) cross sections of the emission of a given number of protons $k$ accompanied by at least one neutron in UPCs of $^{208}$Pb nuclei at $\sqrt{s_{\mathrm{NN}}}=5.02$ TeV. Calculated cross sections of the production of specific elements, Pb, Tl, Hg, ..., Hf, at this collision energy are represented by the black dashed-line histograms marked with nuclide symbols. Charge-changing cross sections of the production of specific elements measured in collisions of $^{208}$Pb with Au and Pb at $\sqrt{s_{\mathrm{NN}}}=17.21$ GeV   with subtracted hadronic contribution (see text for details) are presented by the solid and open squares and compared with RELDIS results (blue long-dash histogram). The error bars represent combined statistical and systematic uncertainties of the measurements.

Figure 5

Measured (circles) and calculated with RELDIS (solid-line histogram) cross sections of the emission of a given number of neutrons $i$ accompanied by a single proton in UPCs of $^{208}$Pb nuclei at $\sqrt{s_{\mathrm{NN}}}=5.02$ TeV. Error bars represent combined statistical and systematic uncertainties of the measurements. Dotted-line and dashed-dotted-line histograms present the same cross sections, but calculated with RELDIS for EMD induced by photons with energies in the domain of the quasideuteron absorption and hadron photoproduction on individual nucleons, respectively. Calculated cross sections of the production of specific thallium nuclei, $^{207,206,...,200}$Tl, are presented by the dashed-line histogram marked with the respective nuclide symbols.