Projections onto the $\Deta$ (left) and $\Dphi$ (right) axes of the $\RtwoCD$ (top) and $\PtwoCD$ (bottom) correlation functions shown in Fig. ???. The $\Deta$ and $\Dphi$ projections are calculated as averages of the two-dimensional correlations in the range $|\Dphi| \leq \pi$ and $|\Deta| \leq 1.6$, respectively. Vertical bars andboxes represent statistical and systematic uncertainties,respectively. Simulations using PYTHIA8 with the Monash 2013 tune and color reconnection (CR) enabled, as described in the text, are shown as green dashed lines. | 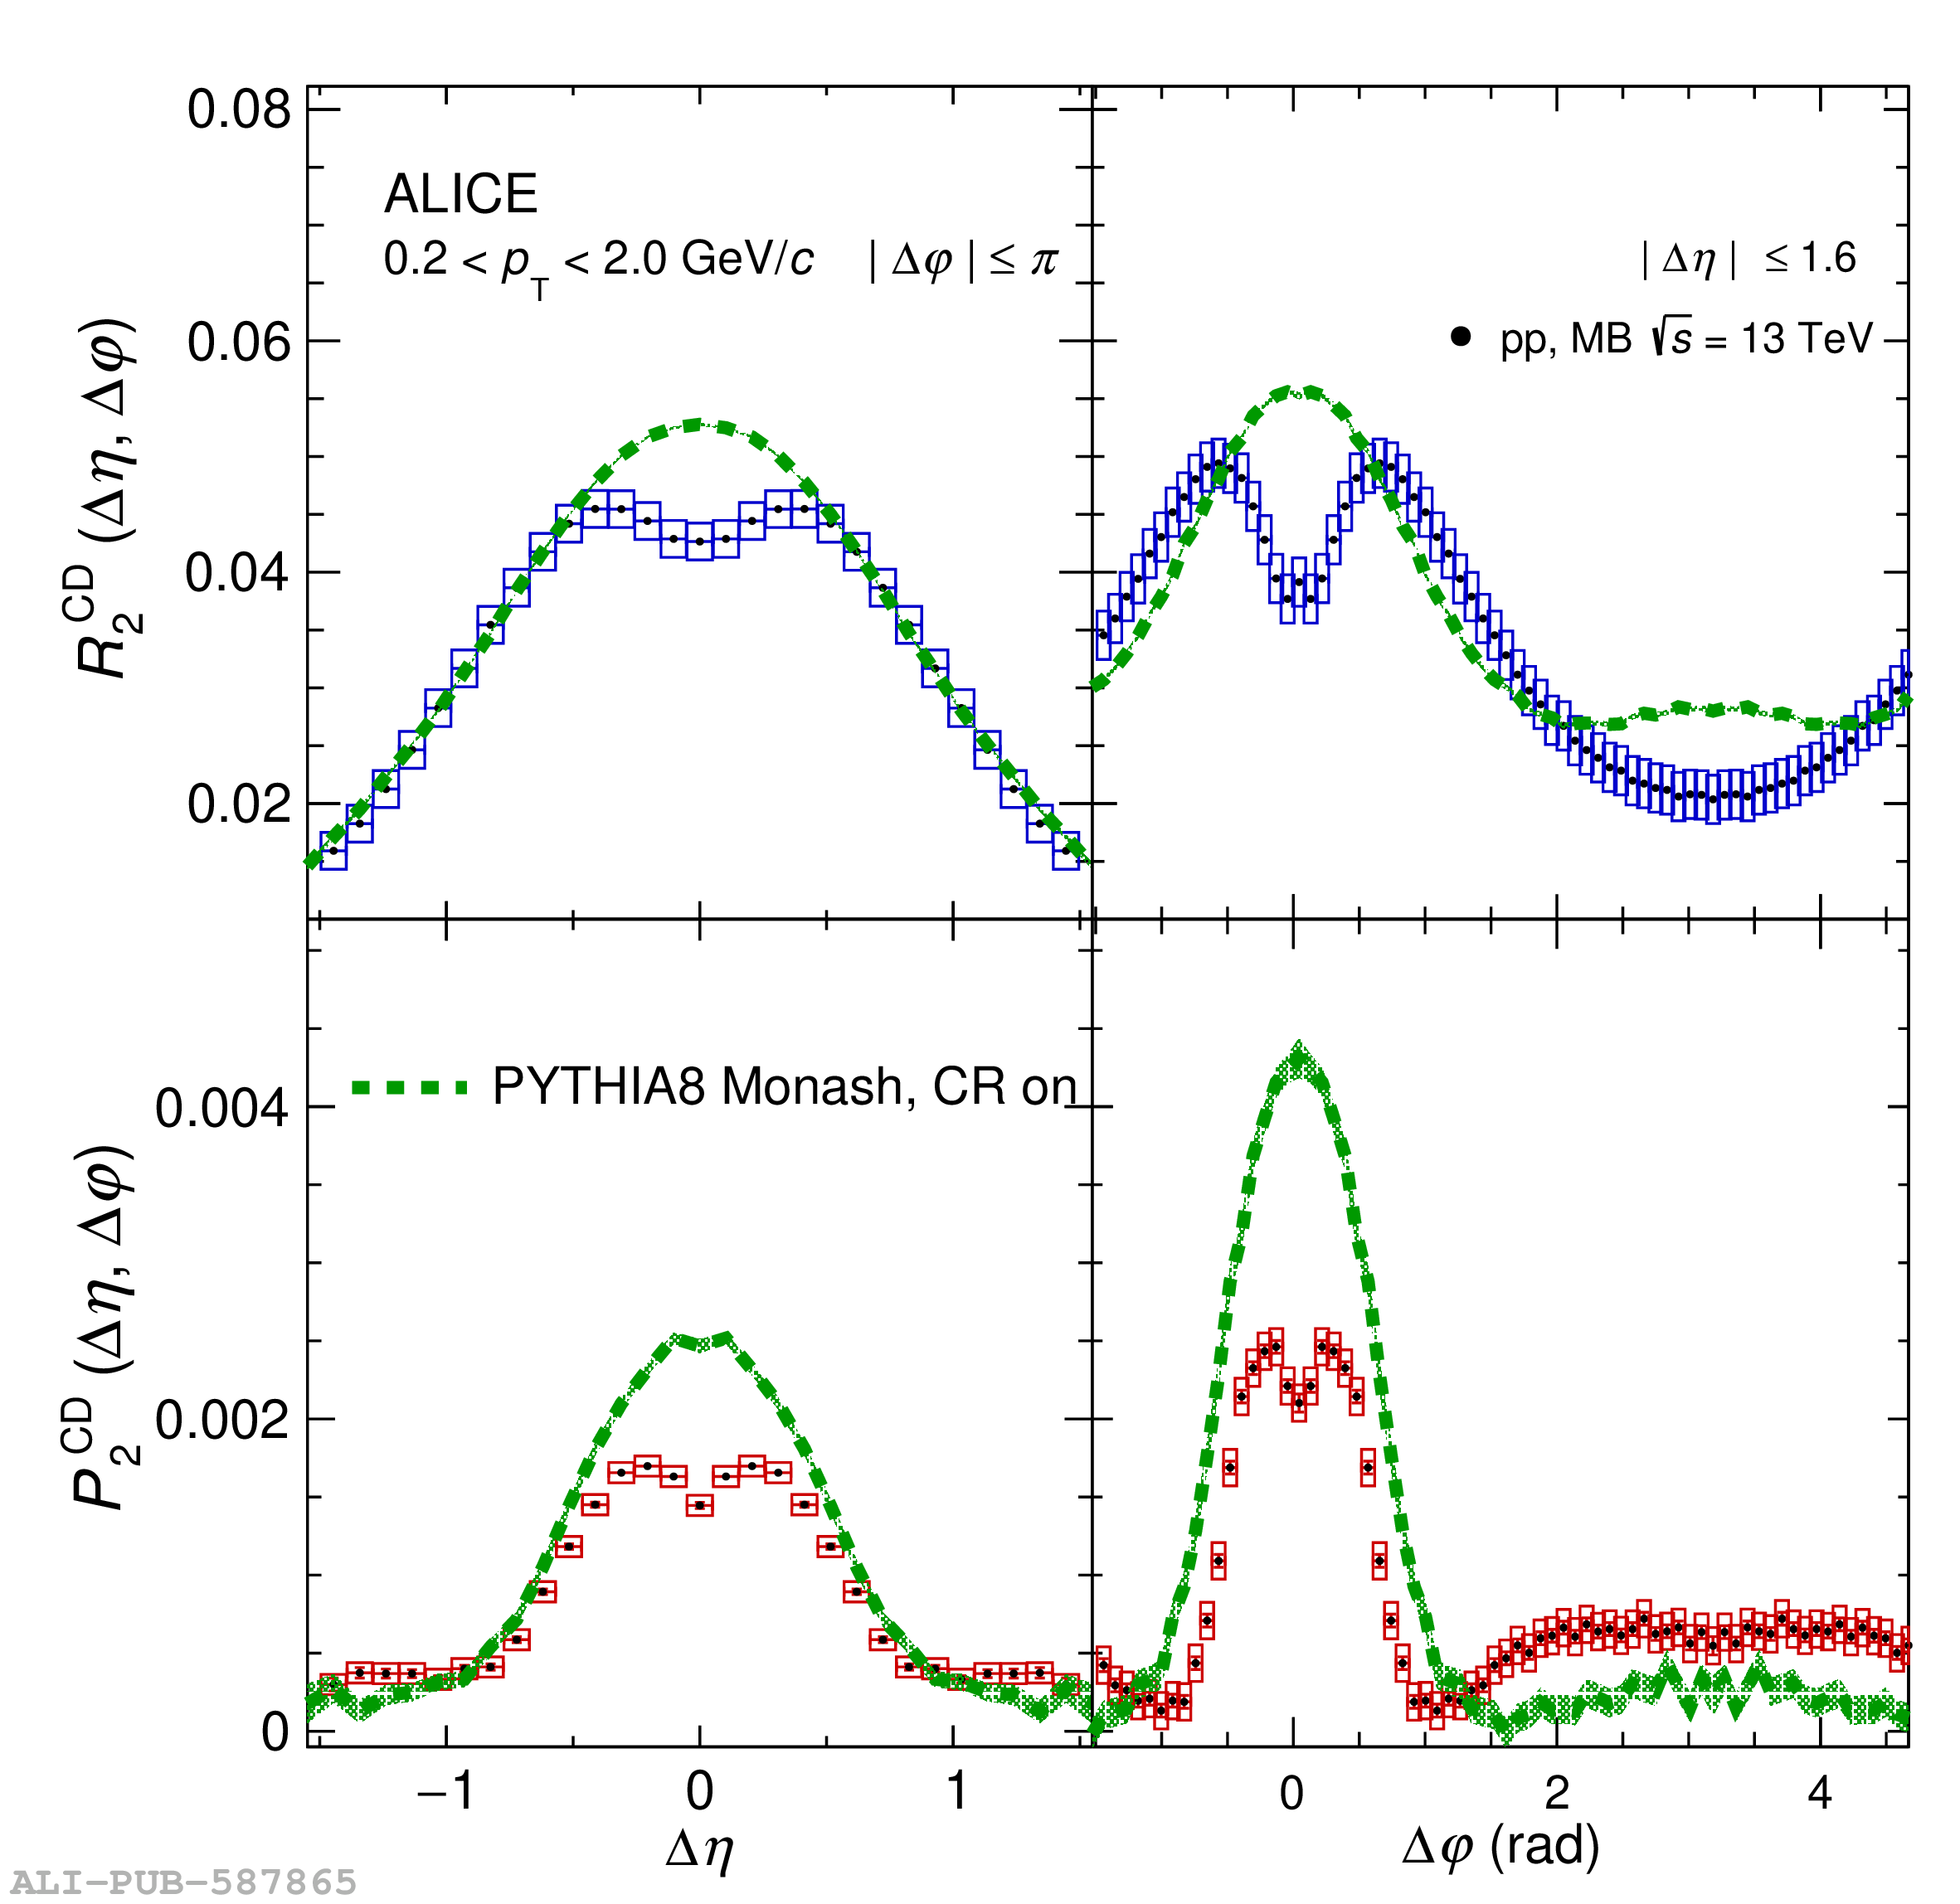 |