Measurements of differential two-particle number and transverse momentum correlation functions in pp collisions at $\sqrt{\textit{s}}$ = 13 TeV

Differential two-particle normalized cumulants ($R_2$) and transverse momentum correlations ($P_2$) are measured as a function of the relative pseudorapidity and azimuthal angle difference $( \Delta \eta, \Delta \varphi )$ of charged particle pairs in minimum bias pp collisions at $\sqrt{\textit{s}}$ = 13 TeV. The measurements use charged hadrons in the pseudorapidity region of $|\eta| <~ 0.8$ and the transverse momentum range 0.2 $<~ \textit{p}_{\mathrm T} <~ $ 2.0 $\mathrm{GeV}/\textit{c}$ in order to focus on soft multiparticle interactions and to complement prior measurements of these correlation functions in p-Pb and Pb-Pb collisions. The correlation functions are reported for both unlike-sign and like-sign pairs and their charge-independent and charge-dependent combinations. Both the $R_2$ and $P_2$ measured in pp collisions exhibit features qualitatively similar to those observed in p-Pb and Pb-Pb collisions. The $\Delta\eta$ and $\Delta\varphi$ root mean square widths of the near-side peak of the correlation functions are evaluated and compared with those observed in p-Pb and Pb-Pb collisions and show smooth evolution with the multiplicity of charged particles produced in the collision. The comparison of the measured correlation functions with predictions from PYTHIA8 shows that this model qualitatively captures their basic structure and characteristics but feature important differences. In addition, the $R_2^{\rm CD}$ is used to determine the charge balance function of hadrons produced within the detector acceptance of the measurements. The integral of the balance function is found to be compatible with those reported by a previous measurement in Pb-Pb collisions. These results, which are sensitive to the interplay between the underlying event and mini-jets in pp collisions, establish a baseline for heavy-ion collisions.


Submitted to: EPJC
e-Print: arXiv:2411.07059 | PDF | inSPIRE
CERN-EP-2024-271
Figure group

Figure 2

Correlation functions $\RtwoCI$ (left) and $\PtwoCI$ (right) of charged hadrons measured in minimum bias pp collisions at $\s$ = 13 TeV. Charged hadrons are selected in the range $0.2 \pt 2.0$ GeV/$c$ and with pseudorapidity $|\eta| 0.8$.

Figure 3

Projections onto $\Deta$ (left column) and $\Dphi$ (right column) of $\RtwoCI$ (top row) and $\PtwoCI$ (bottom row) correlation functions of charged hadrons calculated in the selected $\pt $ range in pp collisions at \mbox{$\s$ = 13 TeV}. The $\Deta$ and $\Dphi$ projections are calculated as averages of the two-dimensional correlations in the range $|\Dphi| \leq \pi$ and $|\Deta| \leq 1.6$, respectively. Vertical bars andboxes represent statistical and systematic uncertainties,respectively. Simulations using PYTHIA8 with the Monash 2013 tune and color reconnection (CR) enabled, as described in the text, are shown as green dashed lines.

Figure 4

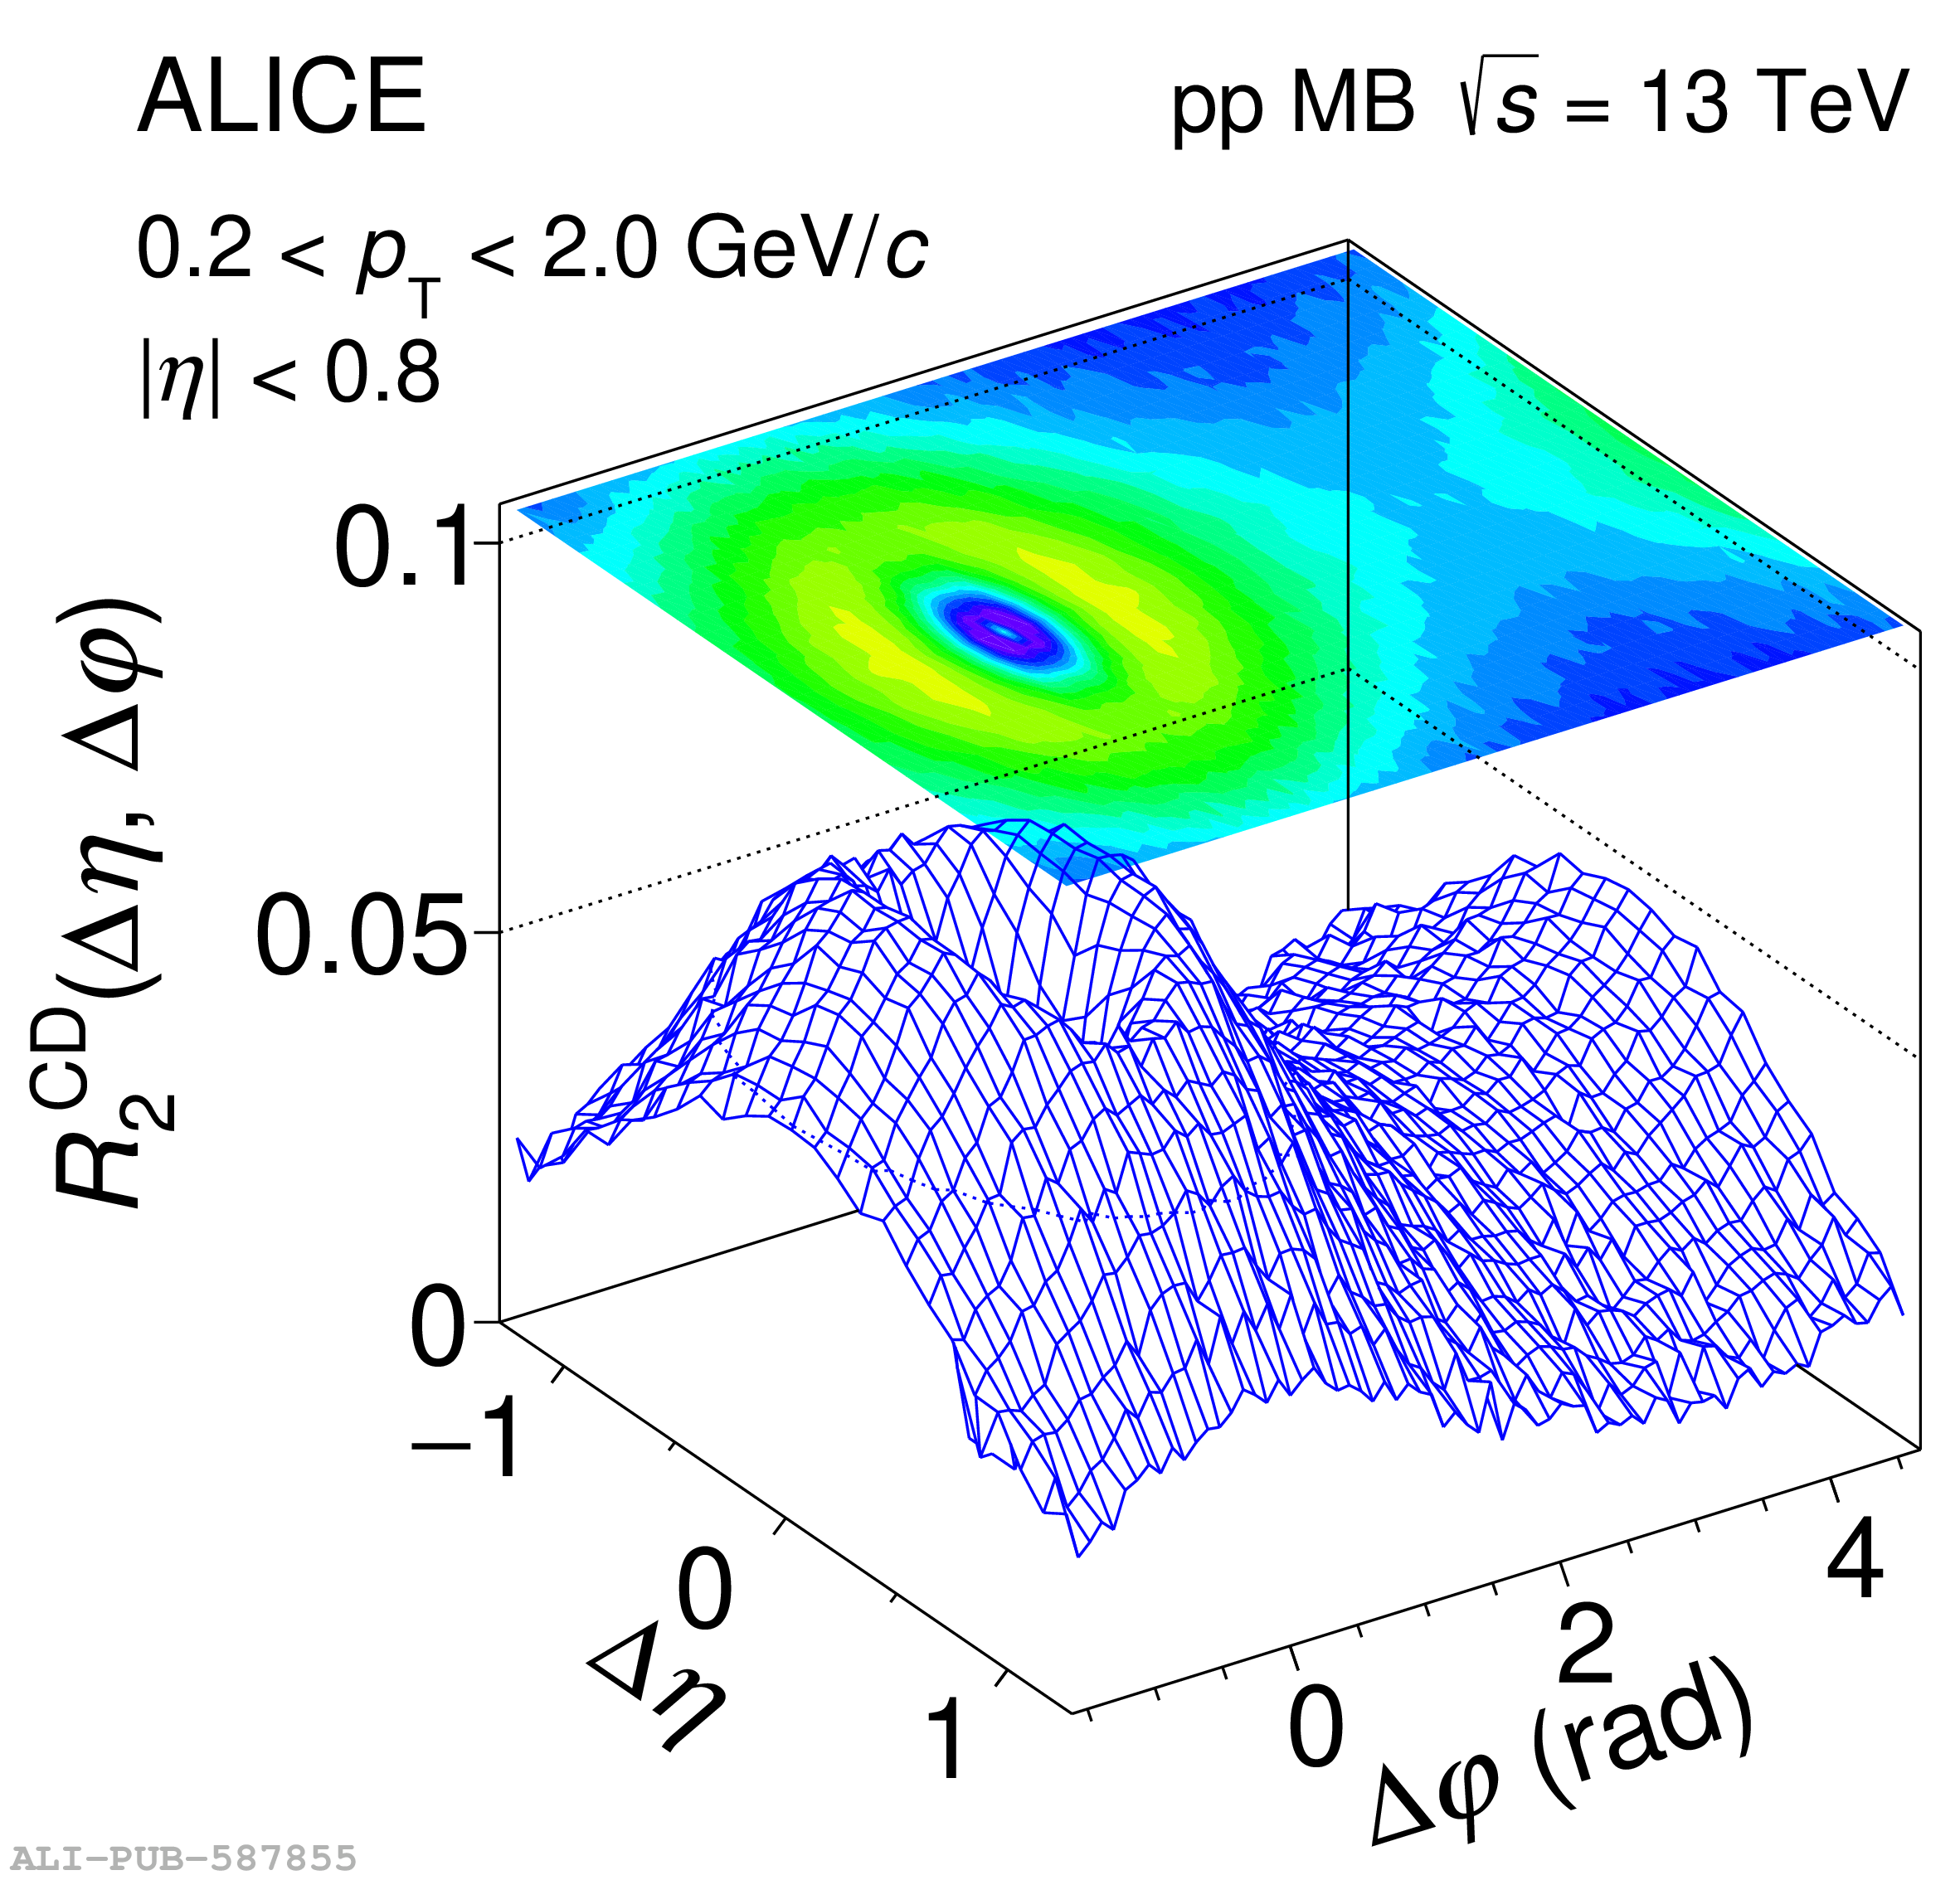
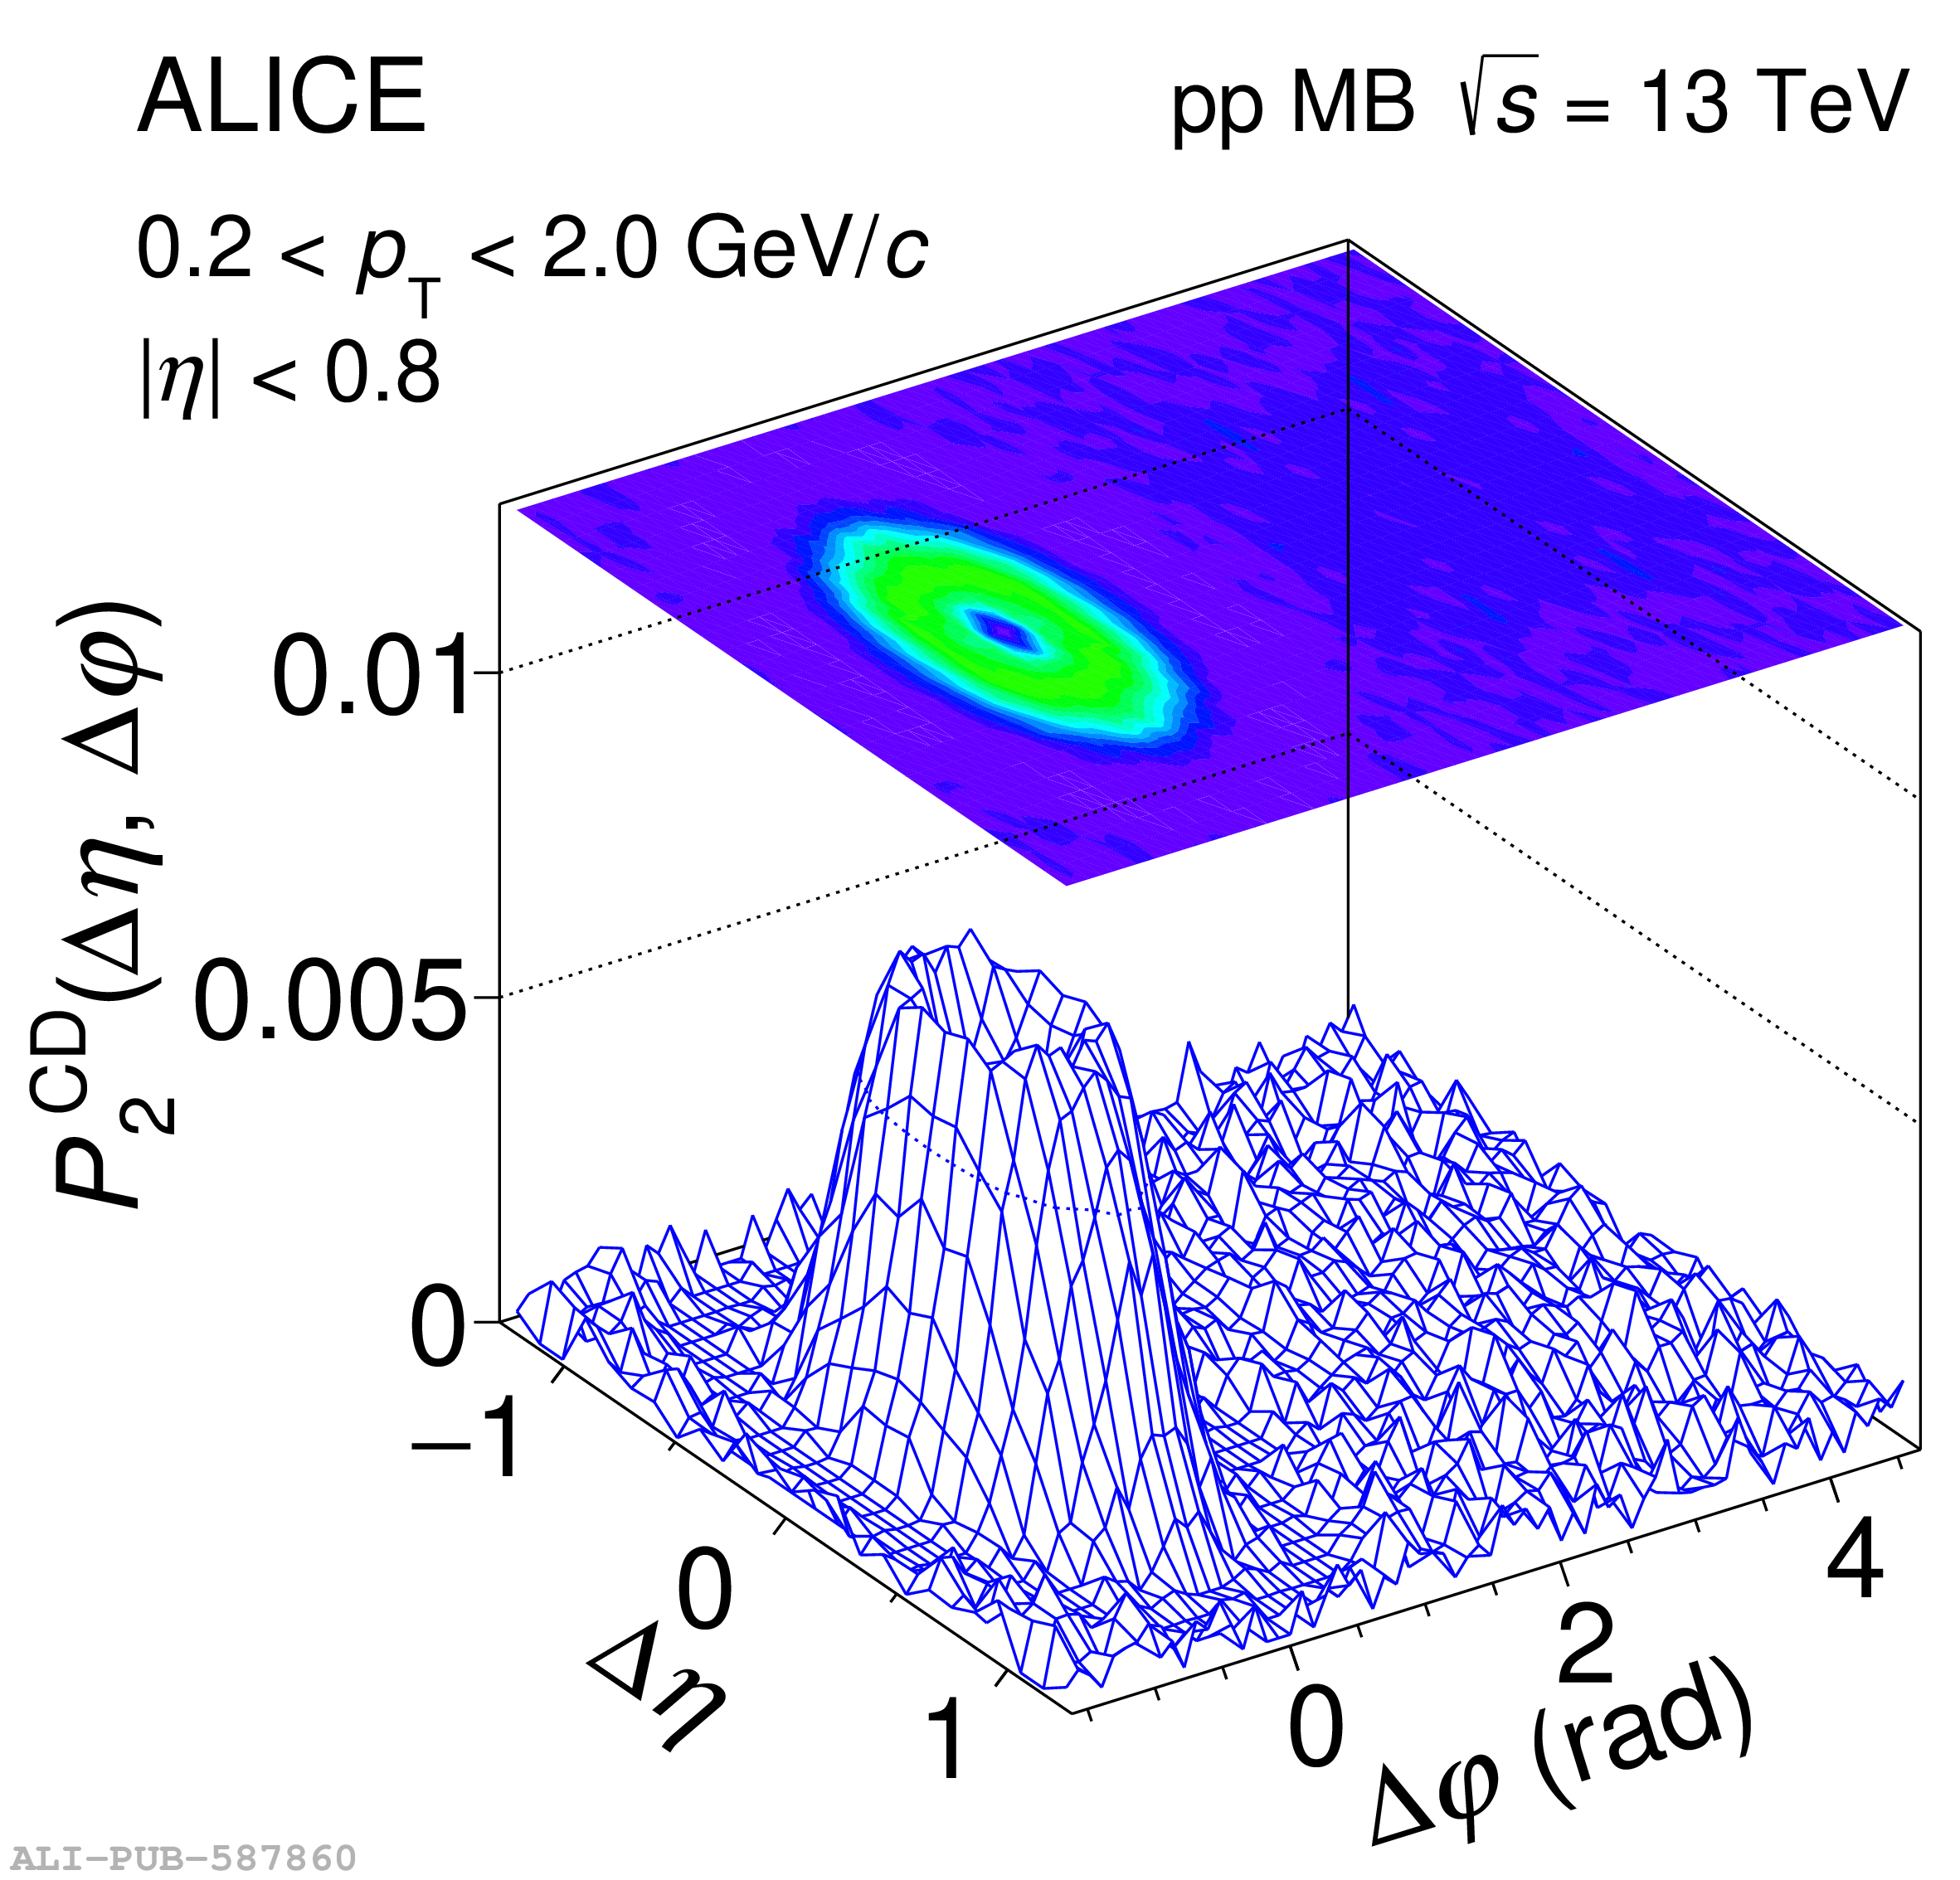
Correlation functions $\RtwoCD$ (left ) and $\PtwoCD$ (right) of charged hadrons in minimum bias pp collisions at $\s$ = 13 TeV. Charged hadrons are selected in the range $0.2 \pt 2.0$ GeV/$c$ and with pseudorapidity $|\eta| 0.8$.

Figure 5

Projections onto the $\Deta$ (left) and $\Dphi$ (right) axes of the $\RtwoCD$ (top) and $\PtwoCD$ (bottom) correlation functions shown in Fig. \ref{fig:r2p2CdSys}. The $\Deta$ and $\Dphi$ projections are calculated as averages of the two-dimensional correlations in the range $|\Dphi| \leq \pi$ and $|\Deta| \leq 1.6$, respectively. Vertical bars andboxes represent statistical and systematic uncertainties,respectively. Simulations using PYTHIA8 with the Monash 2013 tune and color reconnection (CR) enabled, as described in the text, are shown as green dashed lines.

Figure 6

Width of (a) $\RtwoCI(\Deta)$ (blue markers) and $\PtwoCI(\Deta)$ (red markers) and (b) $\RtwoCD(\Deta)$ (blue markers) and $\PtwoCD(\Deta)$ (red markers) correlation functions along $\Deta$ measured within $|\Dphi| \pi$ in pp collisions and compared with results from p--Pb and Pb--Pb collisions  as a function of $\dnavg$. Vertical bars and boxes represent statistical and systematic uncertainties, respectively.

Figure 7

Widths of $\RtwoCD(\Dphi)$ (blue markers) and $\PtwoCD(\Dphi)$ (red markers) correlation functions along $\Dphi$measured within $|\Deta| 1.6$ for pp and within $|\Deta| 1.8$for p--Pb and Pb--Pb collisions  as a function of$\dnavg$. Vertical bars and boxes represent statistical and systematic uncertainties, respectively.

Figure 8

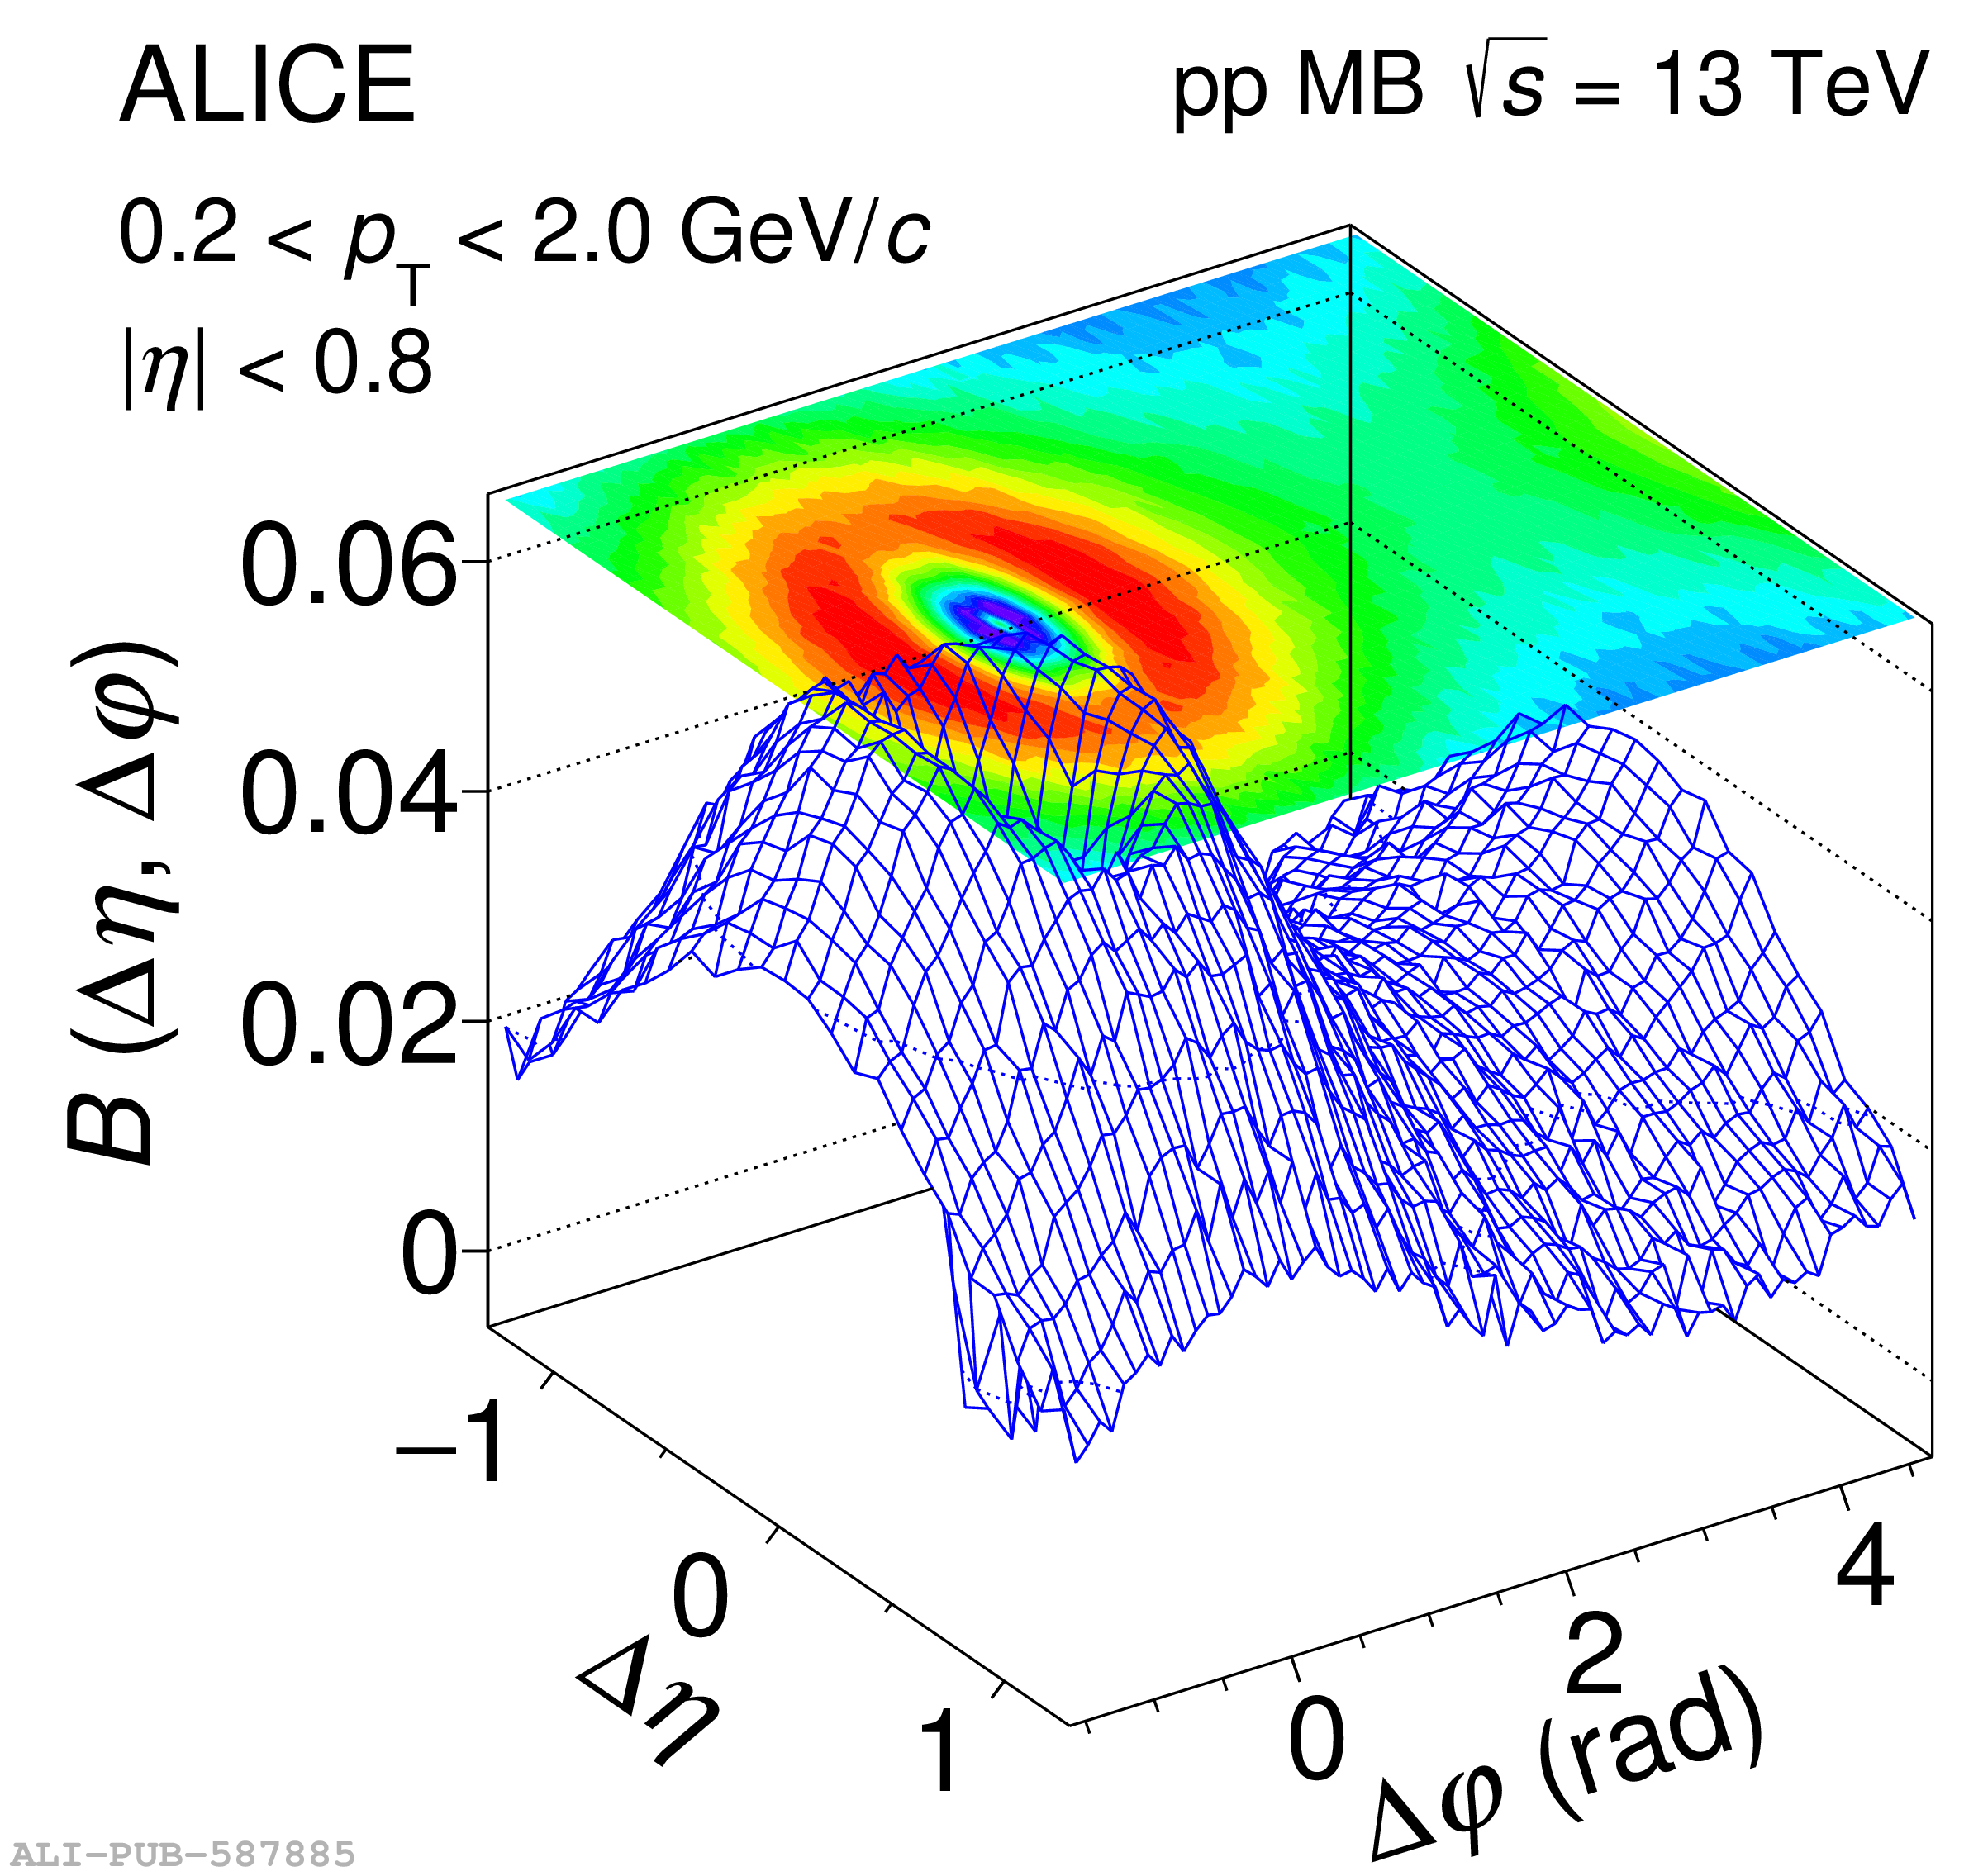
Balance function (left panel) of charged hadrons, in the selected $\pt$ range, obtained using ALICE data in pp collisions at $\s$ = 13 TeV. Integral of $B$ (right panel) results for charged hadrons in pp collisions at $\s$ = 13 TeV compared with the $B$ integral of identified hadron ($\pi \pi$, $\pi$K, and $\pi$p) pairs in Pb--Pb collisions at $\snn$ = 2.76 TeV . Vertical bars and boxes represent statistical and systematic uncertainties, respectively.