This paper presents the measurement of $π^{\pm}$, K$^{\pm}$, and p($\bar{\text{p}}$) production in high-multiplicity proton-proton collisions at $\sqrt{s} = 13$ TeV at midrapidity ($|y| <~ 0.5$) using the ALICE detector at the LHC. The transverse-momentum ($p_{\rm T}$) spectra of these particles are reported for three high-multiplicity classes. The results show a mass- and multiplicity-dependent hardening of the $p_{\rm T}$ spectra and an enhancement of the p/$π$ ratio at intermediate $p_{\rm T}$. These features are similar to those observed in heavy-ion collisions, where quark-gluon plasma formation is expected. The new measurements have extended the highest average charged-particle multiplicity density per unit of pseudorapidity achieved in pp collisions, roughly a factor five higher than that in average inelastic pp collisions, thereby reducing the multiplicity gap between small and large collision systems. In addition, the results are further compared with previously published measurements and with model calculations obtained using distinct tunes of the PYTHIA 8 Monte Carlo generator, as well as with predictions from the EPOS4. The comparison of the $p_{\rm T}$-integrated K/$π$ and p/$π$ ratios across different collision systems and energies suggests that particle production scales with charged-particle multiplicity, rather than with collision energy or system size. While the PYTHIA 8 tunes and the EPOS4 model are able to reproduce some of these measurements, either quantitatively or qualitatively, none of them consistently describes all observed features of the data.
Submitted to: EPJC
e-Print: arXiv:2603.13203 | PDF | inSPIRE
CERN-EP-2026-046
Figure group
Figure 1
Difference between measured ${\text{d}E}/{\text{d}x}$ (in the TPC) and its expected value for pions as a function of the same difference in time of flight as obtained from TOF. The plot is shown for 1.50 $ \pt $ 1.60 GeV/$c$ at midrapidity. The red box represents the regions of the 2D fit, while the gray dashed box indicates the mismatch region. | 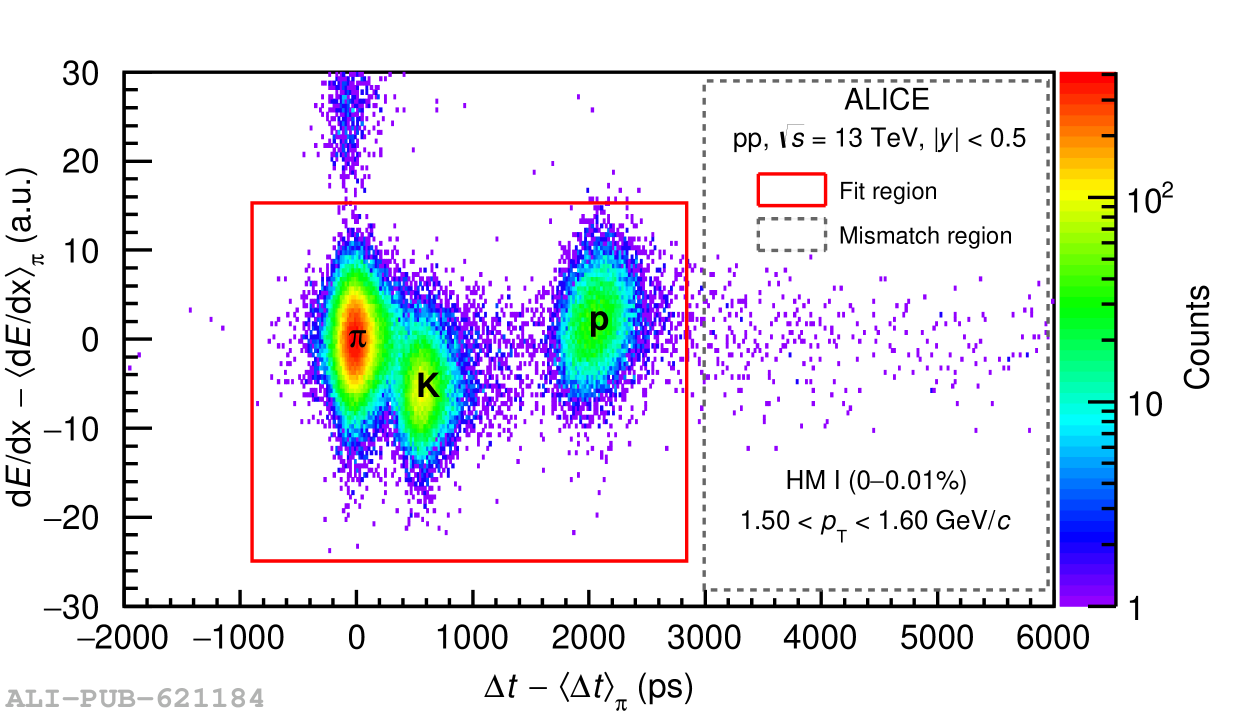 |
Figure 2
(Top panels) Transverse momentum spectra of $\pi$, K, and $\text{p}$ for different multiplicity classes. Spectra are scaled to improve visibility. The corresponding ratios to V0M I (0--0.92$\%$) spectrum are shown in the bottom panels. Vertical bars and open boxes represent the statistical and systematic uncertainties, respectively. | 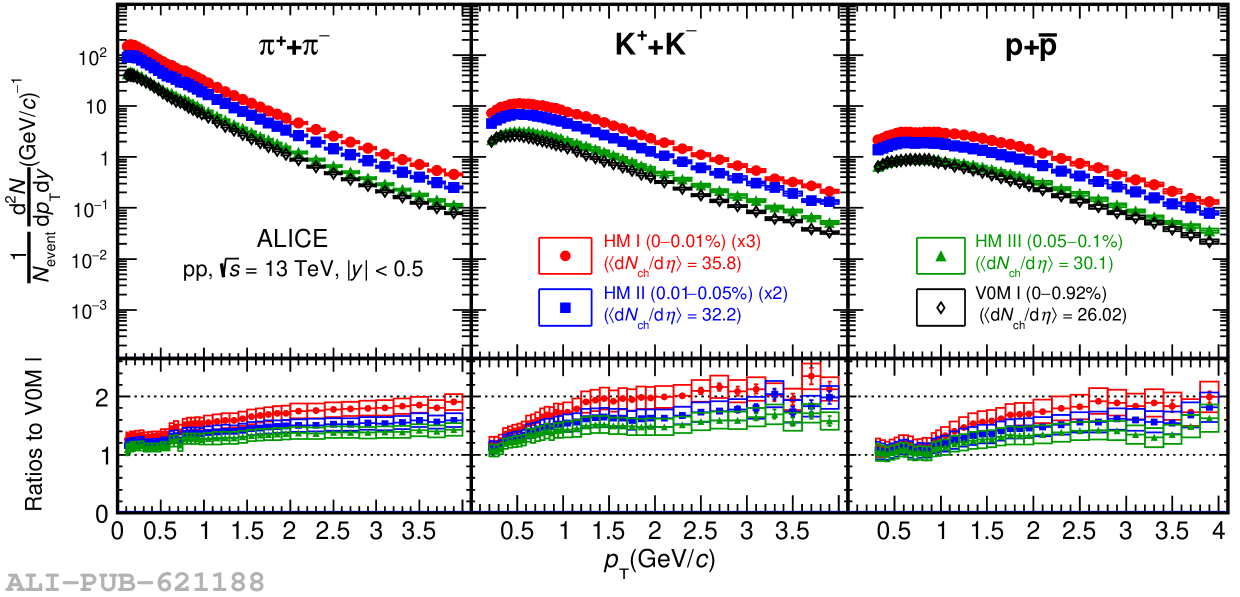 |
Figure 3
(Top panels) K/$\pi$ spectrum ratios as a function of $p_{\text{T}}$ for all three high-multiplicity classes, V0M I (0--0.92$\%$) and MB (0--100$\%$) multiplicity classes. The bottom panels show the ratio to the V0M I and MB classes. The boxes represent the systematic uncertainties, while the bars represent the statistical ones. | 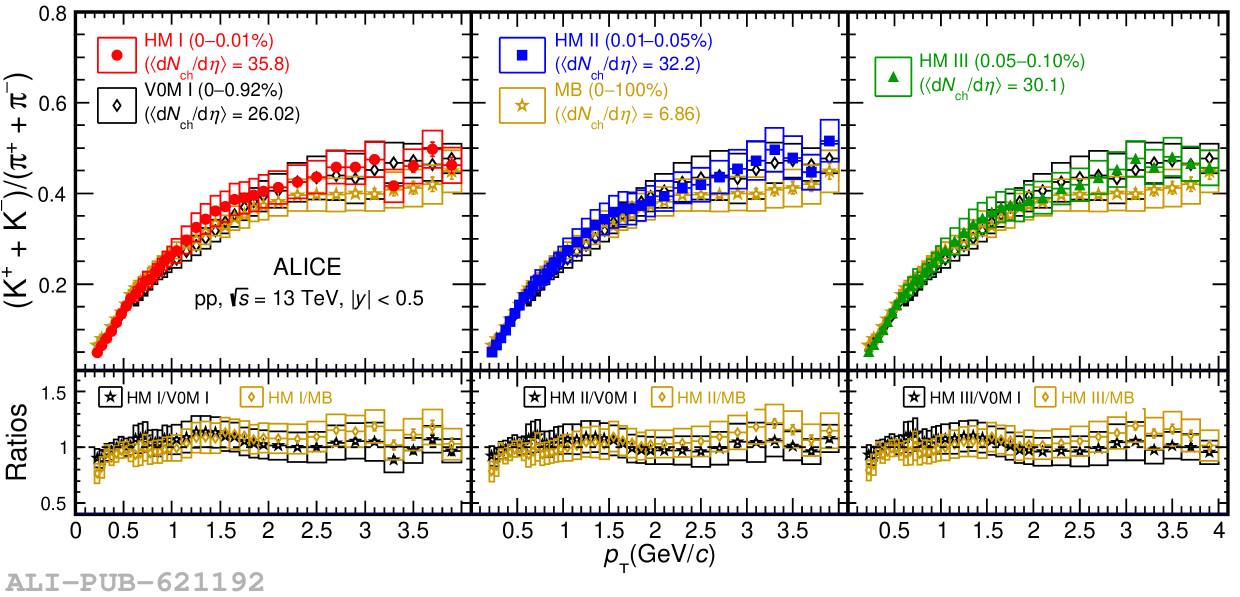 |
Figure 4
(Top panels) p/$\pi$ spectrum ratios as a function of $p_{\text{T}}$ for three high-multiplicity classes and V0M I (0--0.92$\%$) and minimum bias (MB) (0--100$\%$) multiplicity classes. The bottom panels show the ratio to the V0M I and MB classes. The boxes represent the systematic uncertainties, while the bars represent the statistical ones. | 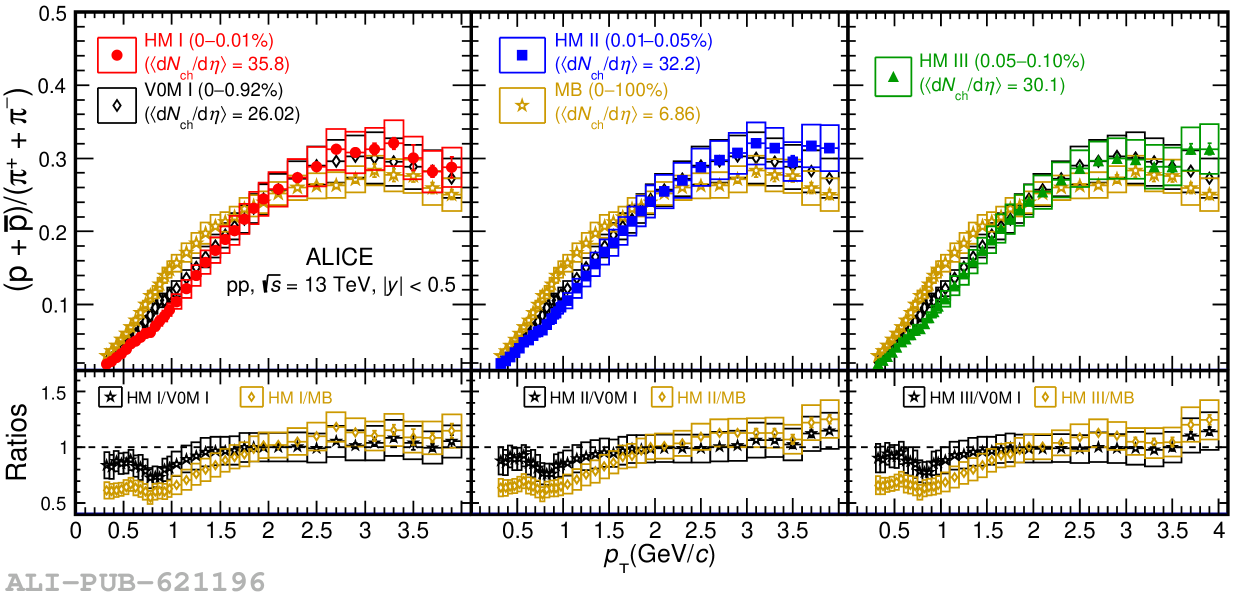 |
Figure 5
(Top panels) Measured $\pt$ spectra of $\pi$, K, and p compared with PYTHIA 8 Monash, PYTHIA 8 Shoving, PYTHIA 8 Ropes, PYTHIA 8 CLR-BLC 3, and EPOS4 MC predictions for HM I (left), HM II (middle), and HM III (right) multiplicity classes. Statistical (bars) and systematic (open boxes) uncertainties are shown for the data. The shaded bands around the MC curves represent the statistical uncertainties of the model predictions. (Bottom panels) Ratio of the data to MC predictions. The bands around one in the bottom panels represent the systematic uncertainties of the data. Model uncertainties are not included in the ratio plots for better visibility. | 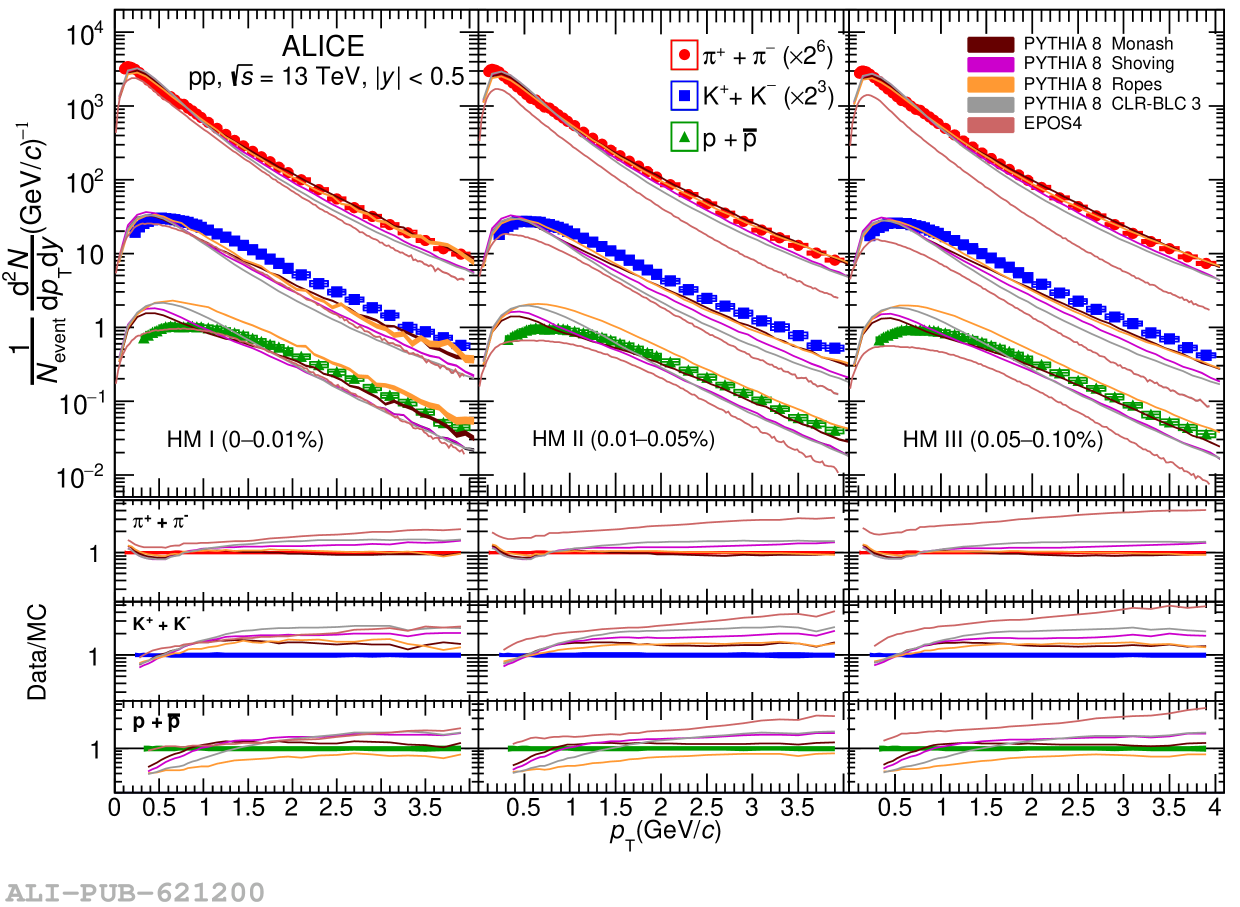 |
Figure 6
($\text{K}^{+} + \text{K}^{-})$/$(\pi^{-} + \pi^{+}$) (left) and ($\text{p} + \bar{\text{p}})$/($\pi^{-} + \pi^{+}$) (right) ratios in pp collisions as a function of $p_{\text{T}}$ compared with PYTHIA 8 Monash, PYTHIA 8 Shoving, PYTHIA 8 Ropes, PYTHIA 8 CLR-BLC 3, and EPOS4 for the HM I multiplicity class. The empty boxes are the systematic uncertainties of reported spectra ratios, and the bands represent the statistical uncertainties in the models. | 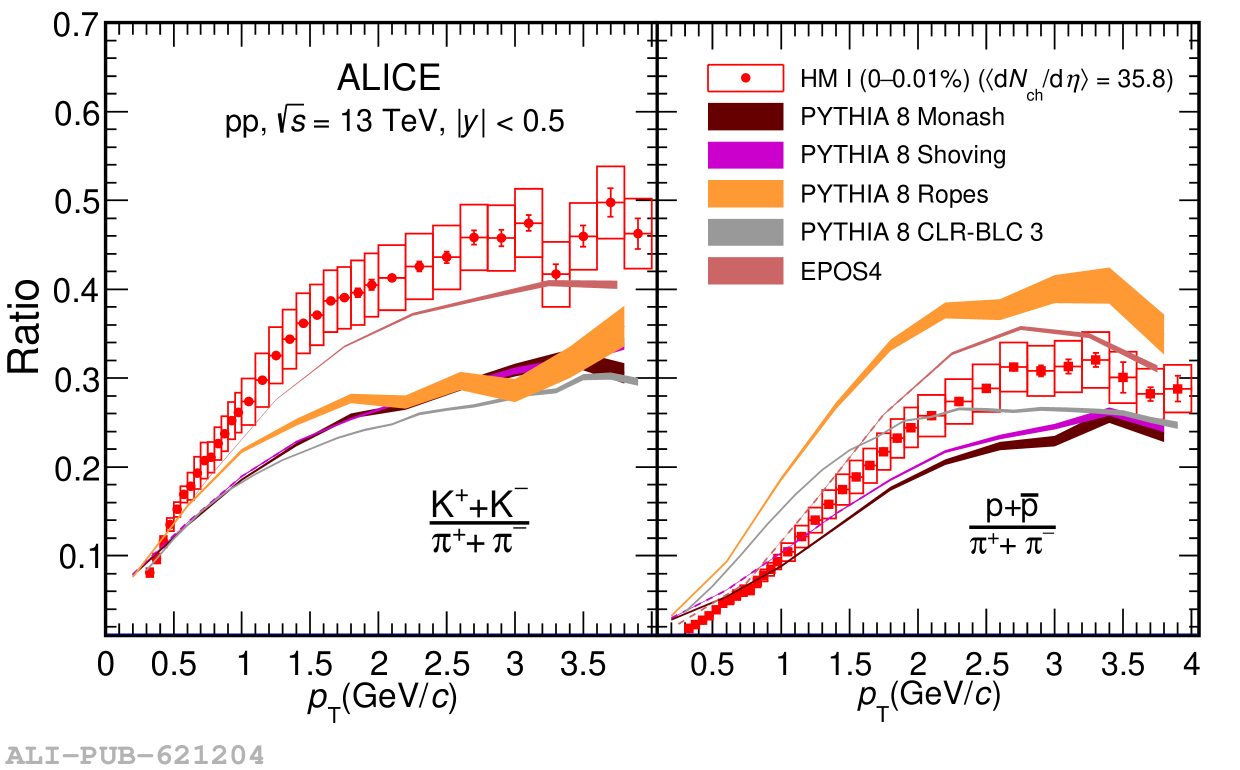 |
Figure 7
K/$\pi$ (top) and p/$\pi$ (bottom) $\pt$-integrated ratios as a function of $\avdndeta$ measured in pp, p--Pb, and Pb--Pb collisions at different center-of-mass energies . Empty boxes represent the total systematic uncertainties and bars indicate the statistical ones. Colored lines represent the predictions from different tunes of PYTHIA 8 and EPOS4 for pp collisions at $\sqrt{s}=13$ TeV. | 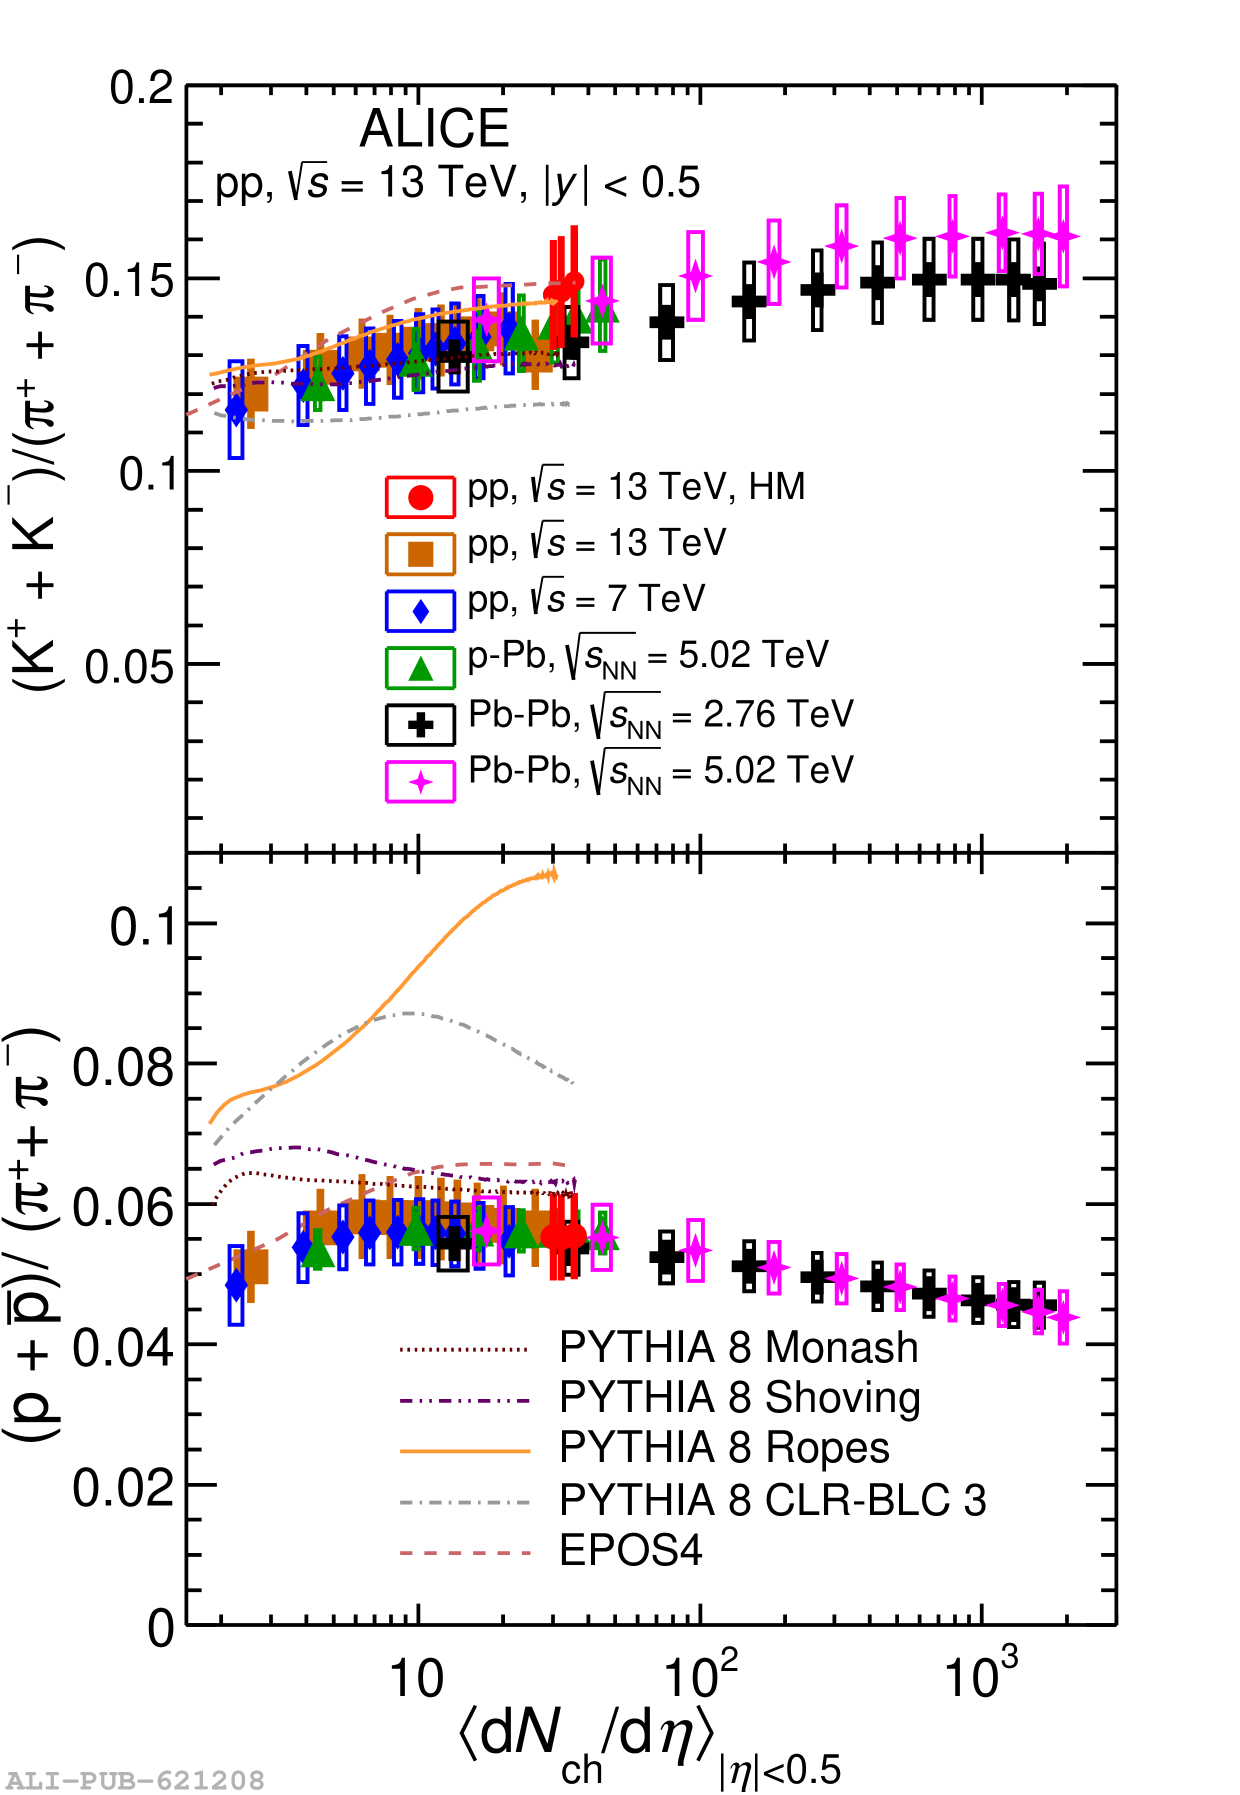 |
Figure 8
$\langle \pt \rangle$ of $\pi$, K, and p as a function of $\avdndeta$ measured in pp collisions at $\sqrt{s}=7$ and 13 TeV . Open boxes indicate systematic uncertainties, and bars indicate the statistical ones. Colored lines represent the predictions from different tunes of PYTHIA 8 and EPOS4 for pp collisions at $\sqrt{s}=13$ TeV. | 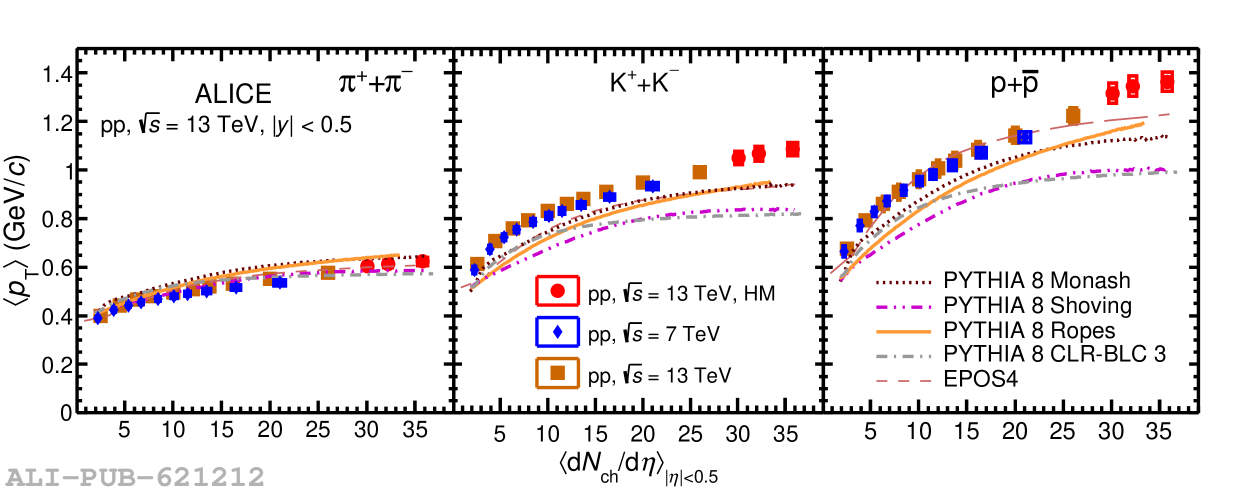 |