The azimuthal correlations of D mesons and charged particles were measured with the ALICE detector in pp collisions at $\sqrt{s}=7$ TeV and p-Pb collisions at $\sqrt{s_{\rm NN}}=5.02$ TeV at the Large Hadron Collider. D$^0$, D$^+$, and D$^{*+}$ mesons and their charge conjugates with transverse momentum $3<~p_{\rm T}<~16$ GeV/$c$ and rapidity in the nucleon-nucleon centre-of-mass system $|y_{\rm cms}|<~0.5$ (pp collisions) and $-0.96<~y_{\rm cms}<~0.04$ (p-Pb collisions) were correlated to charged particles with $p_{\rm T}>0.3$ Gev/$c$. The properties of the correlation peak induced by the jet containing the D meson, described in terms of the yield of charged particles in the peak and peak width, are compatible within uncertainties between the two collision systems, and described by Monte-Carlo simulations based on the PYTHIA, POWHEG and EPOS 3 event generators.
Eur. Phys. J. C 77 (2017) 245
HEP Data
e-Print: arXiv:1605.06963 | PDF | inSPIRE
CERN-EP-2016-129
Figure 1
Distributions of $\Dzero$ (left column) and $\Dplus$ (middle column) candidates invariant mass and ofthe $\Dstar$ candidates invariant-mass difference (right column). The distributions are shown for pp collisions in the $3< \pt< 5 \gevc$ range (top row) and for p-Pb collisions in the $5< \pt< 8 \gevc$ (middle row) and $8< \pt< 16 \gevc$ (bottom row) ranges. The fits to the invariant mass distributions and the Gaussian mean and sigma values are also shown. | 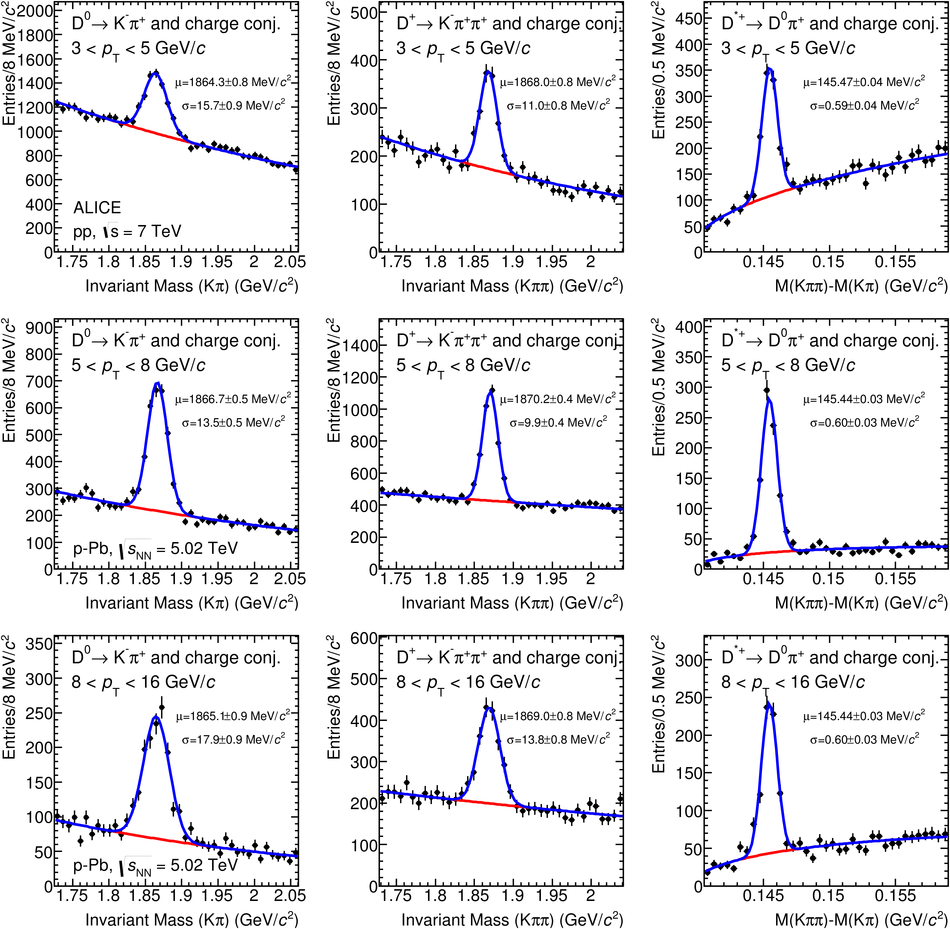 |
Figure 2
Comparison of the azimuthal-correlation distributions of D mesons with charged particles obtained for $\Dzero$, $\Dplus$ and $\Dstar$ mesons Comparison of the azimuthal-correlation distributions of D mesons with charged particles obtained for $\Dzero$, $\Dplus$ and $\Dstar$ mesons for $5< p_{\rm T}^{\rm D}< 8 \gevc$, $p_{\rm T}^{\rm assoc} > 1 \gevc$ in pp collisions at $\sqrts=7 \tev$ (left panel) and for $8< p_{\rm T}^{\rm D}< 16 \gevc$, $p_{\rm T}^{\rm assoc} > 1 \gevc$ in $p-P$ collisions at $\sqrtsNN=5.02 \tev$ (right panel). The statistical uncertainties are shown as error bars, the $\Delta\varphi$-uncorrelated systematic uncertainties as boxes, while the part of systematic uncertainty correlated in $\Delta\varphi$ is reported as text (scale uncertainty). The latter is largely uncorrelated among the D-meson species. |  |
Figure 3
Average of the azimuthal-correlation distributions of $\Dzero$, $\Dplus$ and $\Dstar$ mesons with $3< p_{\rm T}^{\rm D}< 5 \gevc$ (left column), $5< p_{\rm T}^{\rm D}< 8 \gevc$ (middle column), and $8< p_{\rm T}^{\rm D}< 16 \gevc$ (right column), with charged particles with $p_{\rm T}^{\rm assoc}>0.3 \gevc$ (top row), $0.3< p_{\rm T}^{\rm assoc}< 1 \gevc$ (middle row), and $p_{\rm T}^{\rm assoc}>1 \gevc$ (bottom row), measured in pp collisions at $\sqrts=7 \tev$ and in p-Pb collisions at $\sqrtsNN=5.02 \tev$. The statistical uncertainties are shown as error bars, the $\Delta\varphi$-uncorrelated systematic uncertainties as boxes, while the part of systematic uncertainty correlated in $\Delta\varphi$ is reported as text (scale uncertainty).
|  |
Figure 4
Comparison of the azimuthal-correlation distributions of D mesons with $5< p_{\rm T}^{\rm D}< 8 \gevc$ (left column) and $8< p_{\rm T}^{\rm D}< 16 \gevc$ (right column) with charged particles with $p_{\rm T}^{\rm assoc}>0.3 \gevc$ (top row), $0.3< p_{\rm T}^{\rm assoc}< 1 \gevc$ (middle row), and $p_{\rm T}^{\rm assoc}>1 \gevc$ (bottom row) in pp collisions at $\sqrts=7 \tev$ and in p--Pb collisions at $\sqrtsNN=5.02 \tev$, after baseline subtraction. The statistical uncertainties are shown as error bars, the $\Delta\varphi$-uncorrelated systematic uncertainties as boxes around the data points, the part of systematic uncertainty correlated in $\Delta\varphi$ is reported as text (scale uncertainty), the uncertainties deriving from the subtraction of the baselines are represented by the boxes at $\Delta\varphi>\pi$. | 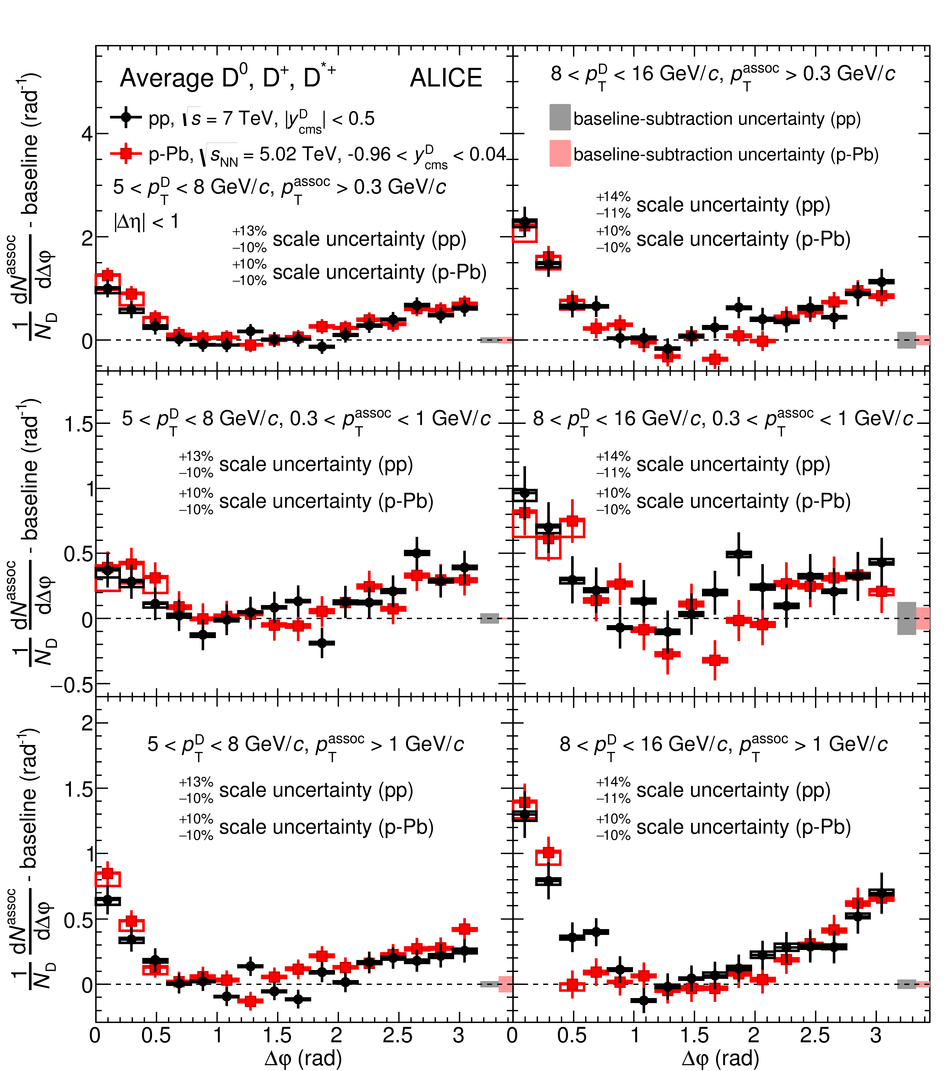 |
Figure 5
Examples of the fit to the azimuthal-correlation distribution, for D mesons with $5< p_{\rm T}^{\rm D}< 8 \gevc$ with charged particles with $p_{\rm T}^{\rm assoc}>1 \gevc$ in pp collisions at $\sqrts=7 \tev$ (left), and for D mesons with $8< p_{\rm T}^{\rm D}< 16 \gevc$ with charged particles with $p_{\rm T}^{\rm assoc}>1 \gevc$ in p--Pb collisions at $\sqrtsNN=5.02 \tev$ (right). The statistical uncertainties are shown as error bars, the $\Delta\varphi$-uncorrelated systematic uncertainties as boxes, while the part of systematic uncertainty correlated in $\Delta\varphi$ is reported as text (scale uncertainty). The terms of the fit function described in Section 3.3 are also shown separately: near-side Gaussian function (blue dashed line), away-side Gaussian function (green dashed-dotted line) and baseline constant term (magenta dotted line). | 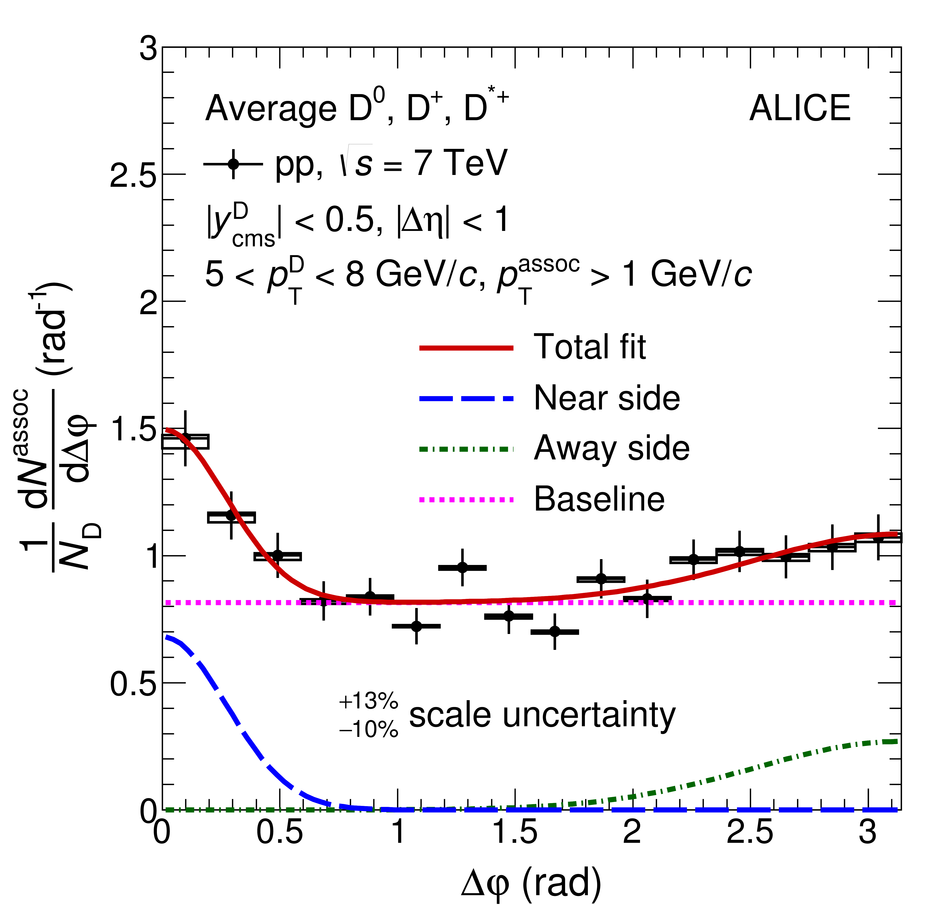 |
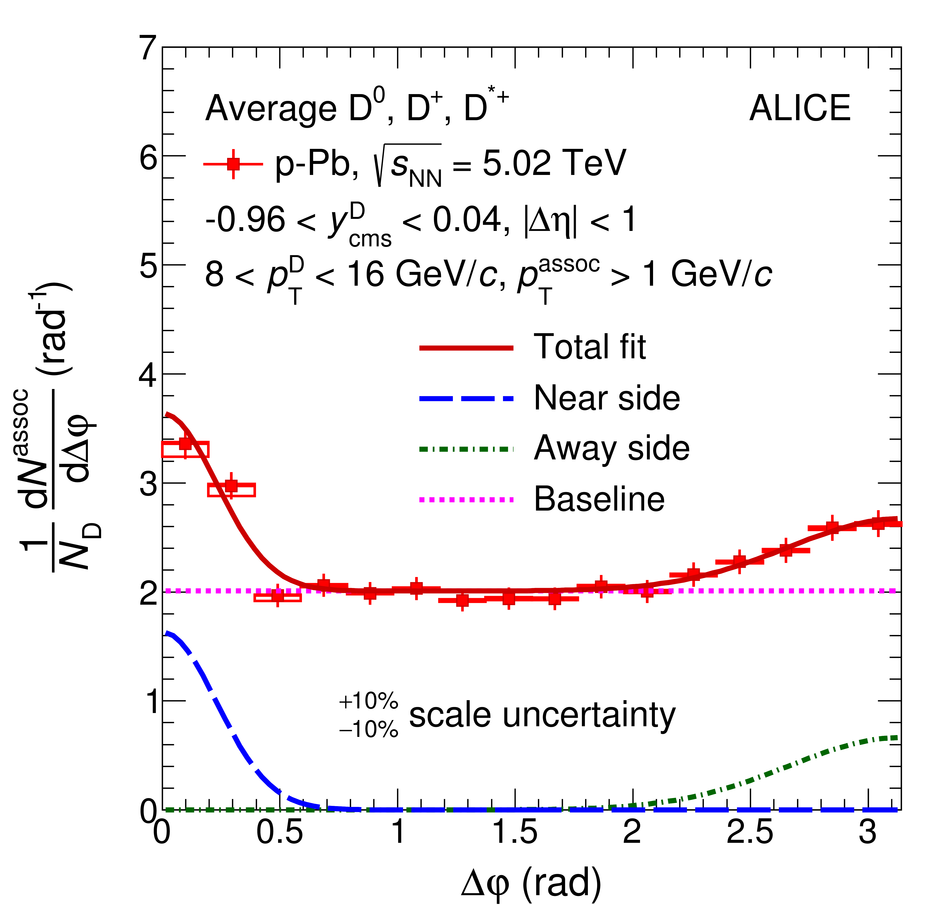
Figure 6
Comparison of the near-side peak associated yield (top row) and peak width (bottom row) in pp and $p-P$ collisions as a function of $p_{\rm T}^{\rm D}$, for $p_{\rm T}^{\rm assoc}>0.3 \gevc$ (left column), $0.3< p_{\rm T}^{\rm assoc}< 1 \gevc$ (middle column), and $p_{\rm T}^{\rm assoc}>1 \gevc$ (right column). The points and error boxes for p-Pb collisions are shifted by $\Delta\pt = +0.3 \gevc$. Statistical and systematic uncertainties are shown as error bars and boxes, respectively. |  |
Figure 7
Comparison of $\Delta\varphi$-correlation distributions of D mesons with charged particles measured in pp collisions at $\sqrts=7 \tev$ and Monte-Carlo simulations performed with different event generators, after the subtraction of the baseline. The statistical and systematic uncertainties of the measured distributions are displayed as in Figure 4.
| 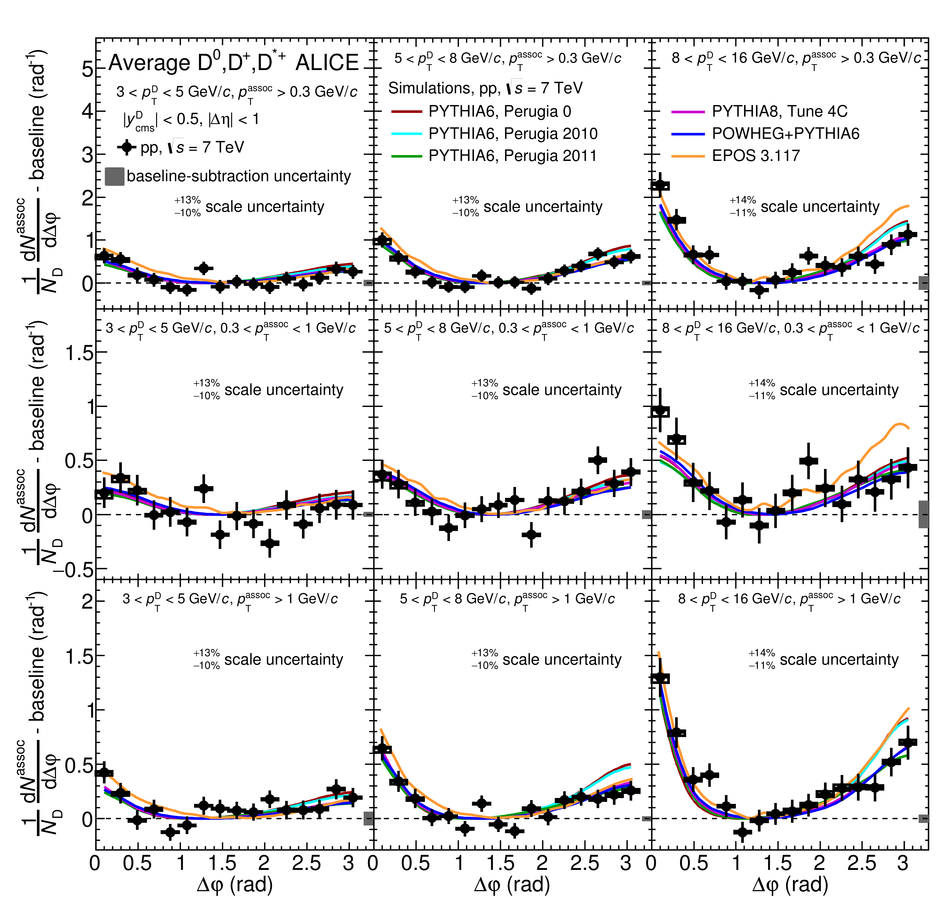 |
Figure 8
Comparison of near-side peak associated yield (top row), near-side peak width (middle row), and baseline (bottom row) values measured in pp collisions at $\sqrts=7 \tev$ with the expectations from simulations performed with different Monte-Carlo event generators. Statistical and systematic uncertainties are shown as error bars and boxes, respectively. |  |
Figure 9
Comparison of near-side peak associated yield (top row) and near-side peak width (bottom row) values measured in p-Pb collisions at $\sqrtsNN=5.02 \tev$ with the expectations from simulations performed with different Monte-Carlo event generators. Statistical and systematic uncertainties are shown as error bars and boxes, respectively. | 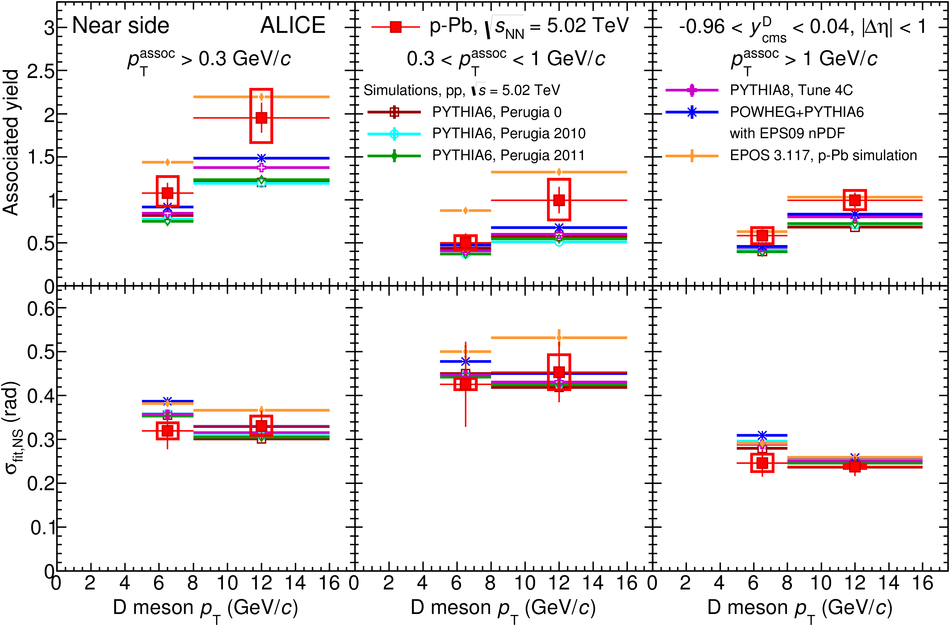 |