Comparison of the azimuthal-correlation distributions of D mesons with $5< p_{\rm T}^{\rm D}< 8 \gevc$ (left column) and $8< p_{\rm T}^{\rm D}< 16 \gevc$ (right column) with charged particles with $p_{\rm T}^{\rm assoc}>0.3 \gevc$ (top row), $0.3< p_{\rm T}^{\rm assoc}< 1 \gevc$ (middle row), and $p_{\rm T}^{\rm assoc}>1 \gevc$ (bottom row) in pp collisions at $\sqrts=7 \tev$ and in p--Pb collisions at $\sqrtsNN=5.02 \tev$, after baseline subtraction. The statistical uncertainties are shown as error bars, the $\Delta\varphi$-uncorrelated systematic uncertainties as boxes around the data points, the part of systematic uncertainty correlated in $\Delta\varphi$ is reported as text (scale uncertainty), the uncertainties deriving from the subtraction of the baselines are represented by the boxes at $\Delta\varphi>\pi$. | 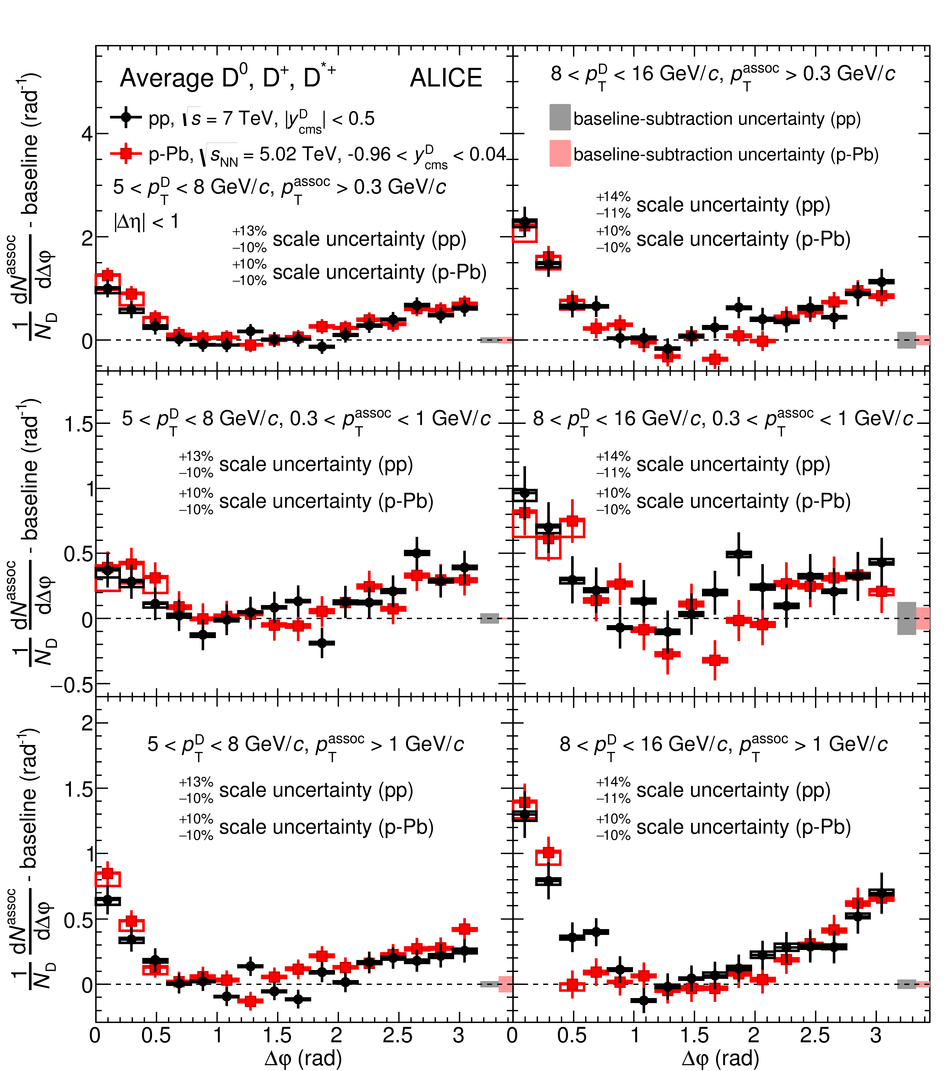 |