Purity of the isolated-photon sample as a function of \ptg\ calculated using Eq. \eqref{eq:ABCDpurityMC}. The statistical and systematic uncertainties have been evaluated as discussed in Sect. \ref{sec:sys_unc}. The red and blue lines are the results of a fit to the measured purity using a two-sigmoid-function described by Eq. \eqref{eq:sigmoid} for two different transverse momentum intervals. | 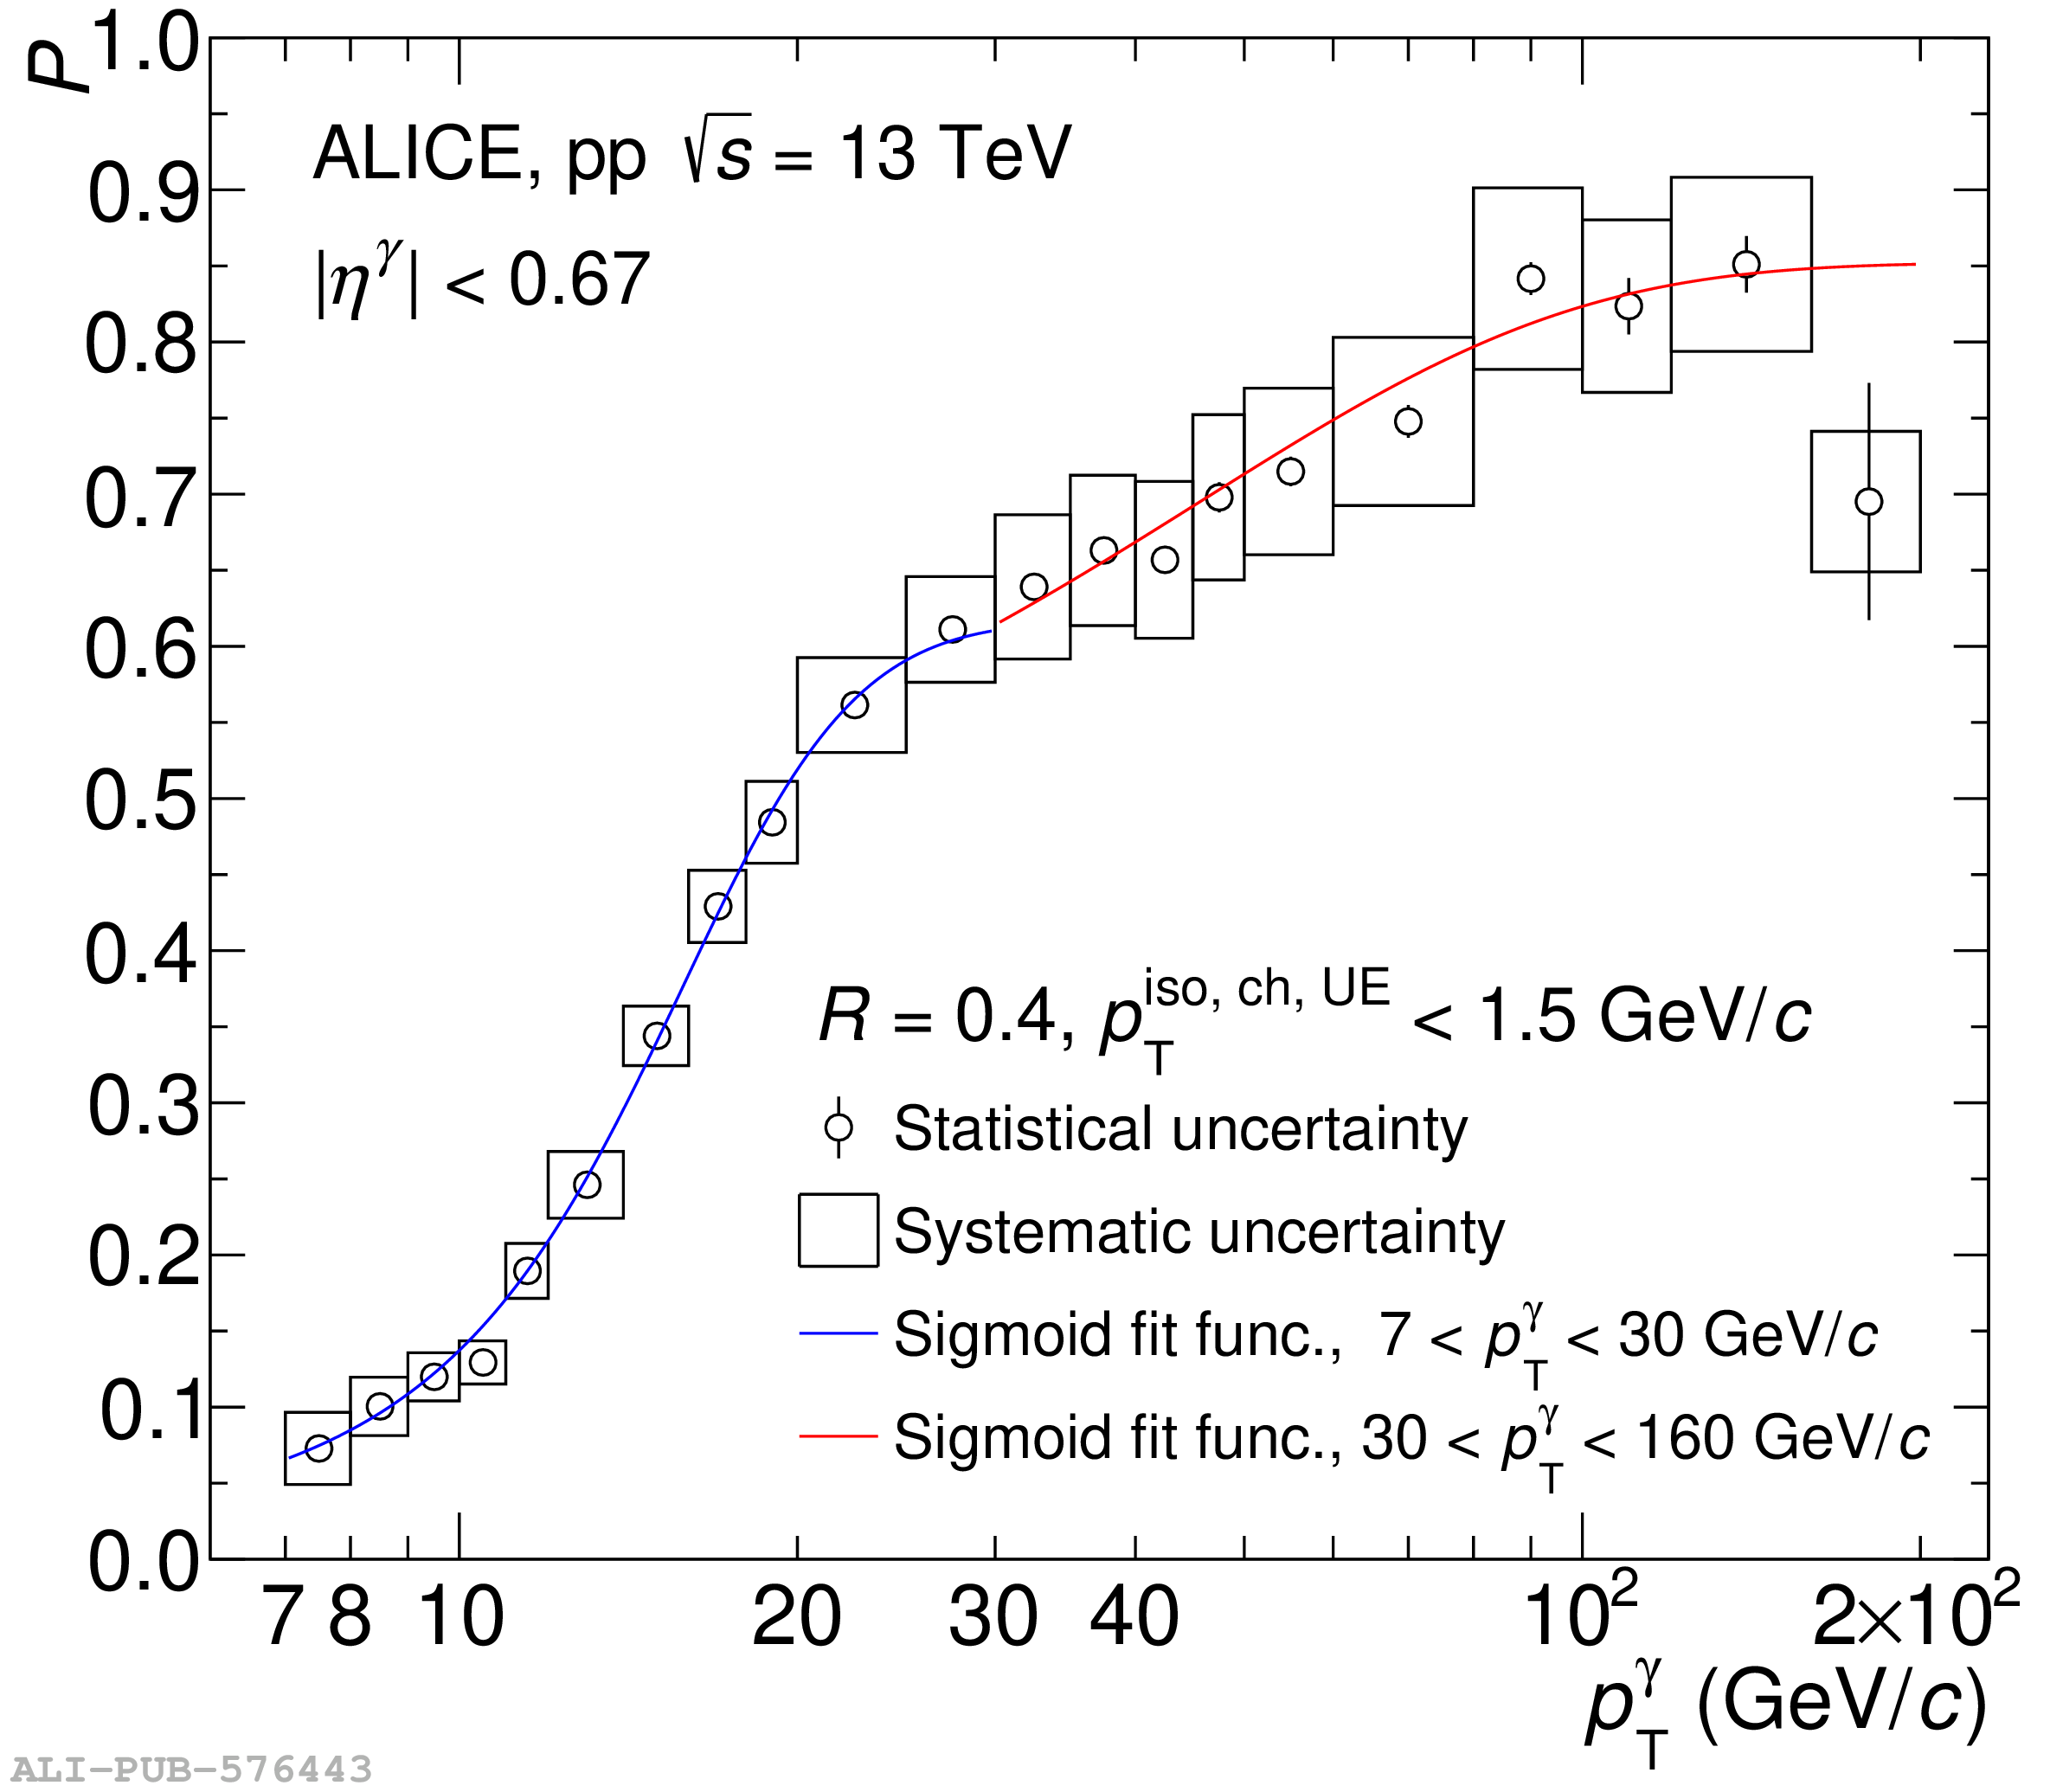 |