Genuine correlation functions with statistical (bars) and systematic uncertainties (boxes) compared to theoretical model predictions (bands). The width of the bands represents the uncertainty related to the source. The number of standard deviations $n_{\sigma}$ is reported for each model in the legend. The results are shown for \DstarPi (first row) and \DstarK (second row) for the opposite- (left column) and same-chage (right column) combinations. | 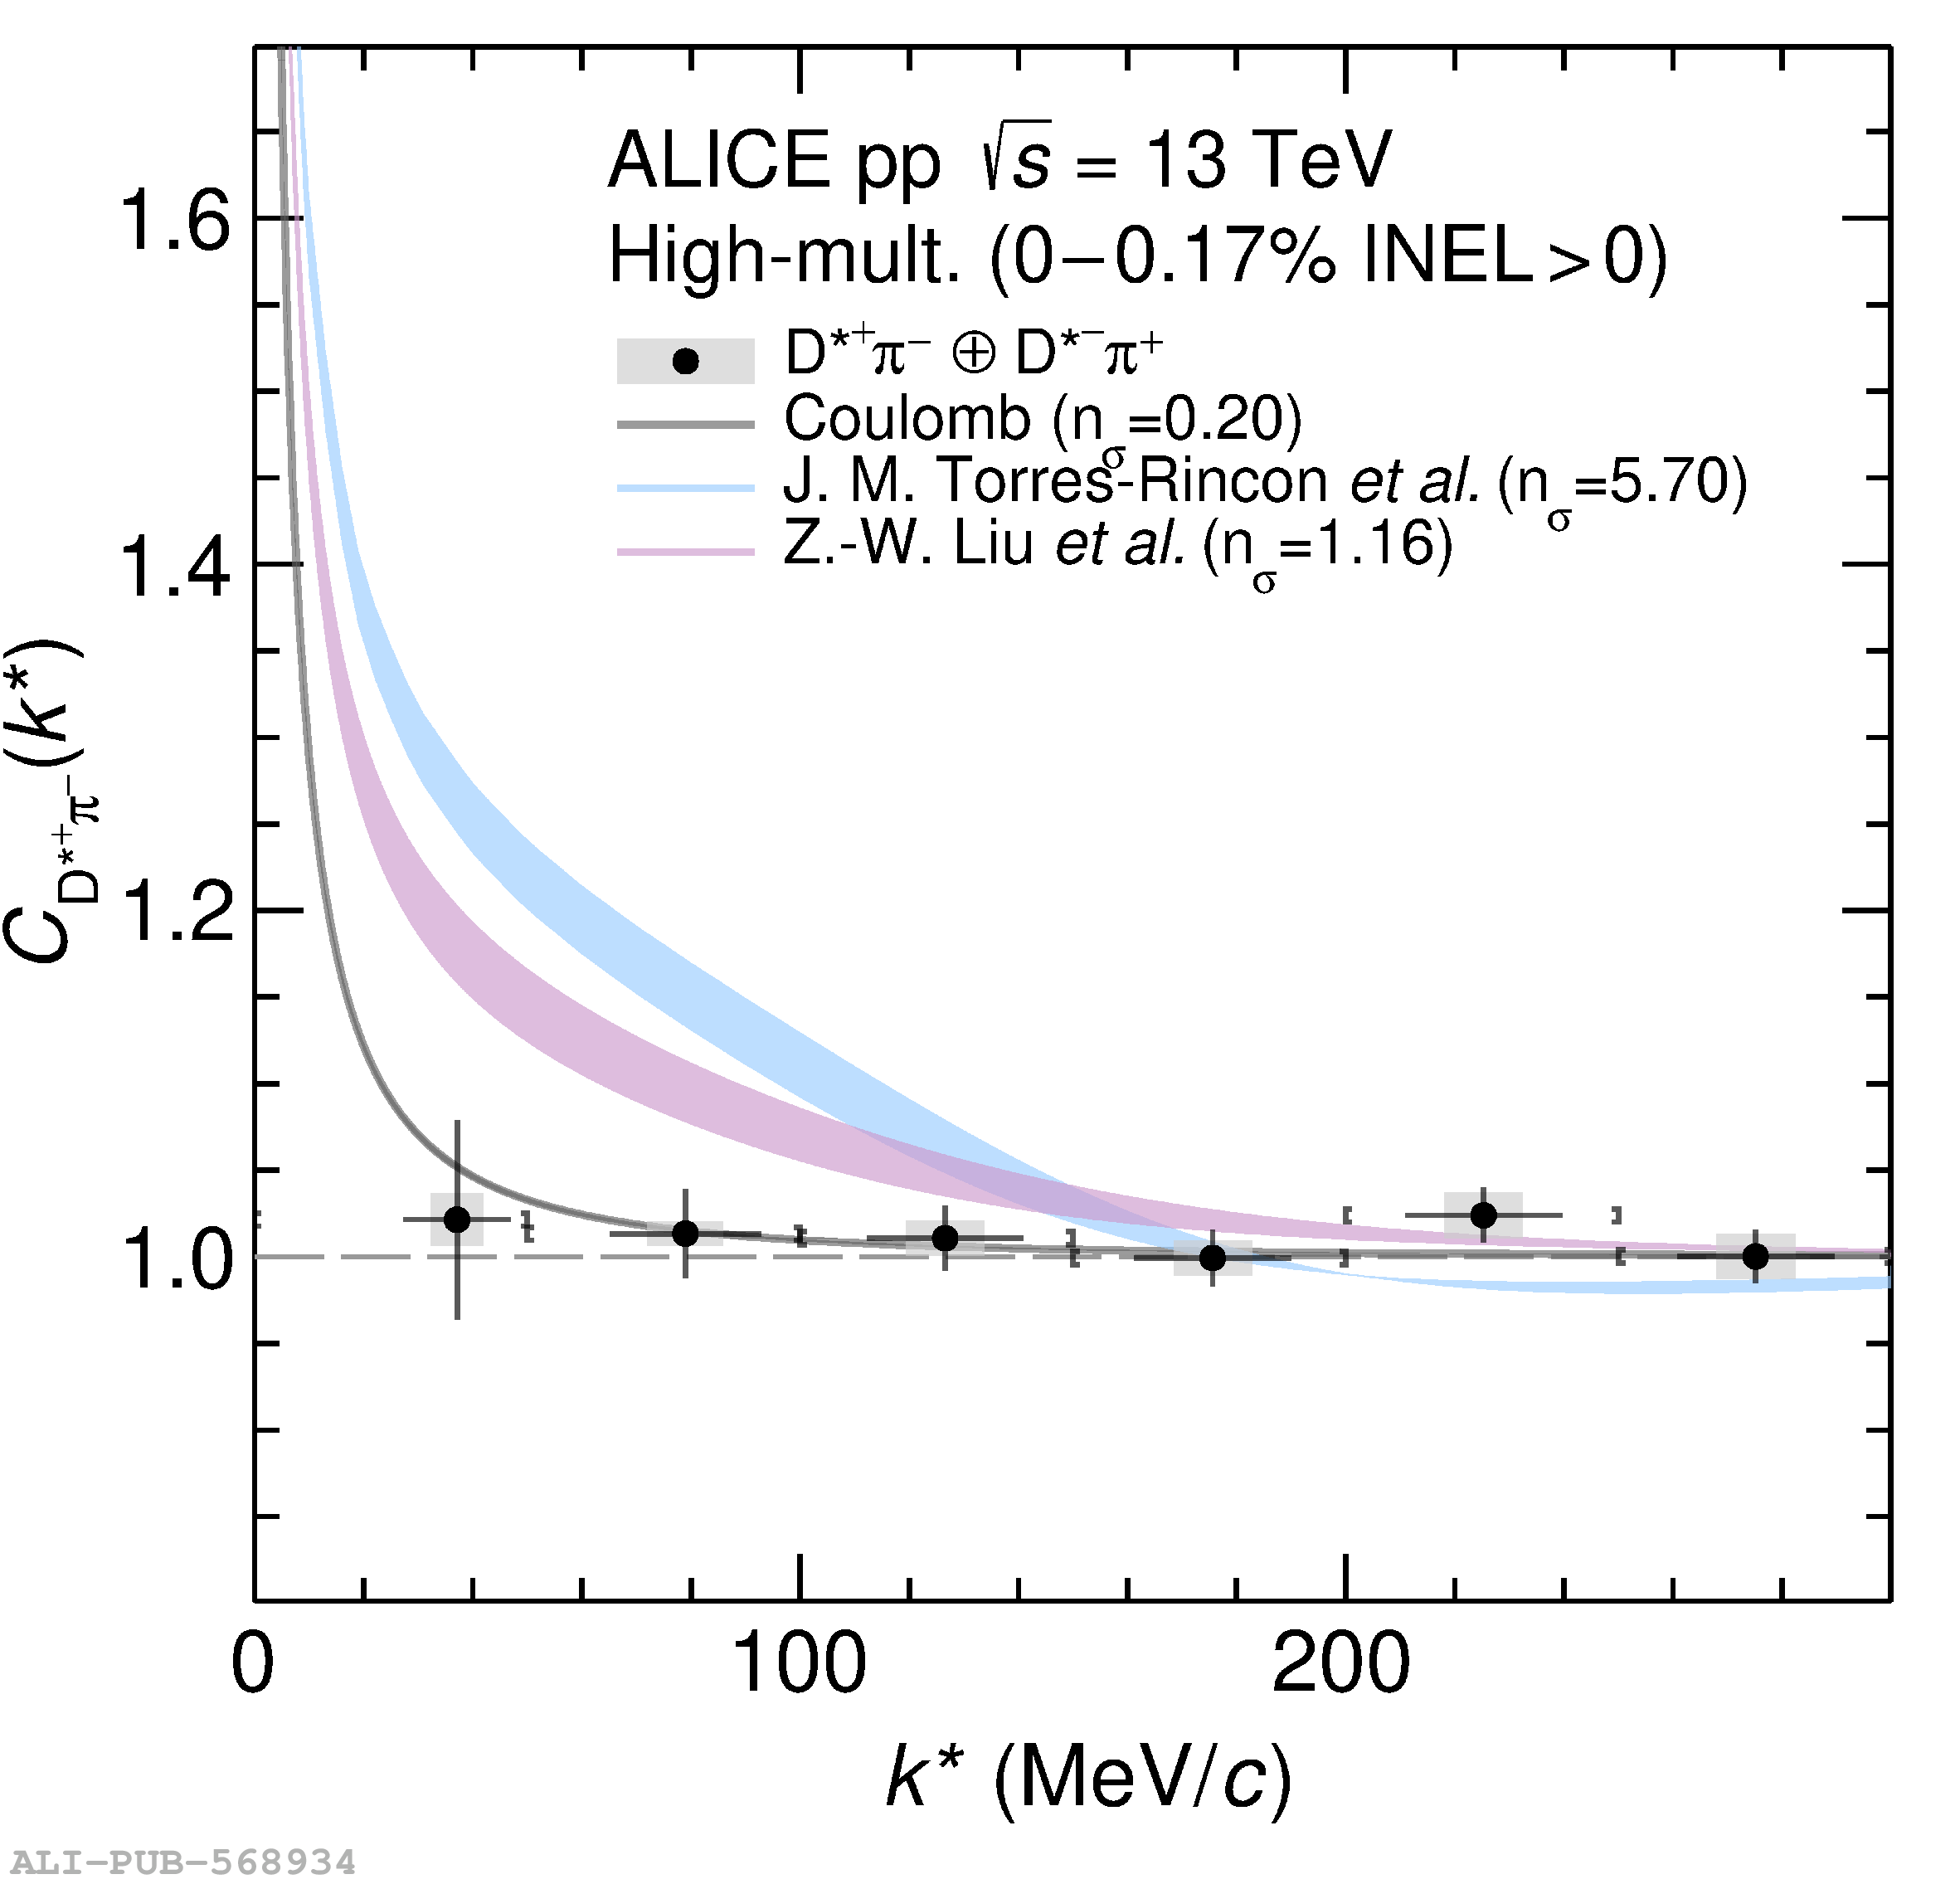  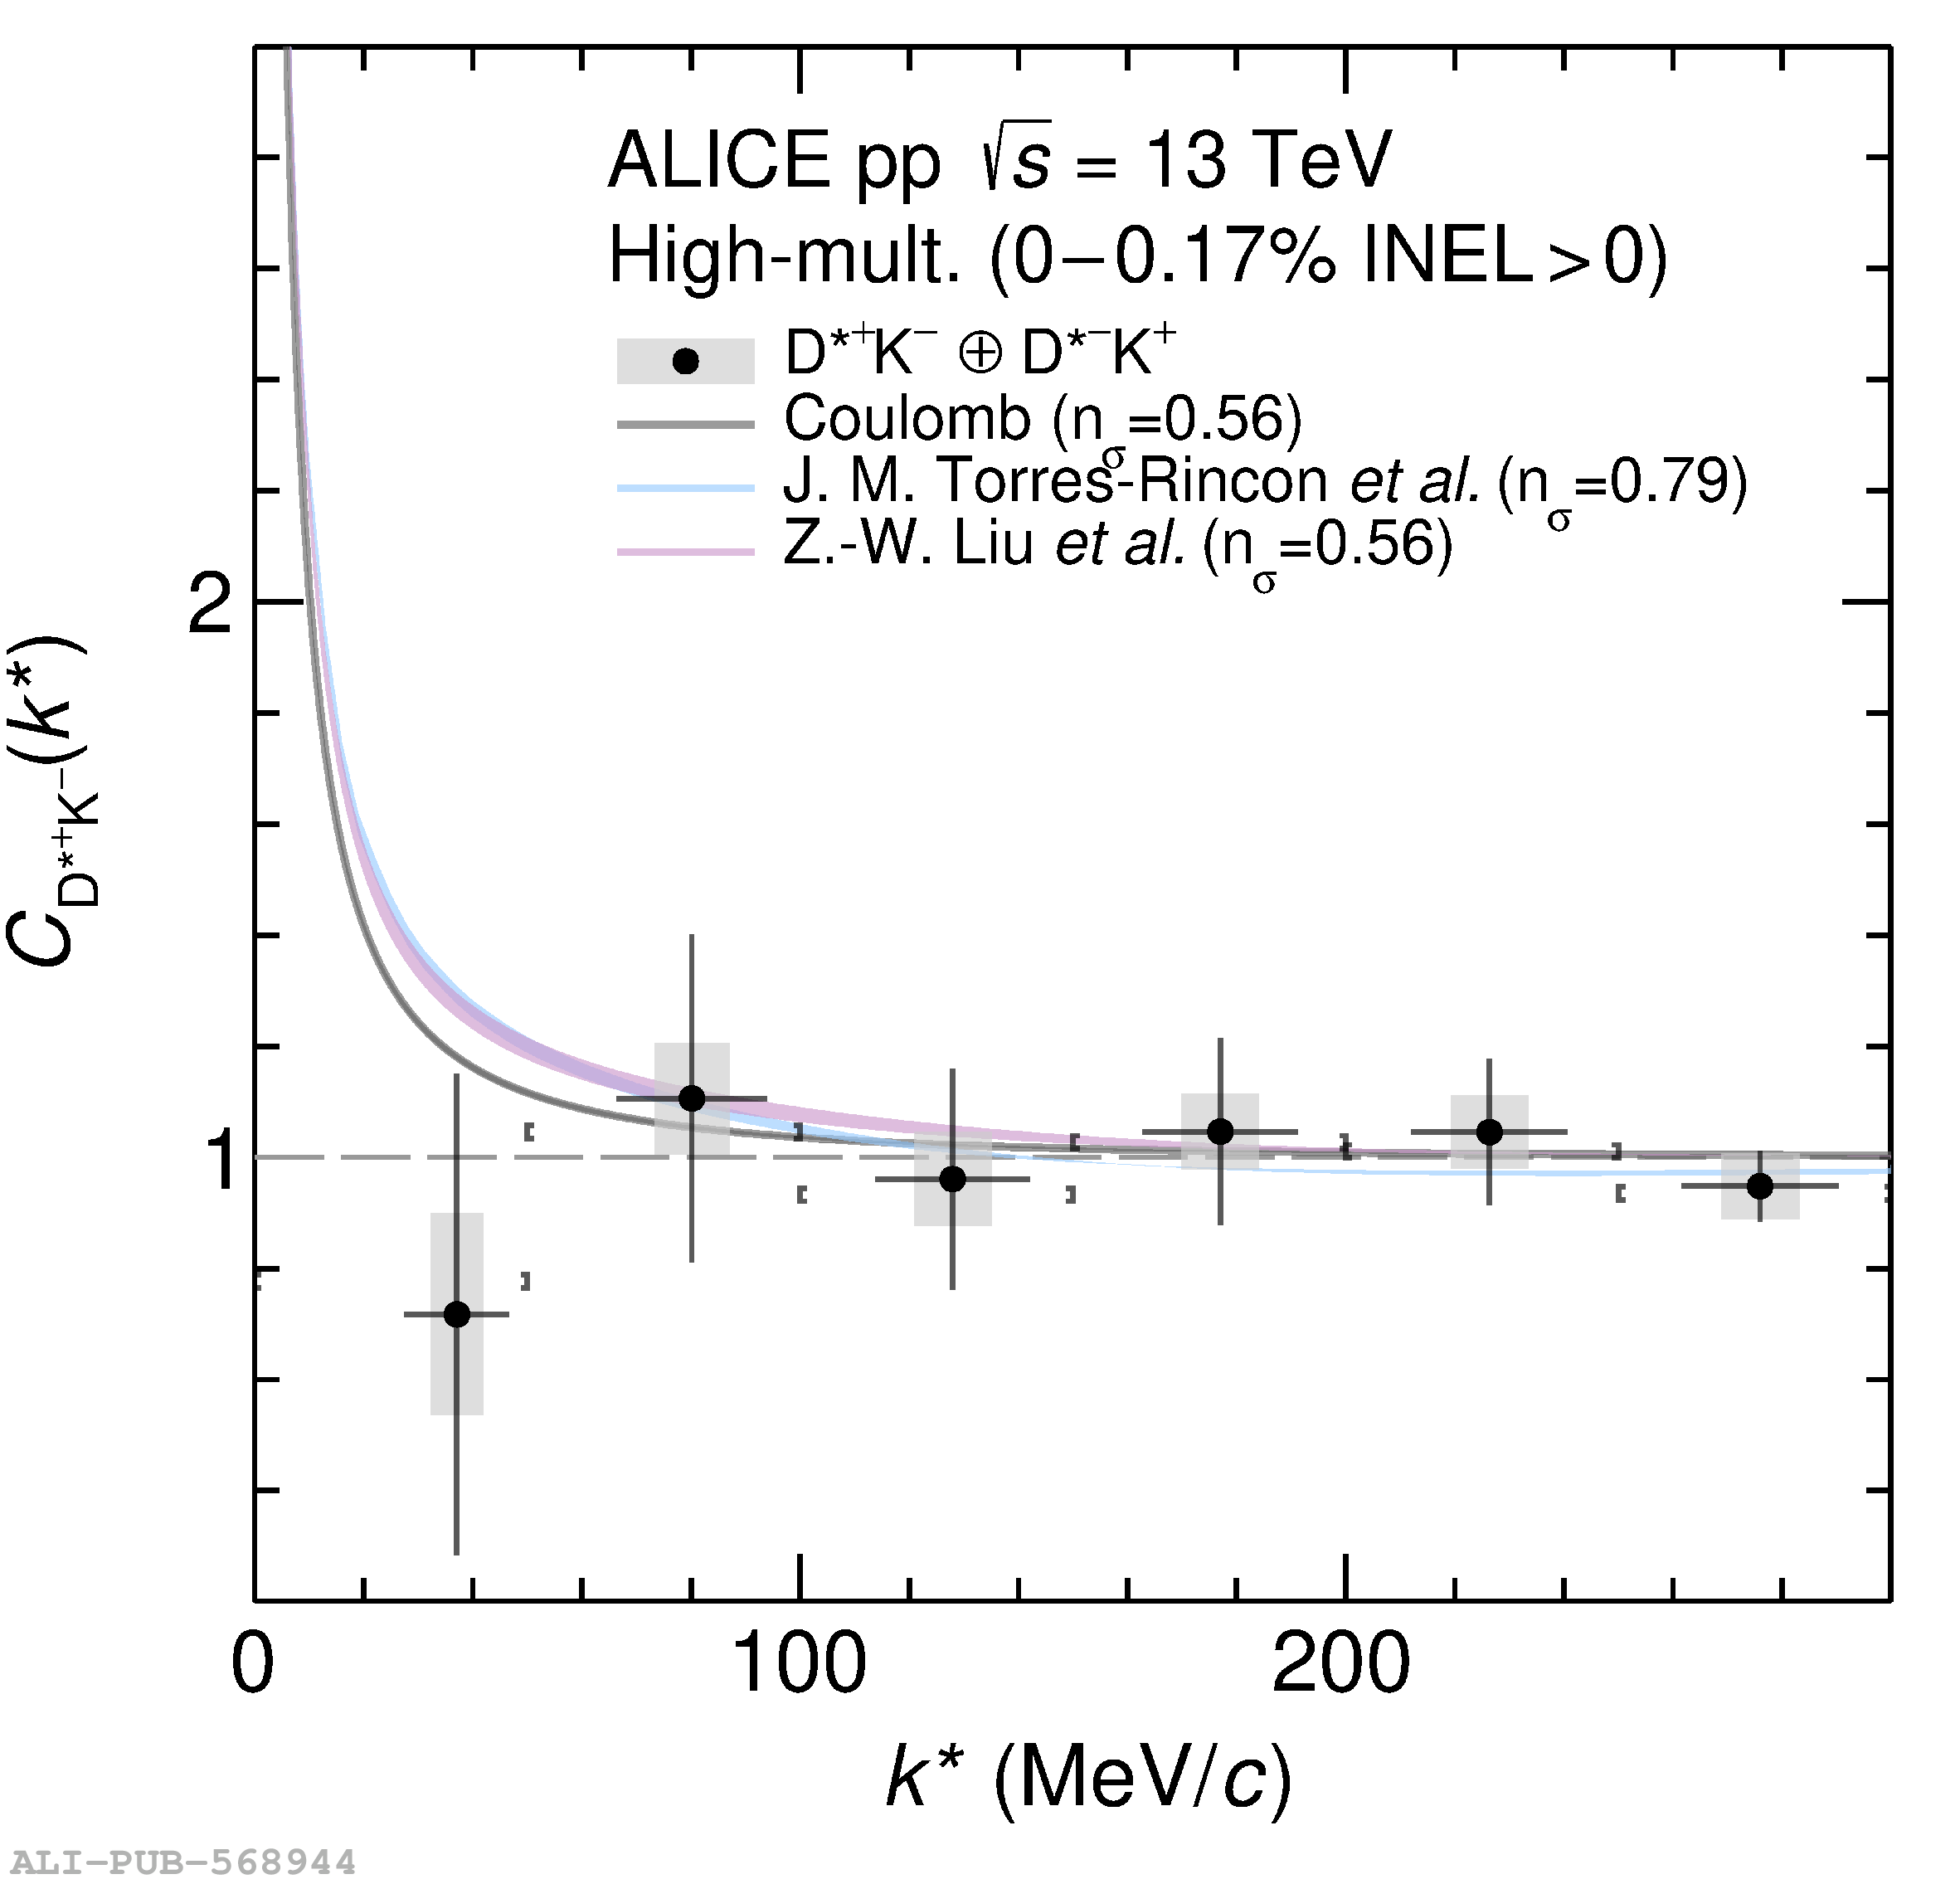 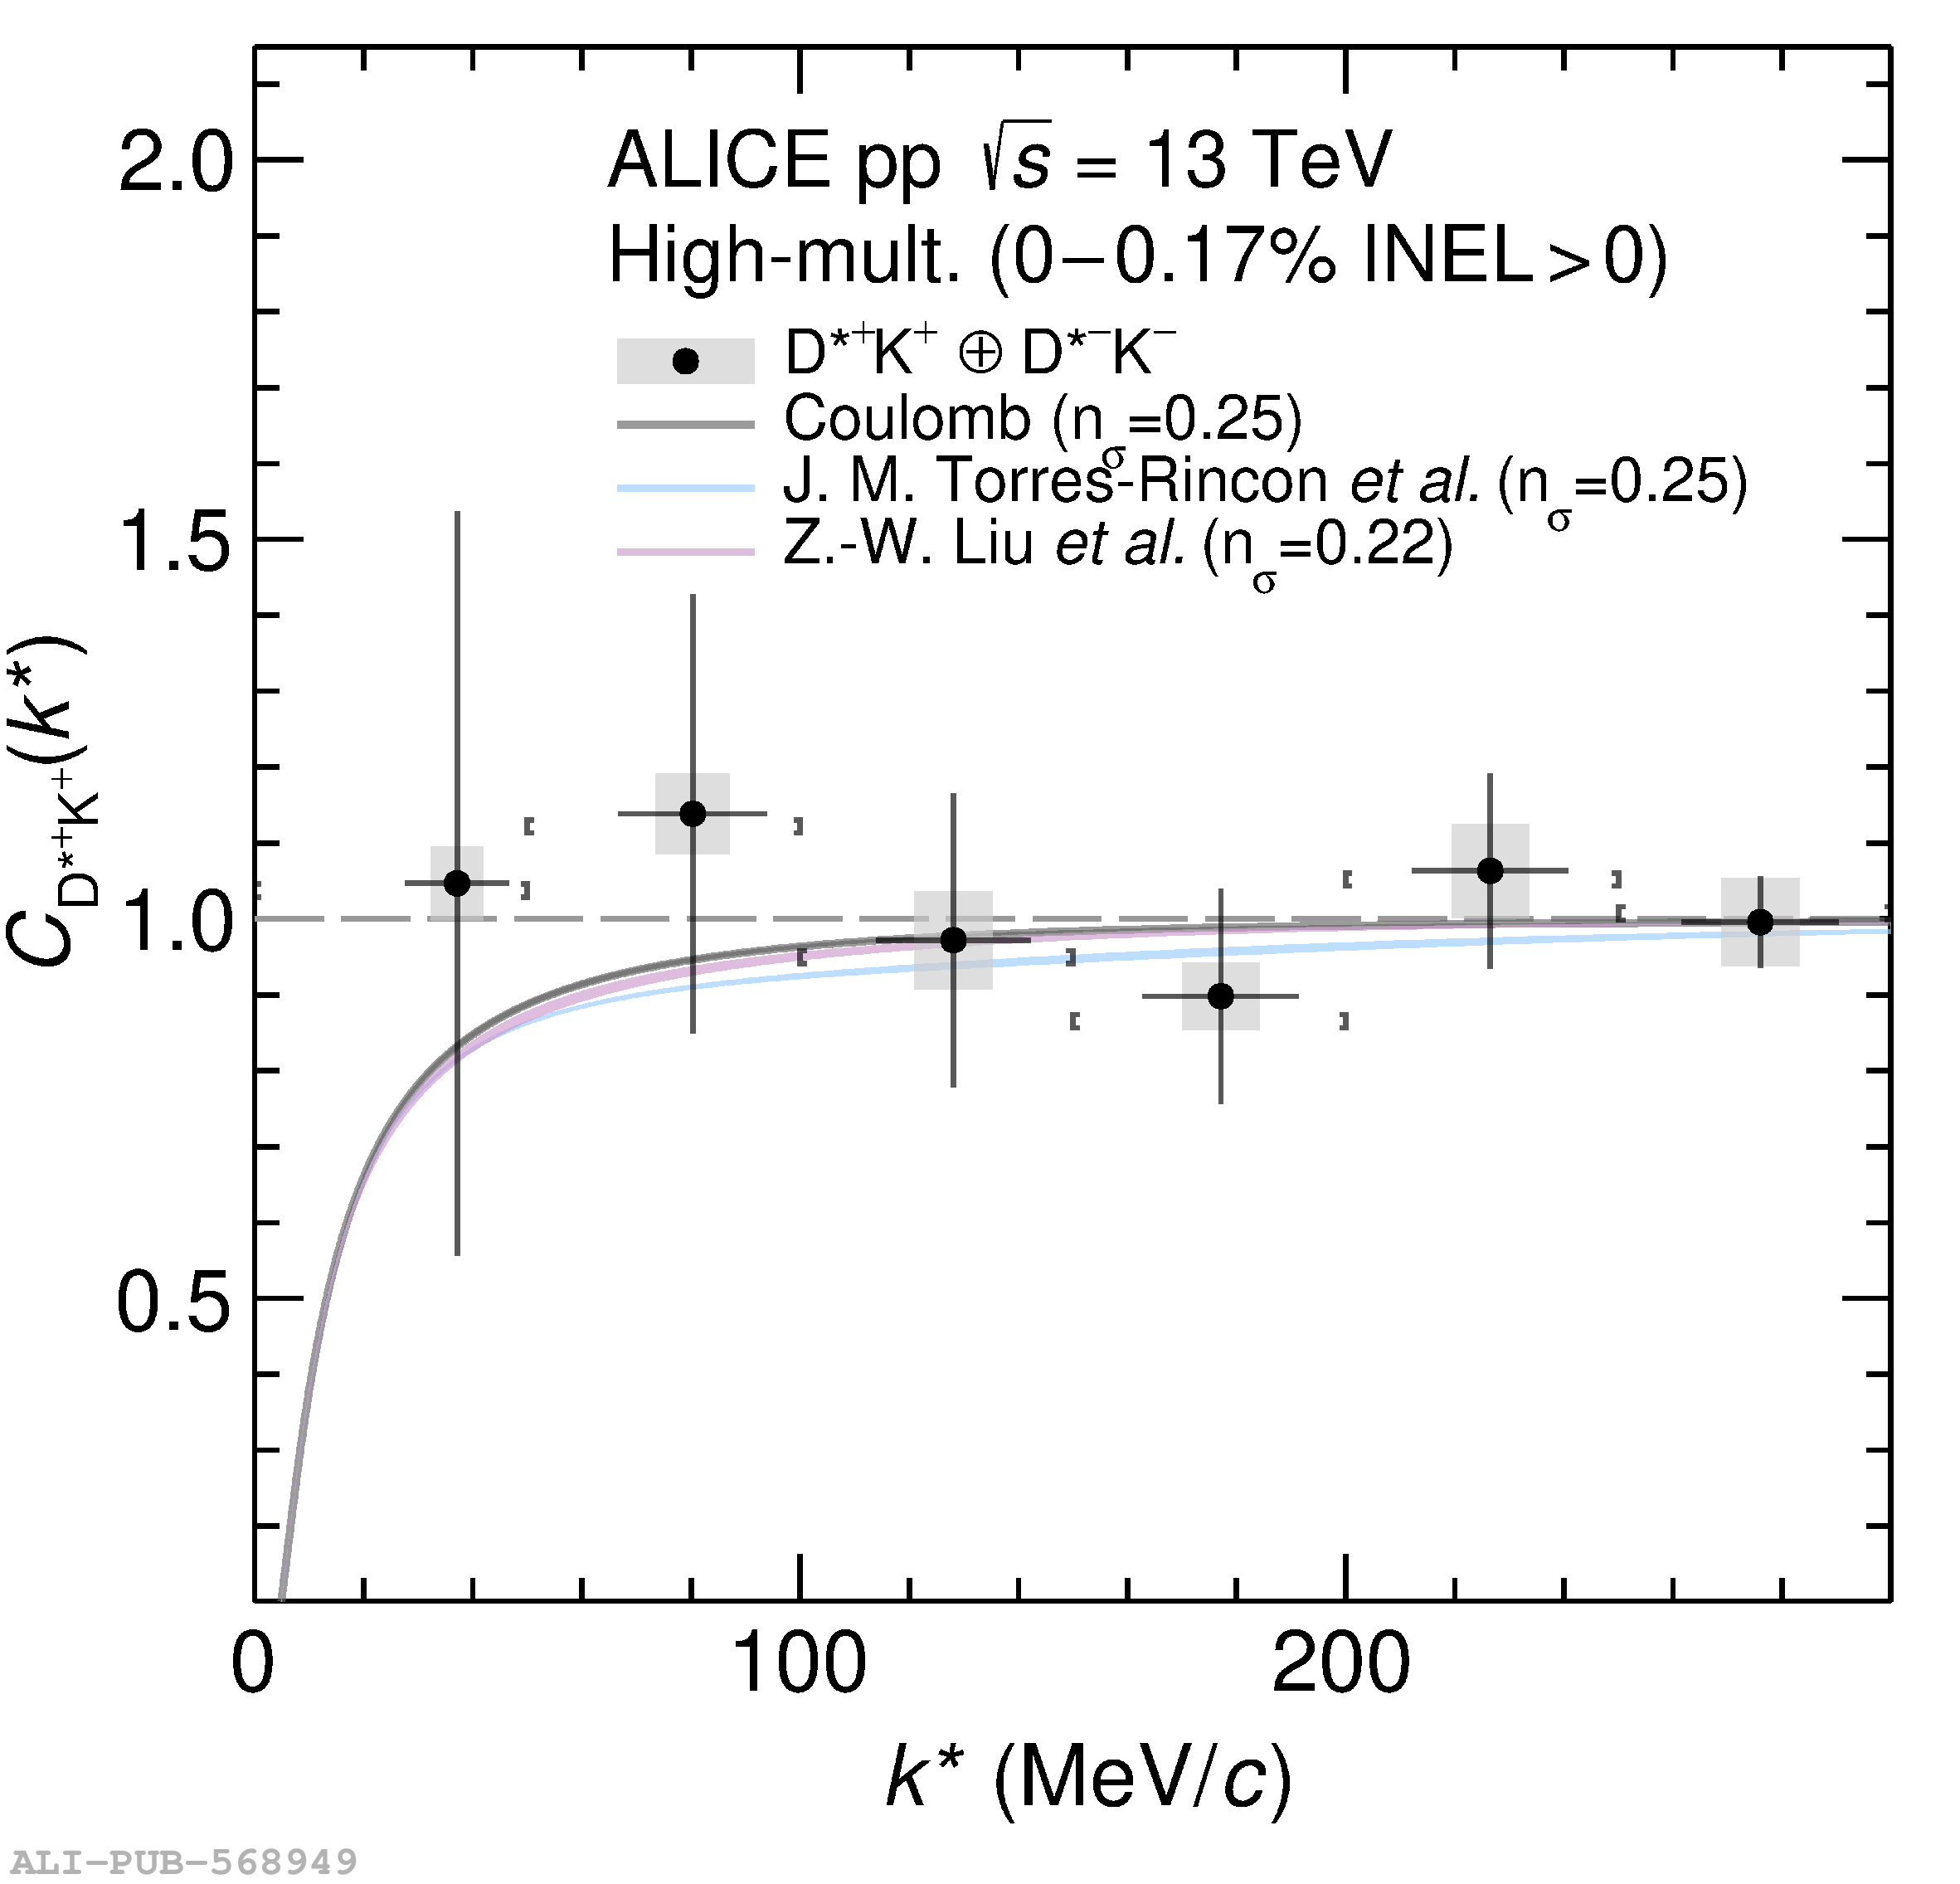 |