The two-particle momentum correlation functions between charm mesons ($\mathrm{D^{*\pm}}$ and $\mathrm{D}^\pm$) and charged light-flavor mesons ($\pi^{\pm}$ and K$^{\pm}$) in all charge-combinations are measured for the first time by the ALICE Collaboration in high-multiplicity proton-proton collisions at a center-of-mass energy of $\sqrt{s} =13$ TeV. For $\mathrm{DK}$ and $\mathrm{D^*K}$ pairs, the experimental results are in agreement with theoretical predictions of the residual strong interaction based on quantum chromodynamics calculations on the lattice and chiral effective field theory. In the case of $\mathrm{D}\pi$ and $\mathrm{D^*}\pi$ pairs, tension between the calculations including strong interactions and the measurement is observed. For all particle pairs, the data can be adequately described by Coulomb interaction only, indicating a shallow interaction between charm and light-flavor mesons. Finally, the scattering lengths governing the residual strong interaction of the $\mathrm{D}\pi$ and $\mathrm{D^*}\pi$ systems are determined by fitting the experimental correlation functions with a model that employs a Gaussian potential. The extracted values are small and compatible with zero.
Phys. Rev. D 110, 032004 (2024)
HEP Data
e-Print: arXiv:2401.13541 | PDF | inSPIRE
CERN-EP-2024-013
Figure group
Figure 1
Left: distribution of invariant-mass difference for ${\rm D^{*+}}$ candidates in the $2.2< \pt< 2.4$ $\mathrm{GeV/c}$ interval. The green solid line shows the total fit function and the gray dotted line the combinatorial background. The contributions of ${\rm D^{*+}}$ mesons originating from charm hadronization and beauty-hadron decays are obtained with the method relying on the definition of different selection criteria, as explained in the text. Right: example of raw-yield distribution as a function of the BDT-based selection for the $2.2< \pt< 2.4$ $\mathrm{GeV/c}$ interval, employed in the procedure adopted for the determination of the fraction of ${\rm D^{*+}}$ originating from beauty-hadron decays. | 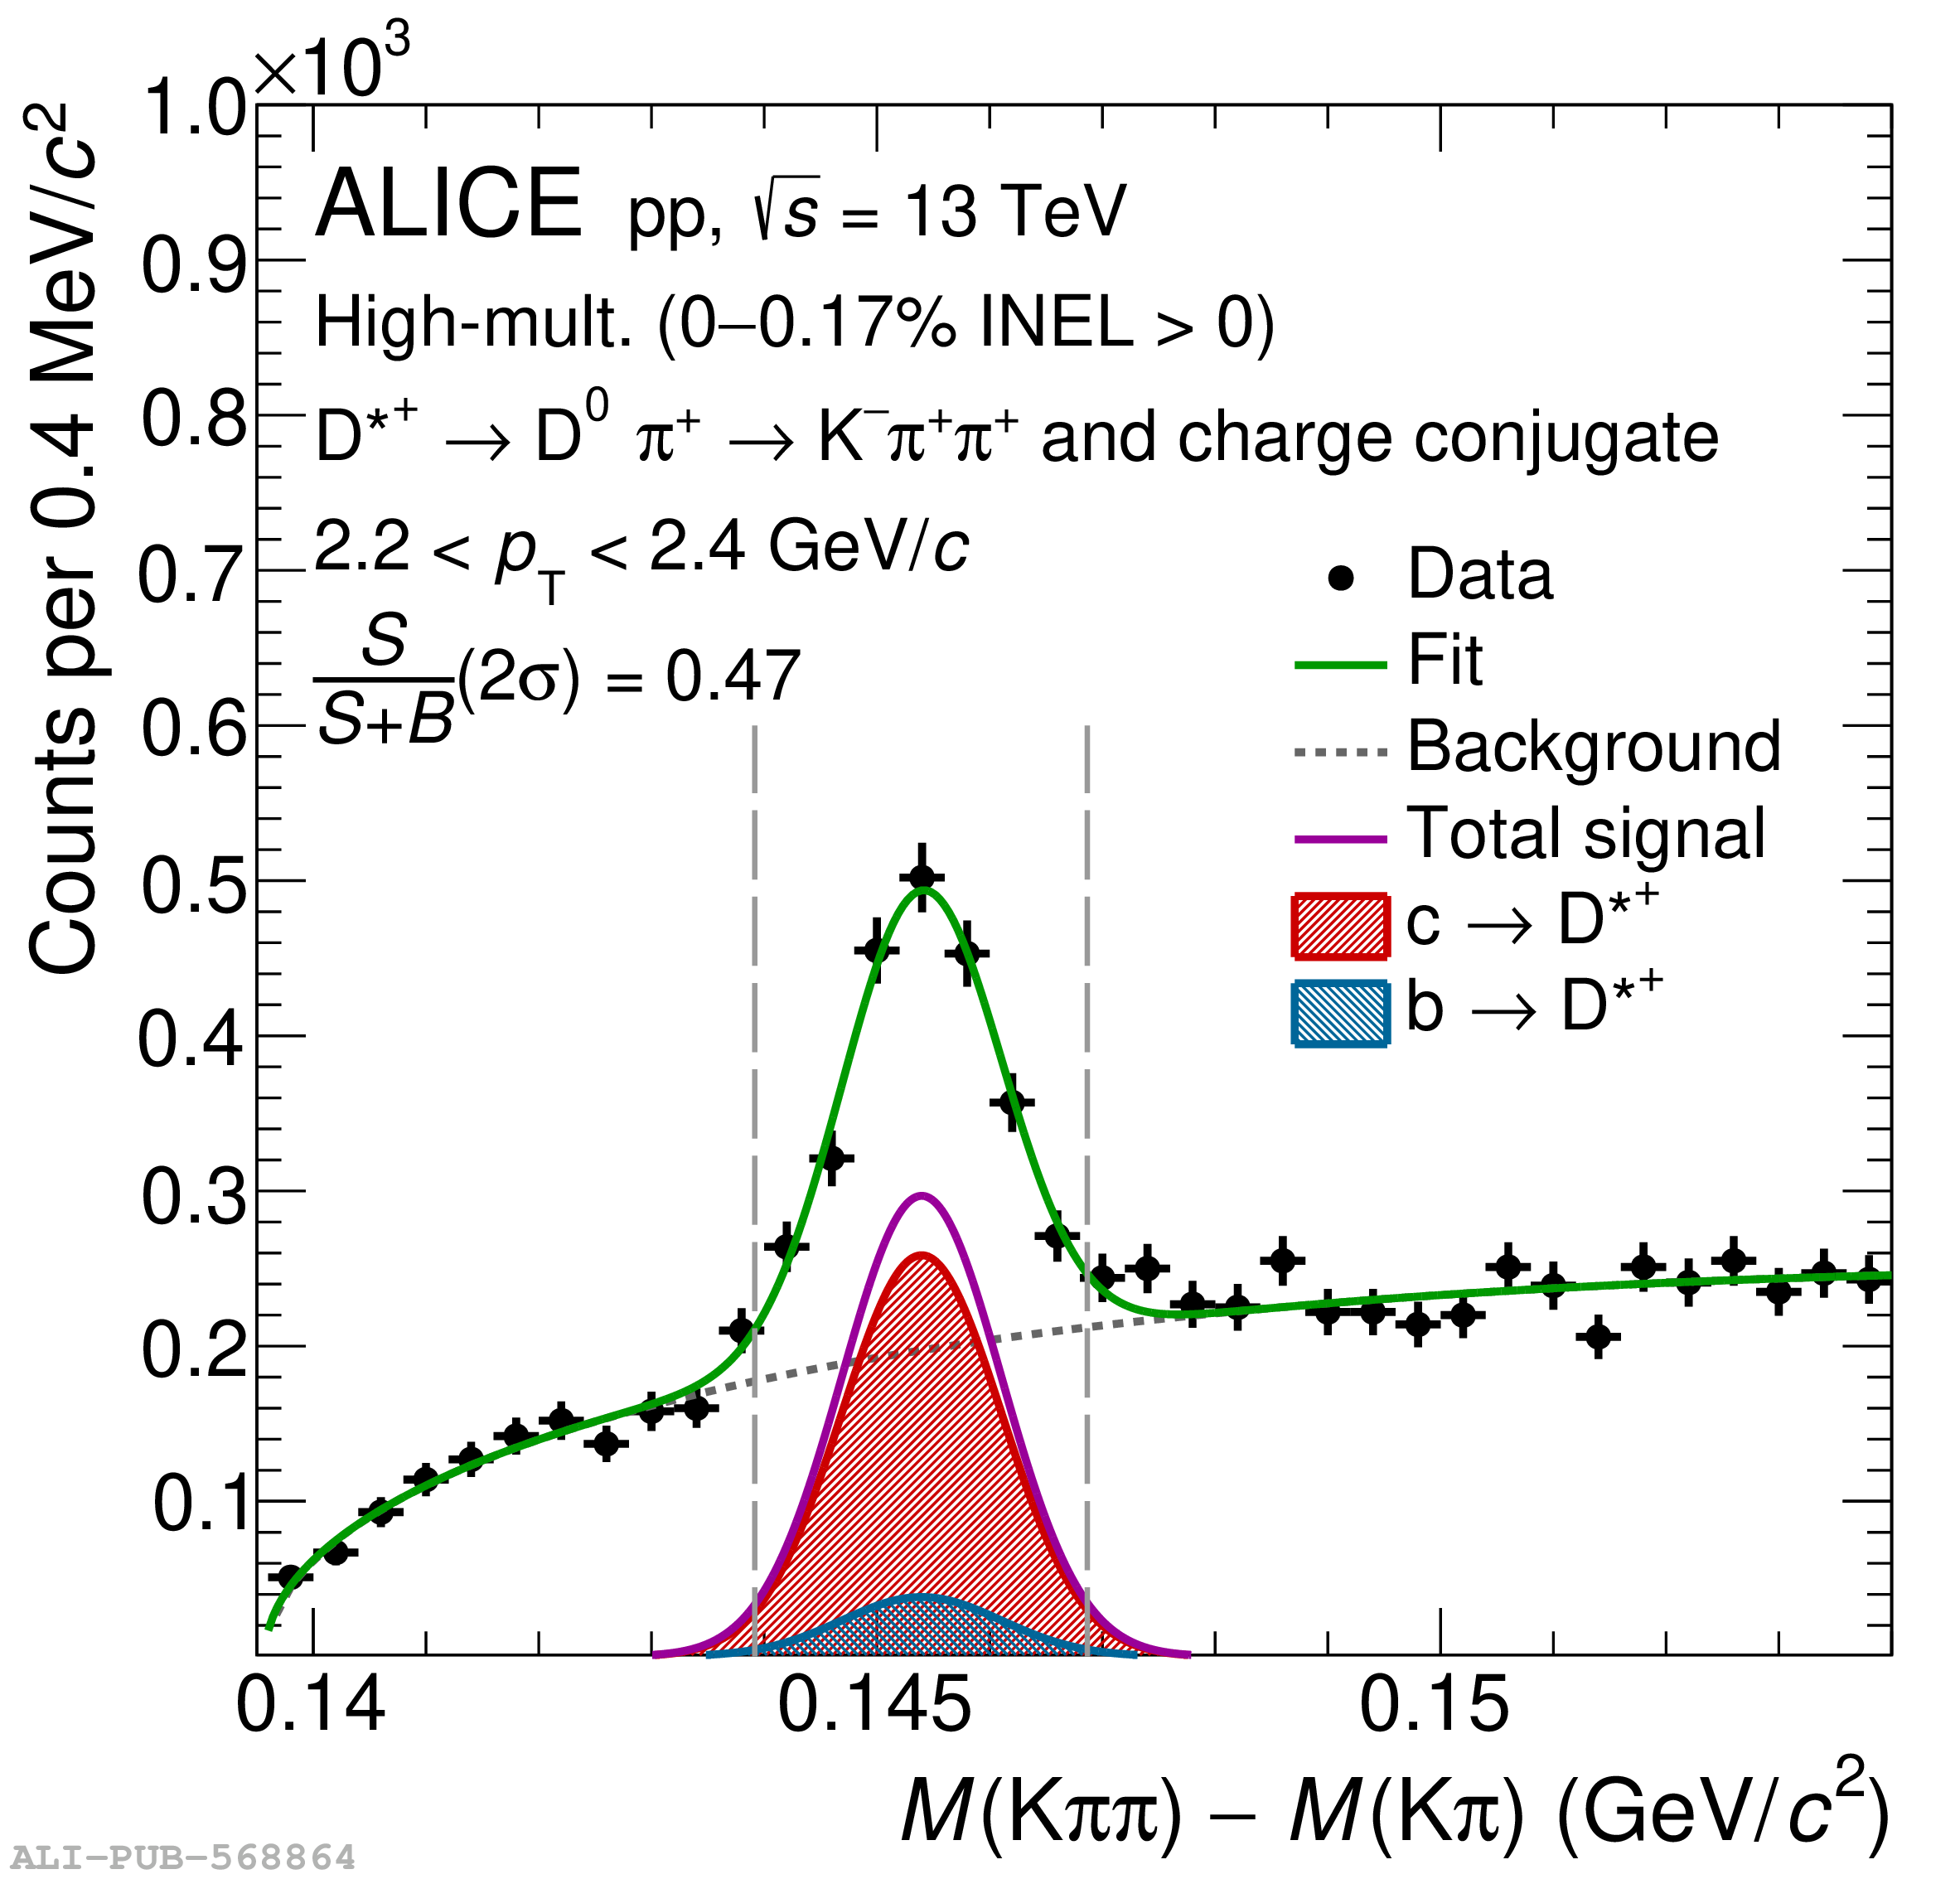 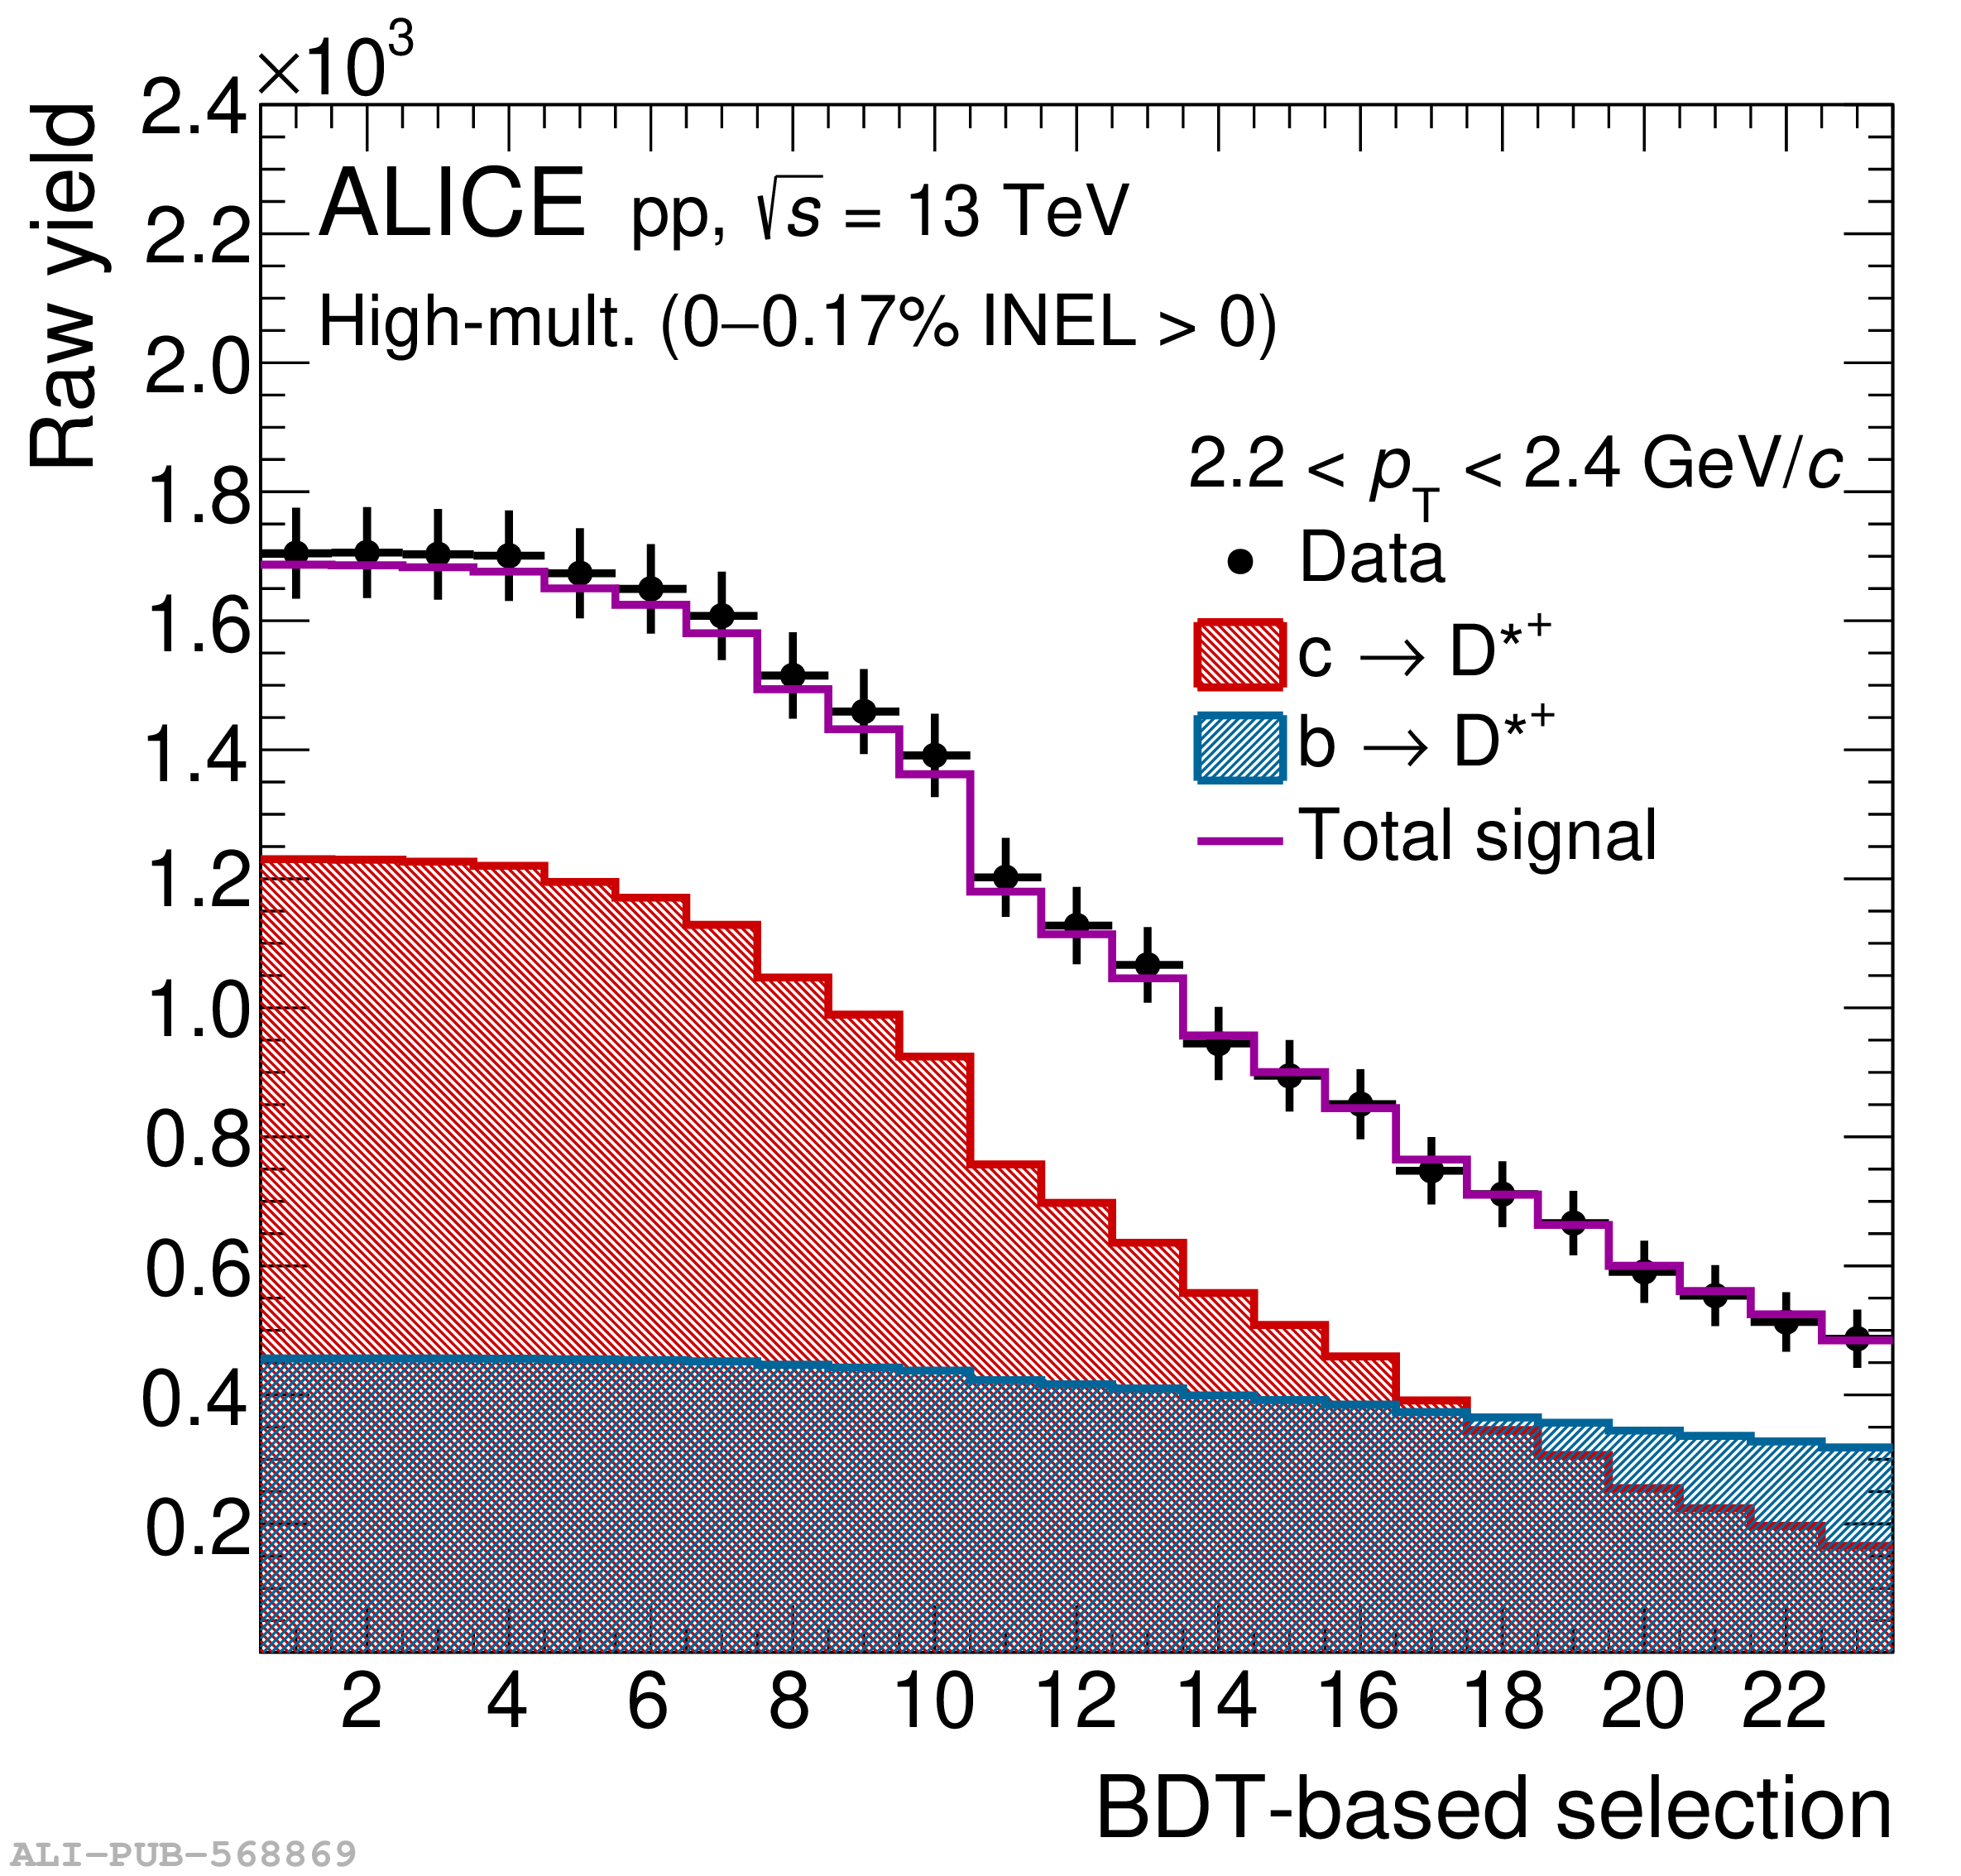 |
Figure 2
Experimental $\mathrm{D}\pi$raw correlation functions ($C_\mathrm{raw}(k^*)$) with statistical (bars) and systematic uncertainties (boxes) (left column), and background contributions to the experimental correlation functions (right column). The width of the bands corresponds to the total uncertainty $\sigma_\mathrm{tot}=\sqrt{\sigma_\mathrm{stat}^2+\sigma_\mathrm{syst}^2}$. The violet band describes the total background, fitted to the data, and used to extract the genuine correlation function from the raw signal. This band consists of several contributions, which are also shown individually in the figure, scaled by the appropriate $\lambda$ parameter. The results are shown for opposite-charge (first row) and same-charge (second row) pairs. | 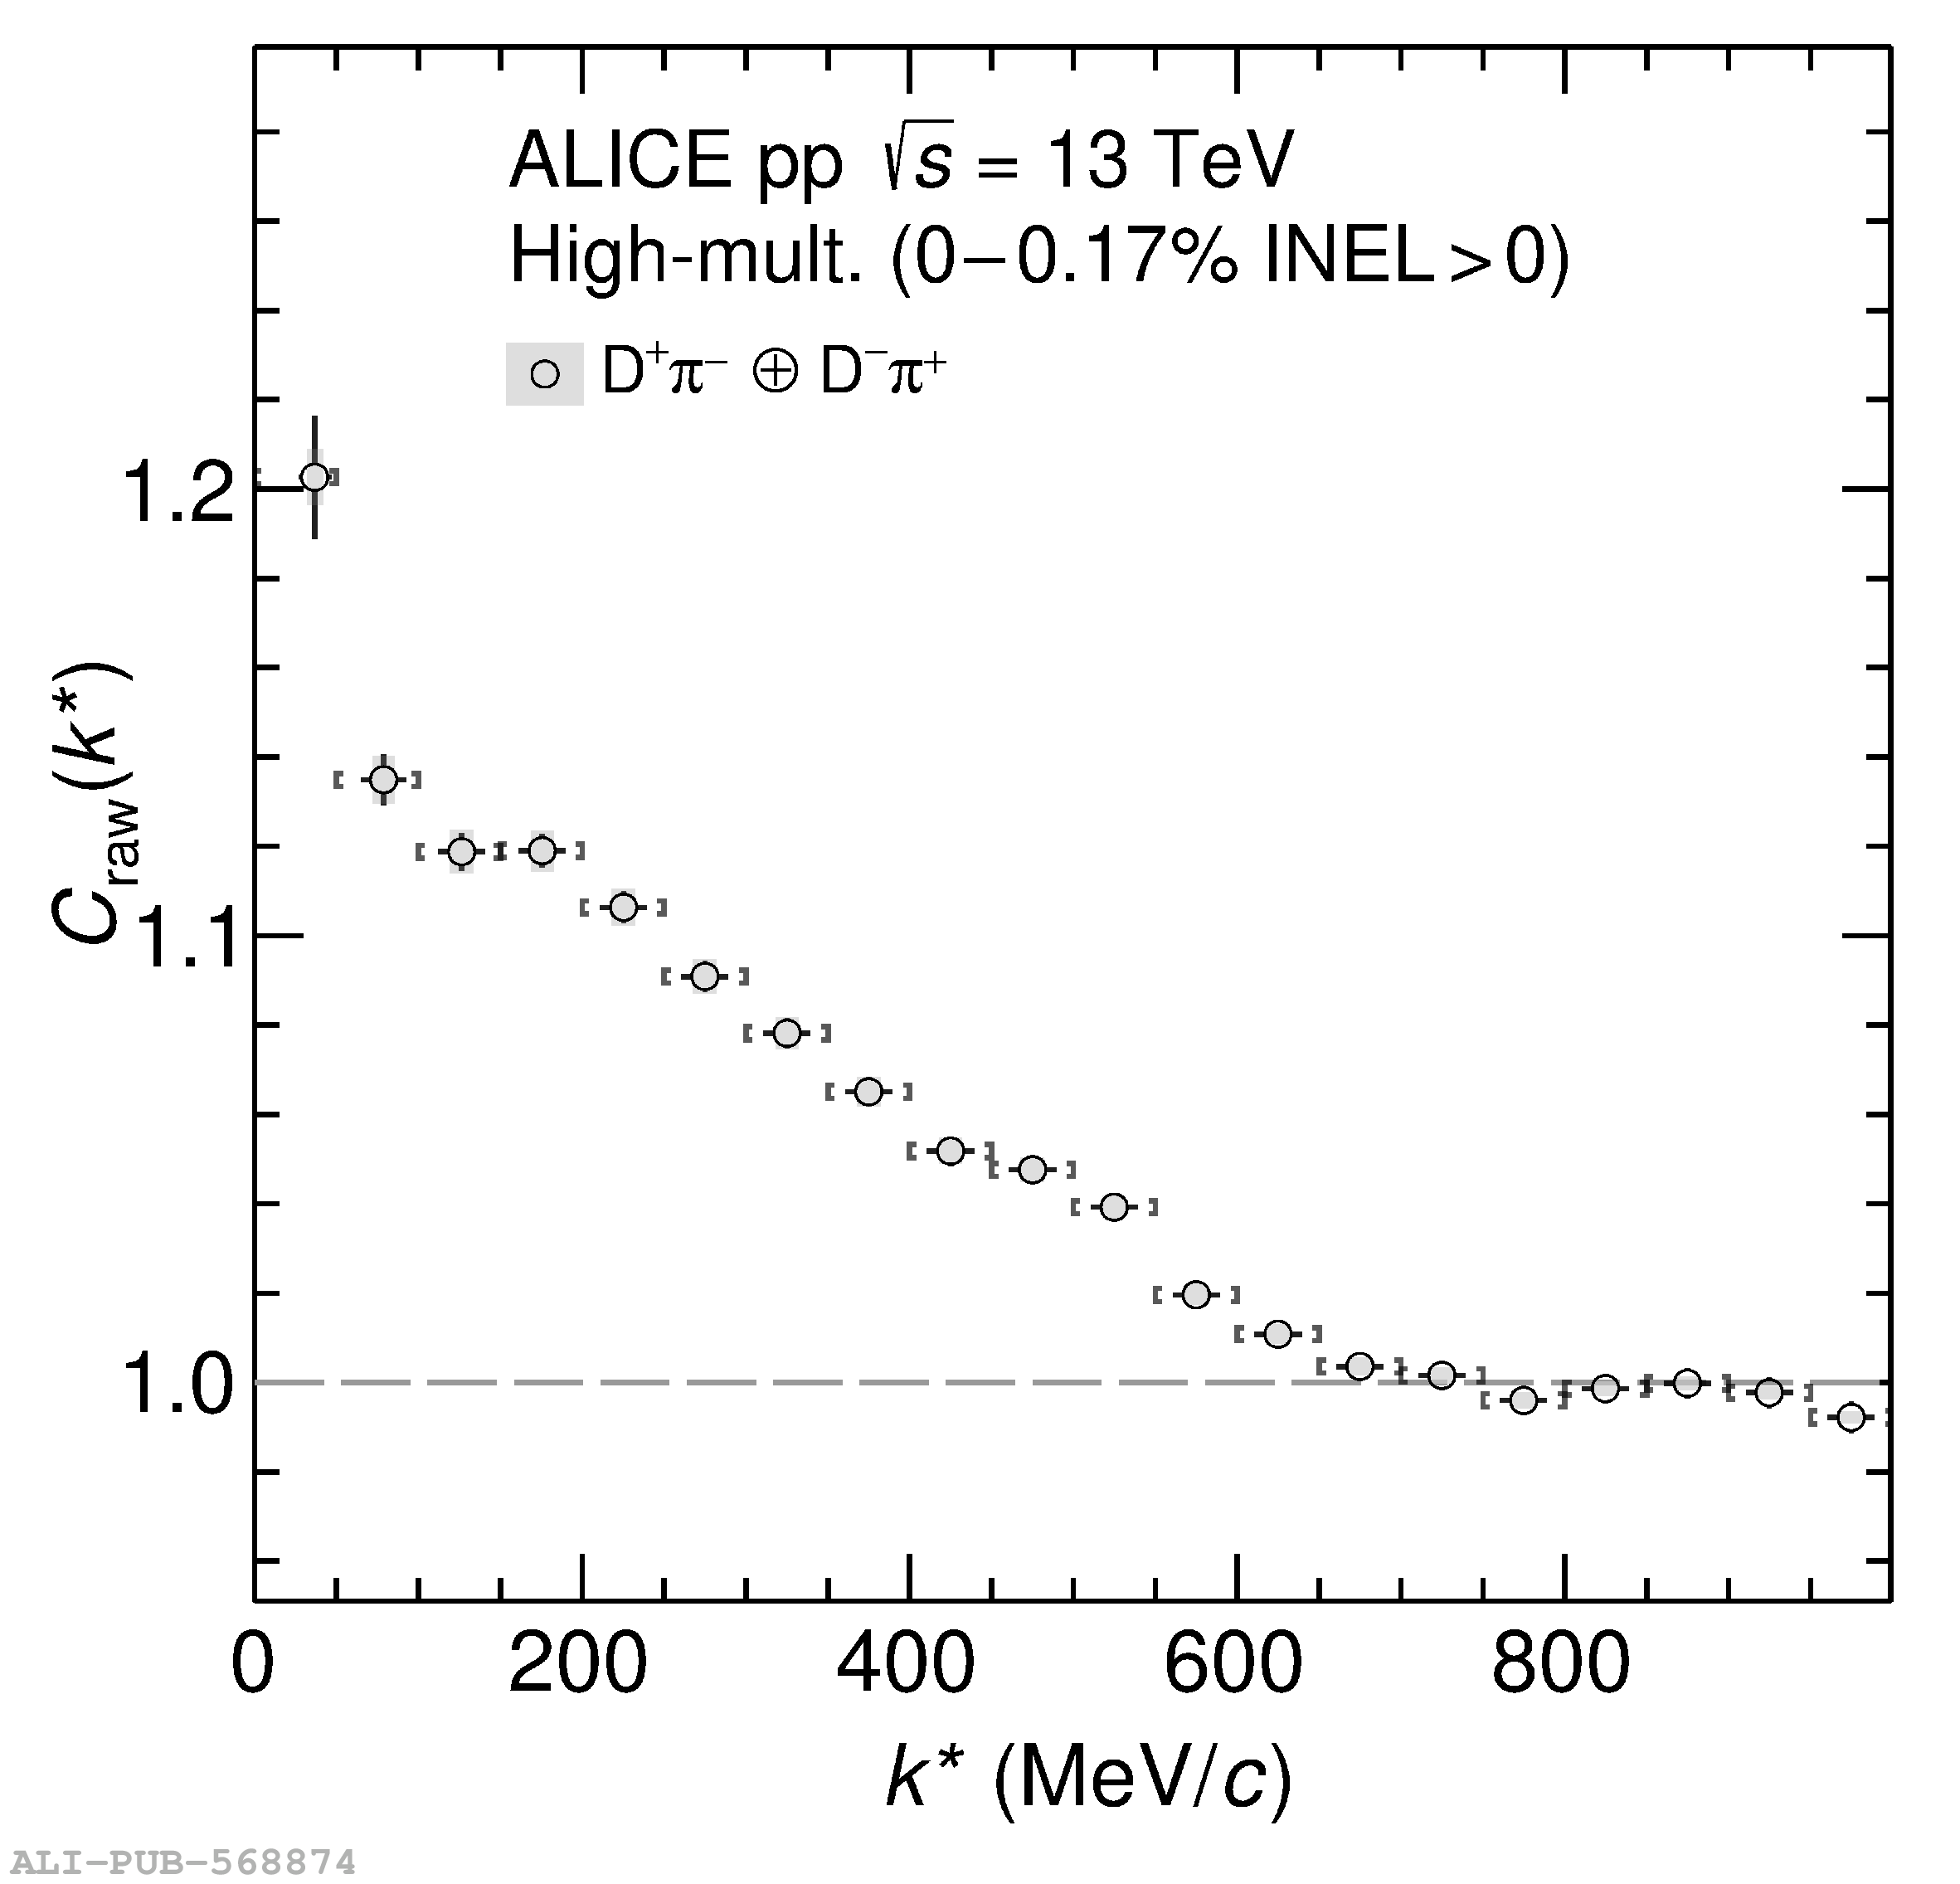 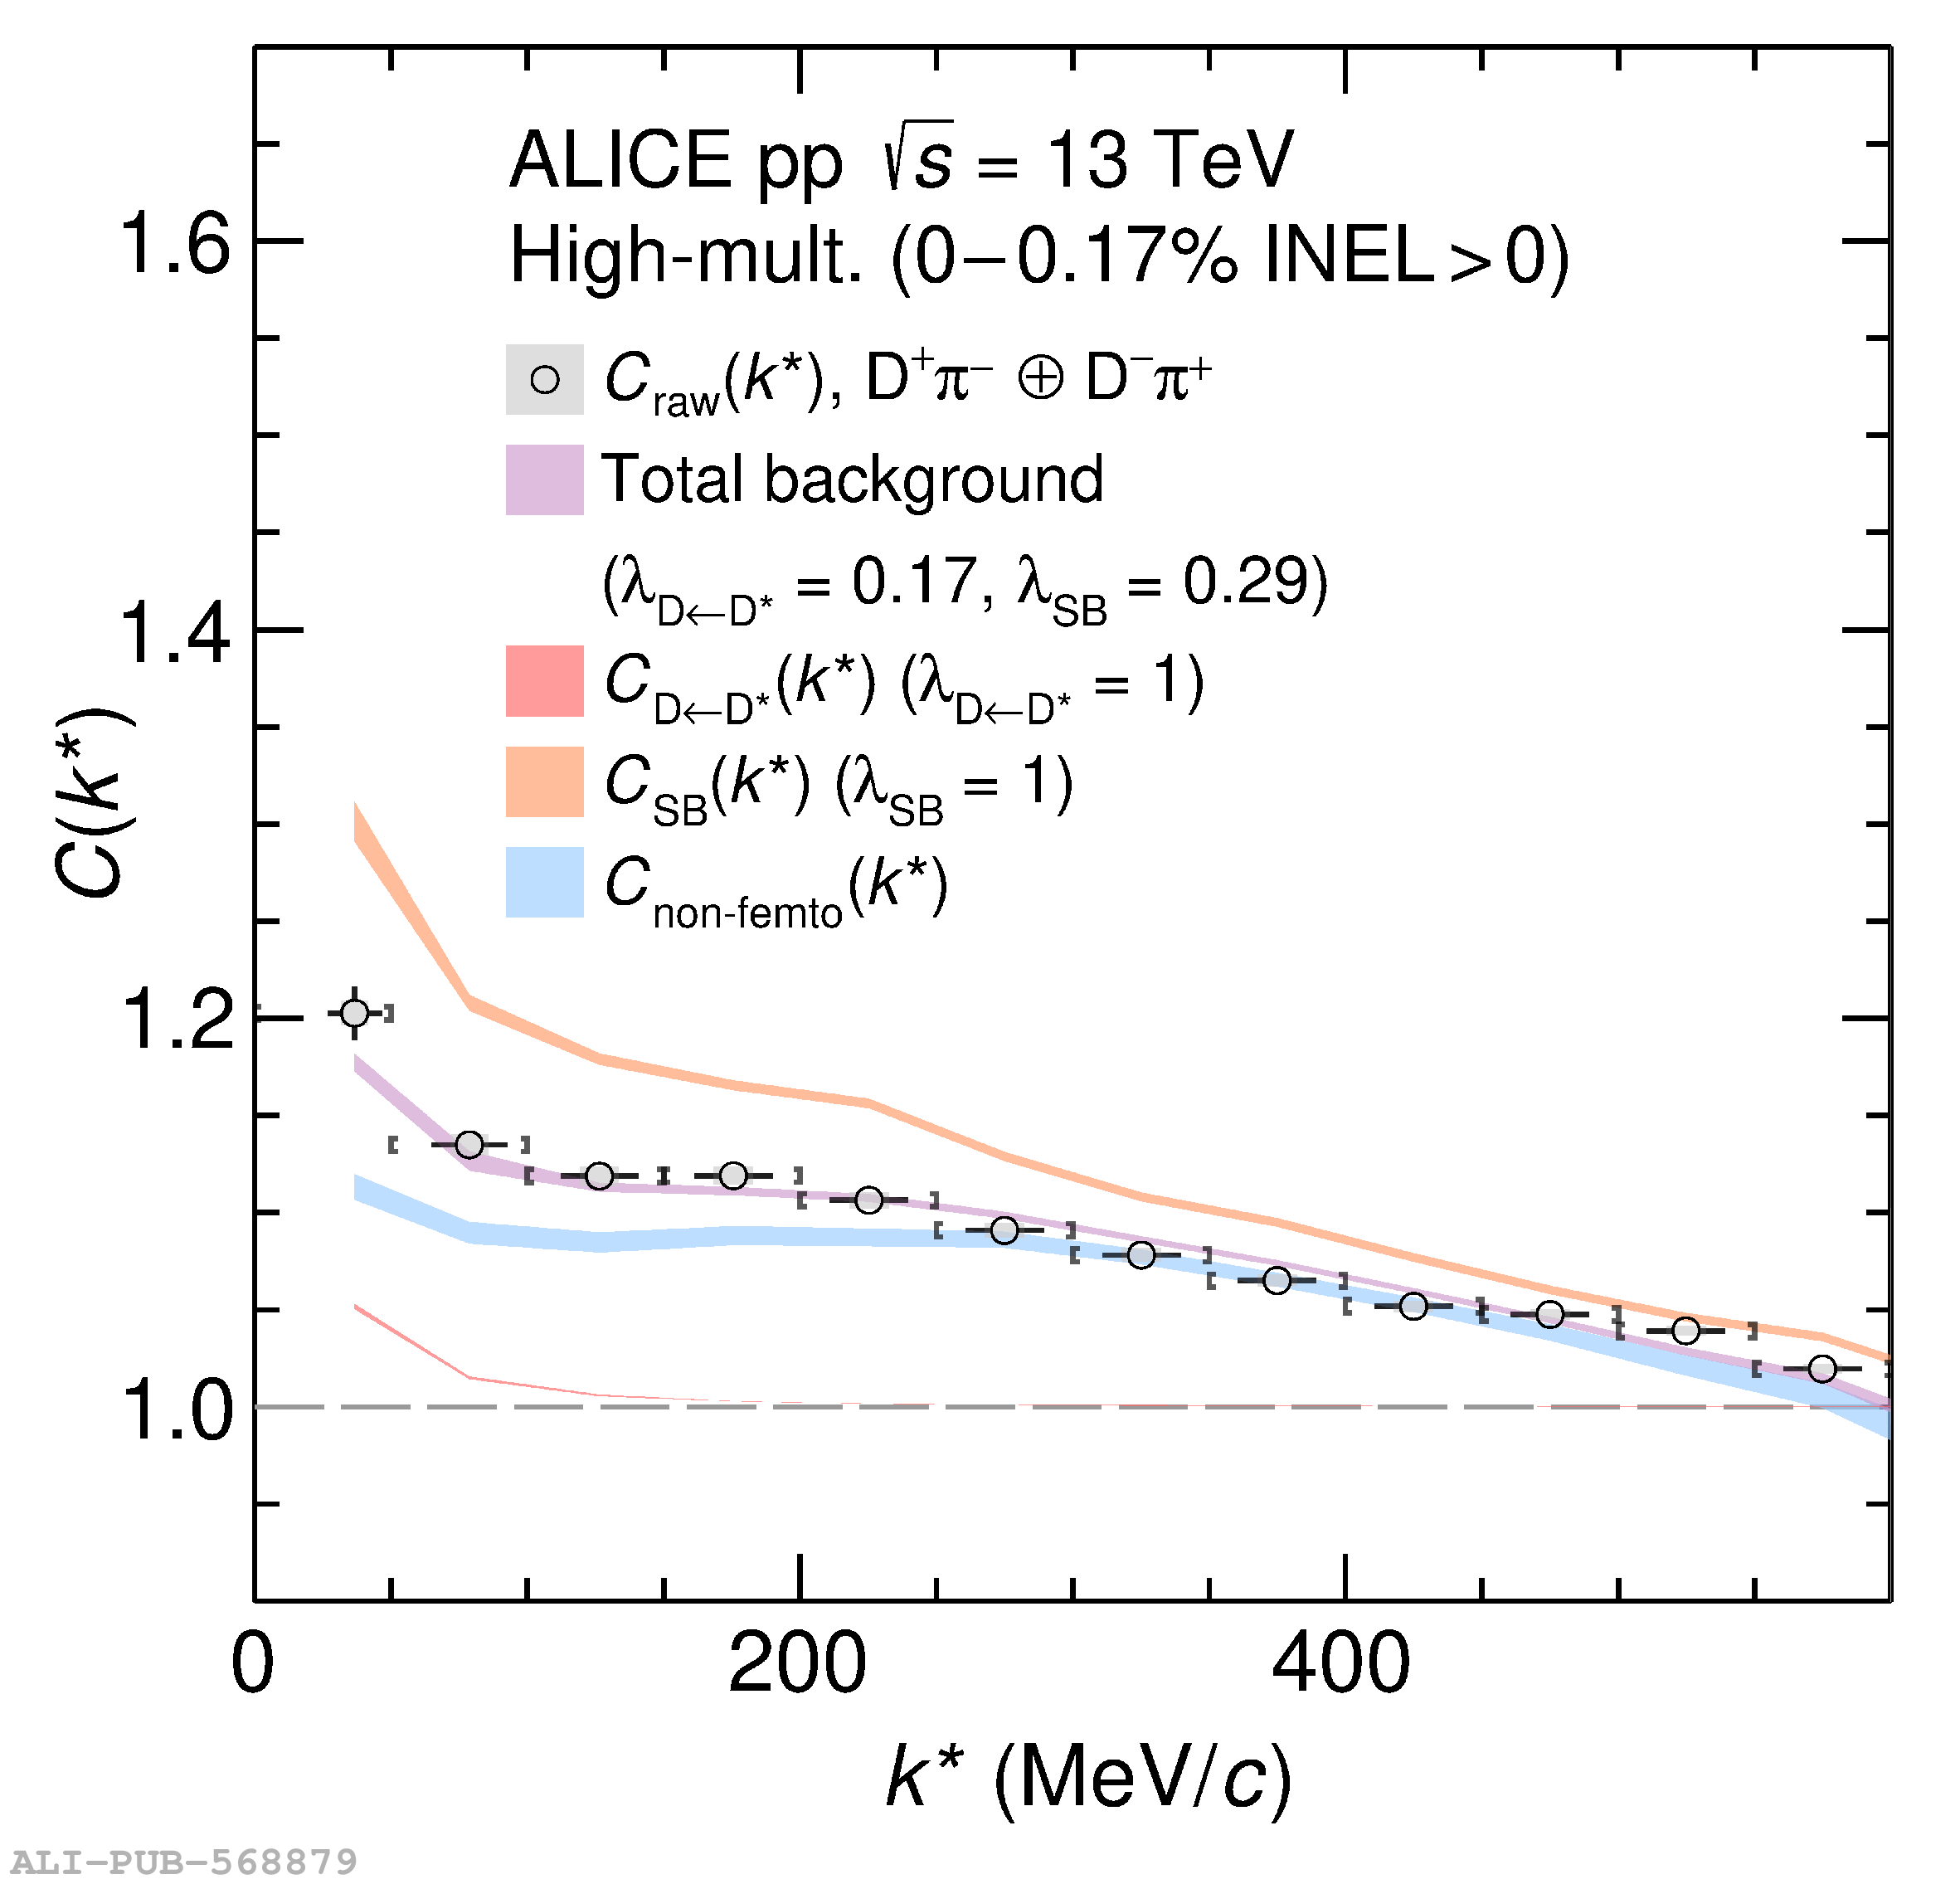 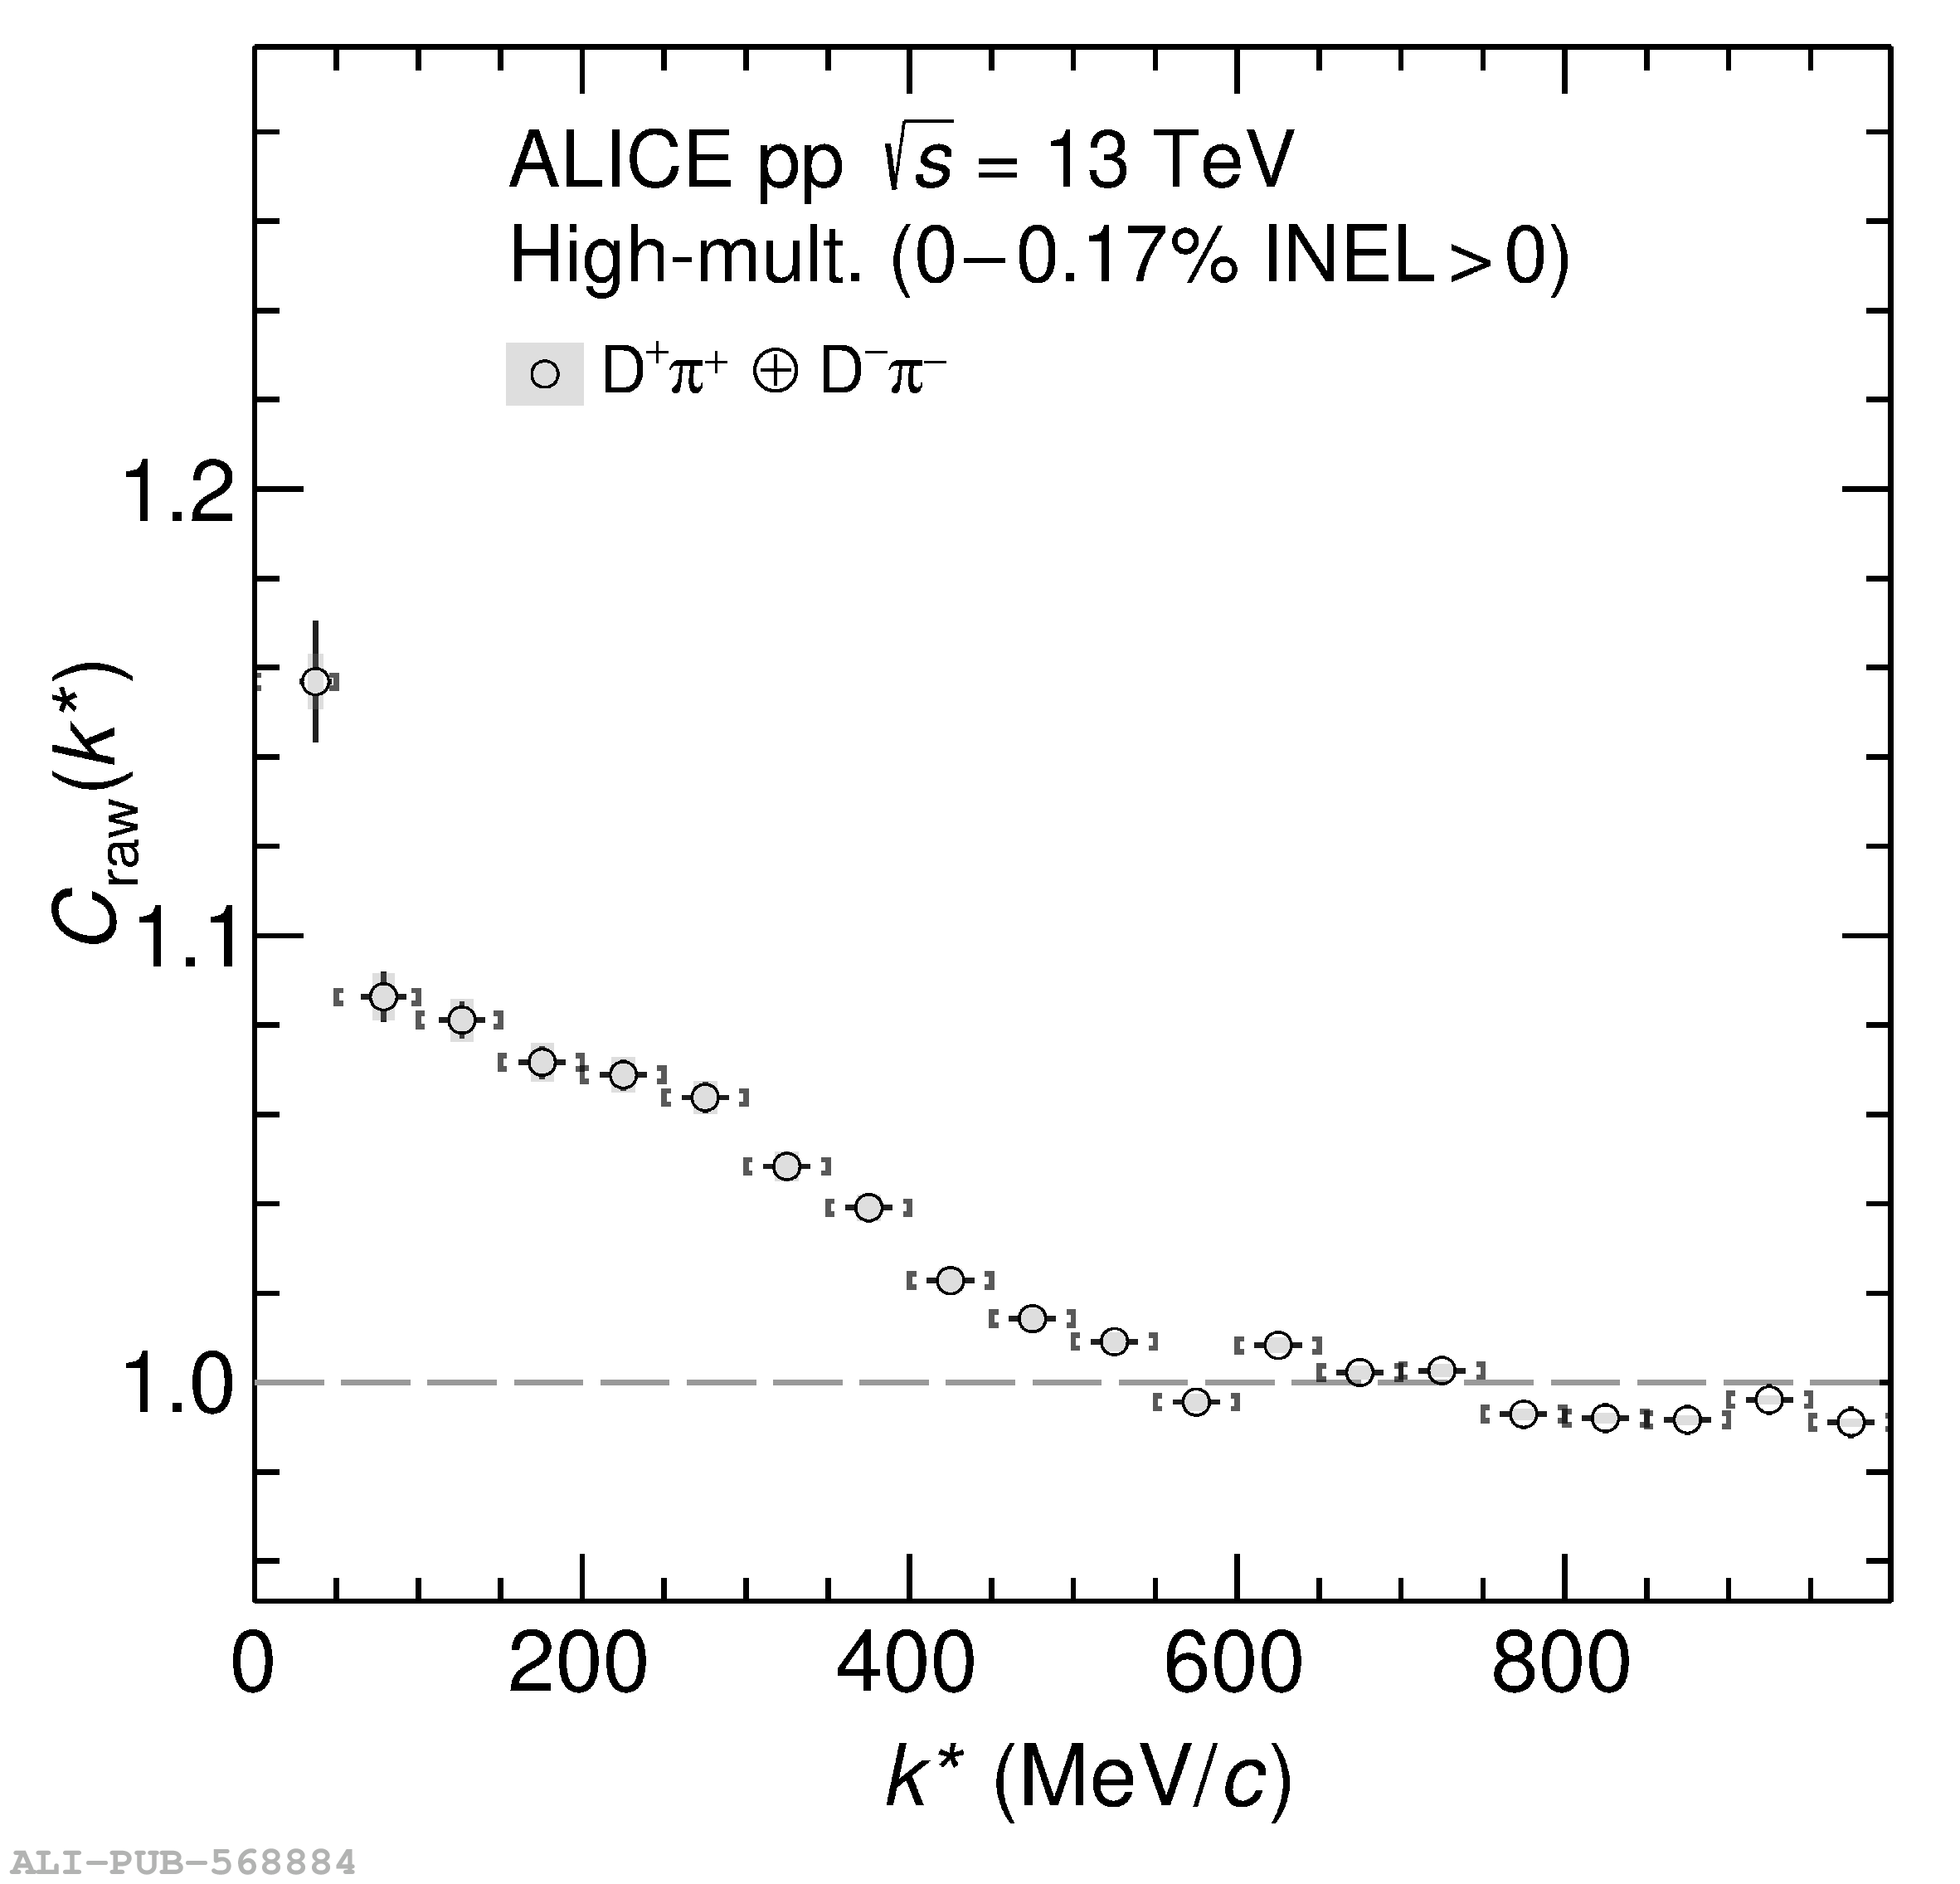 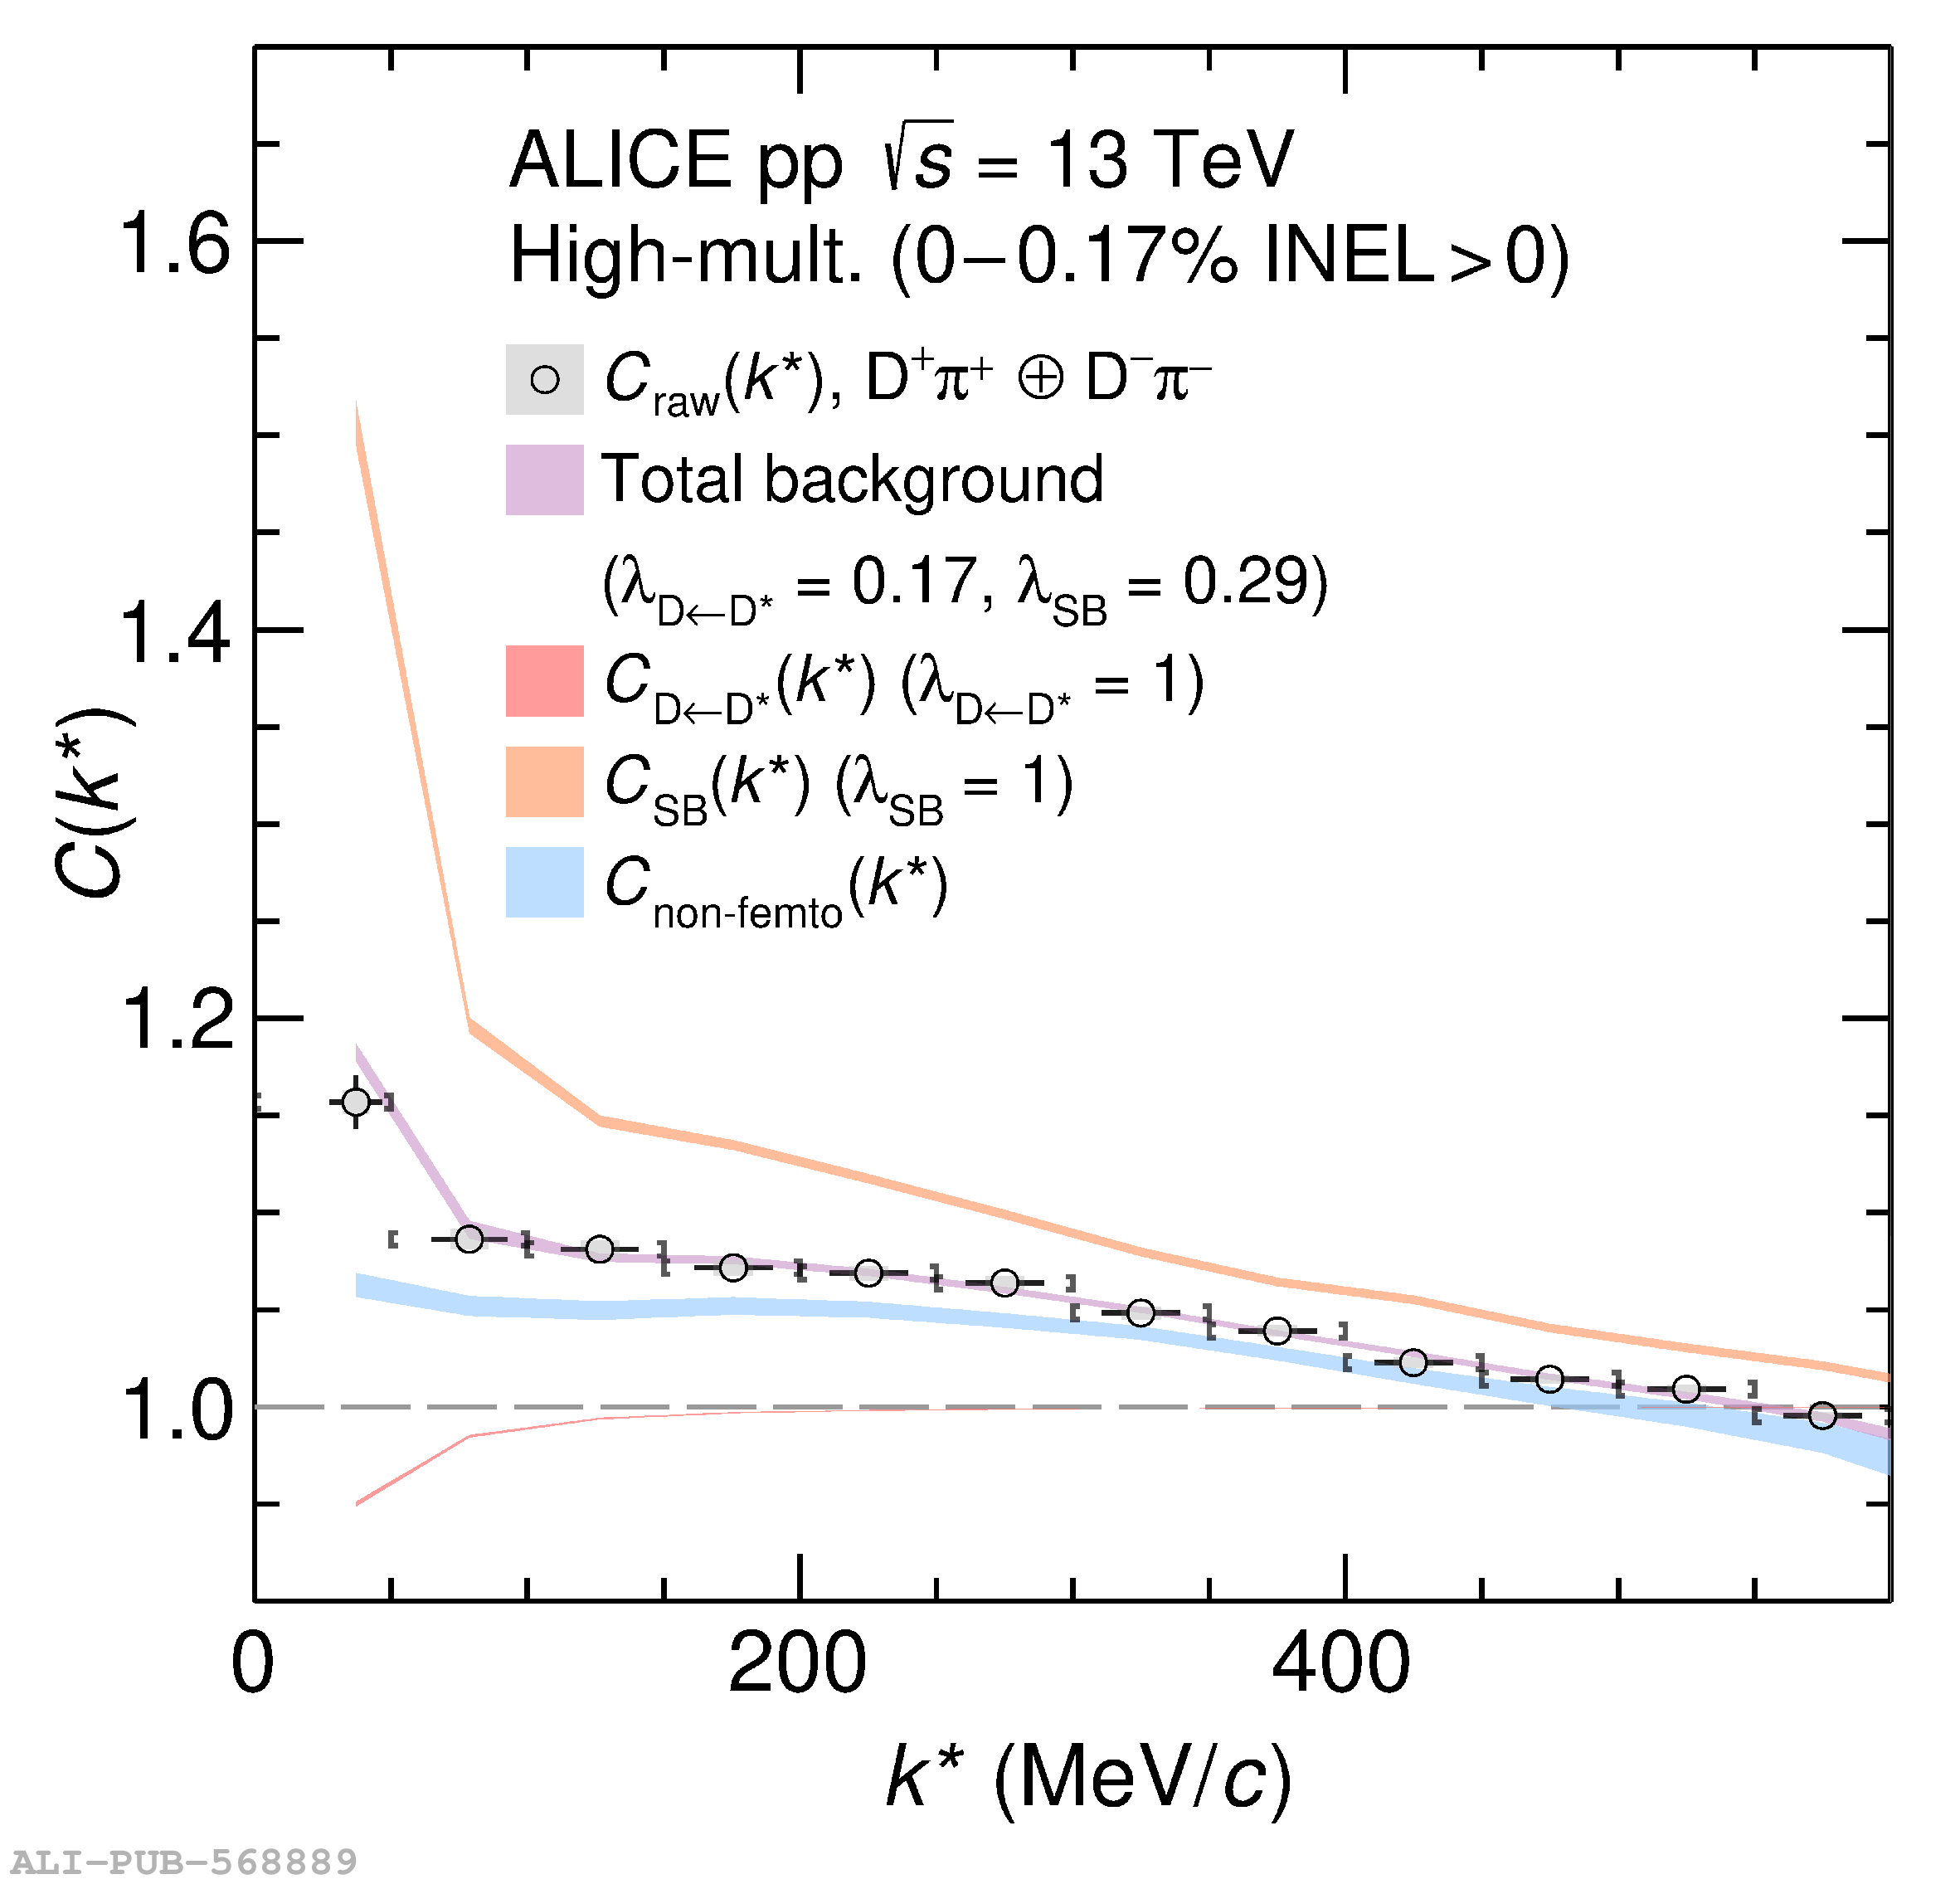 |
Figure 3
Experimental $\mathrm{DK}$ raw correlation functions ($C_\mathrm{raw}(k^*)$) with statistical (bars) and systematic uncertainties (boxes) (left column), and background contributions to the experimental correlation functions (right column). The width of the bands corresponds to the total uncertainty $\sigma_\mathrm{tot}=\sqrt{\sigma_\mathrm{stat}^2+\sigma_\mathrm{syst}^2}$. The violet band describes the total background, fitted to the data, and used to extract the genuine correlation function from the raw signal. This band consists of several contributions, which are also shown individually in the figure, scaled by the appropriate $\lambda$ parameter. The results are shown for opposite-charge (first row) and same-charge (second row) pairs. | 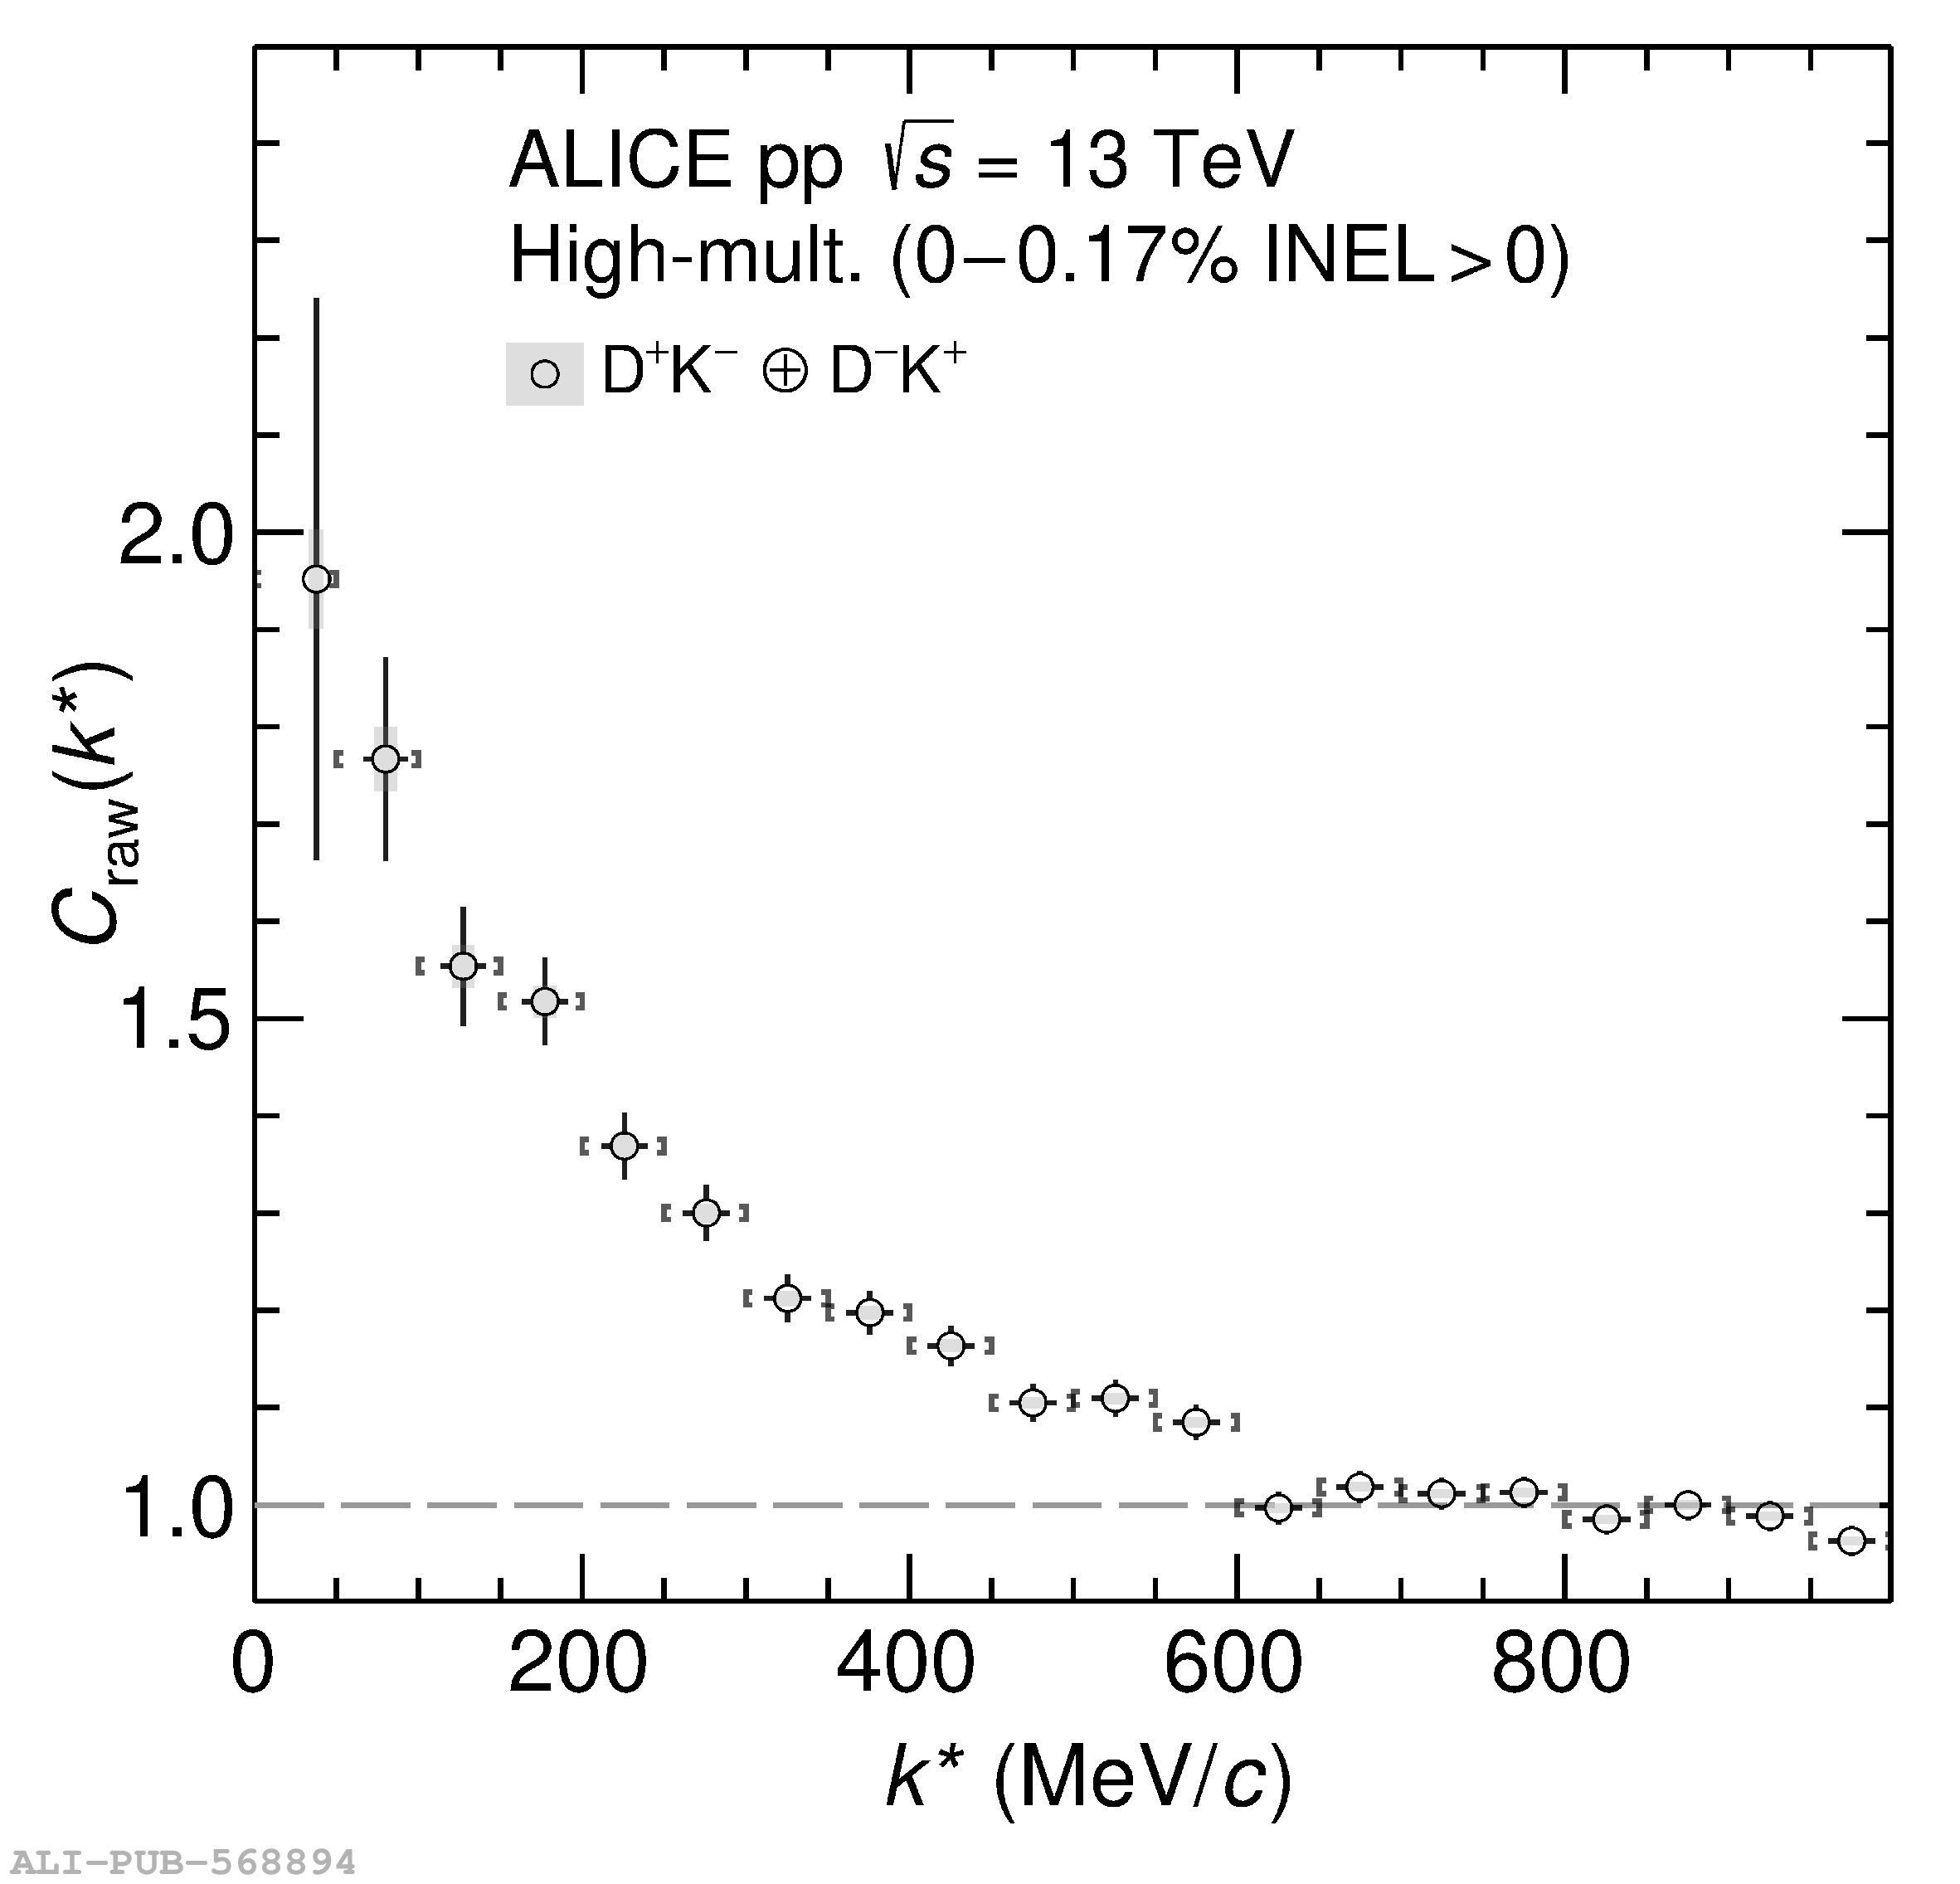 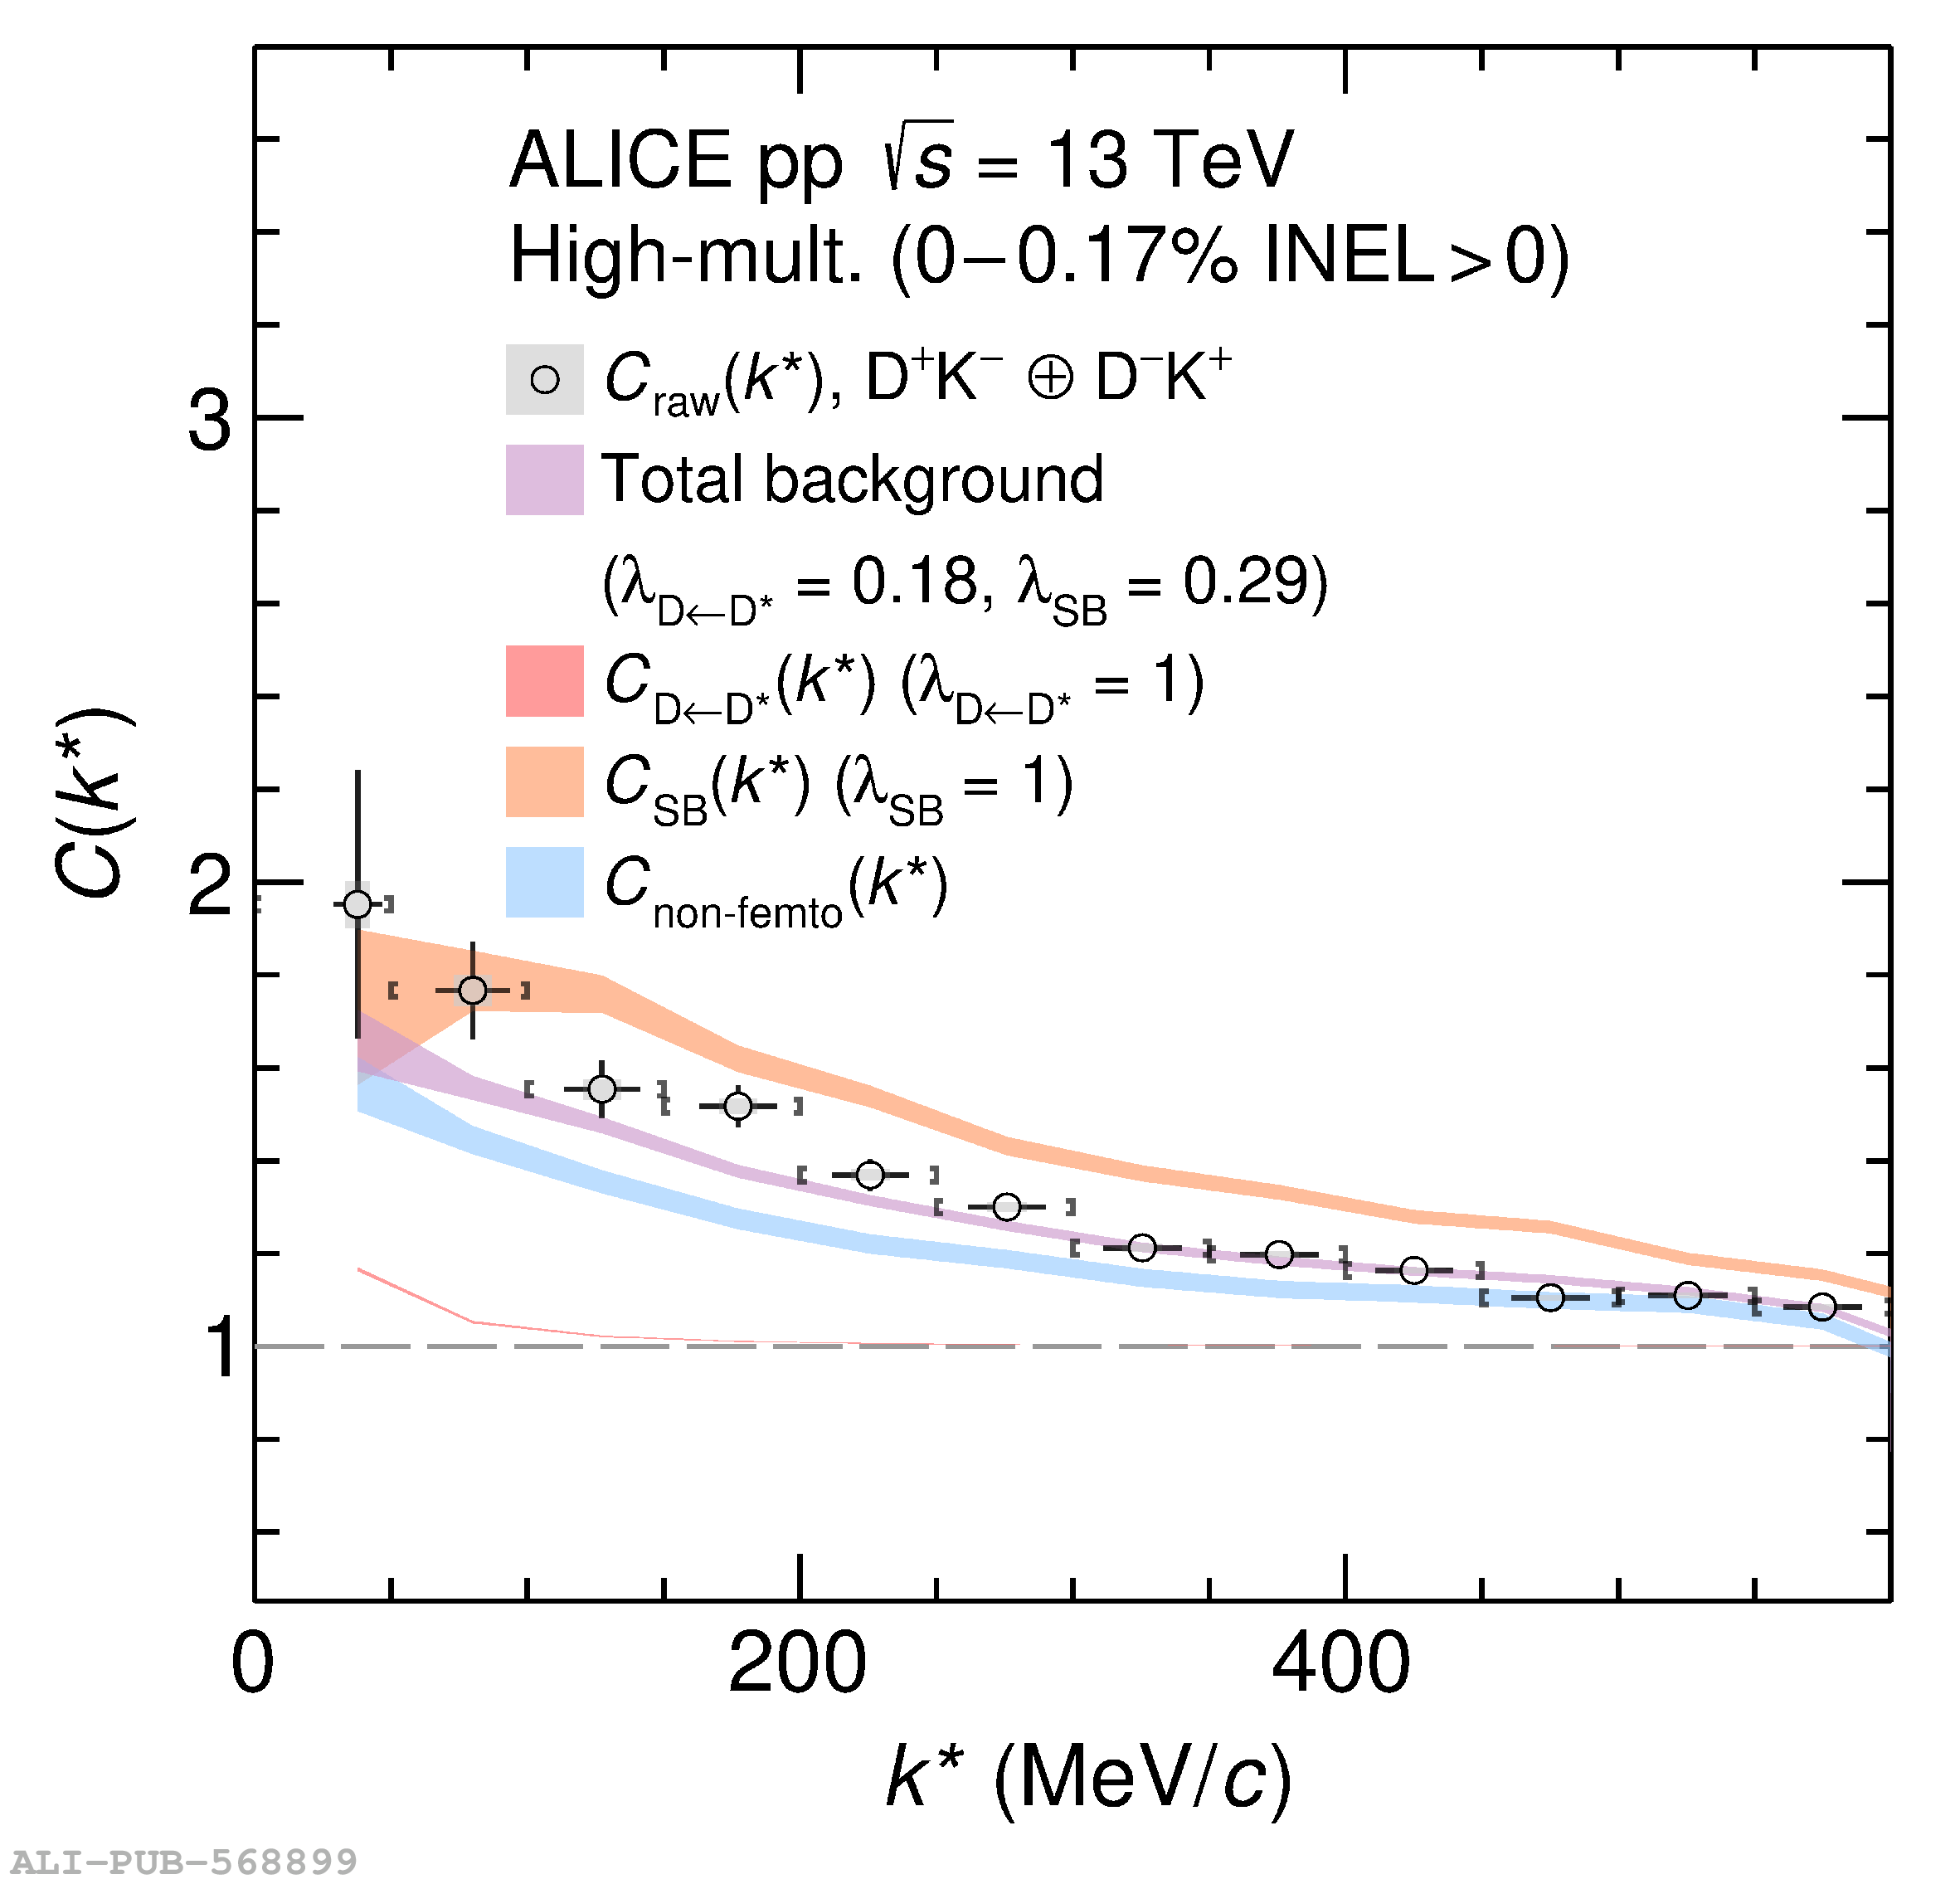 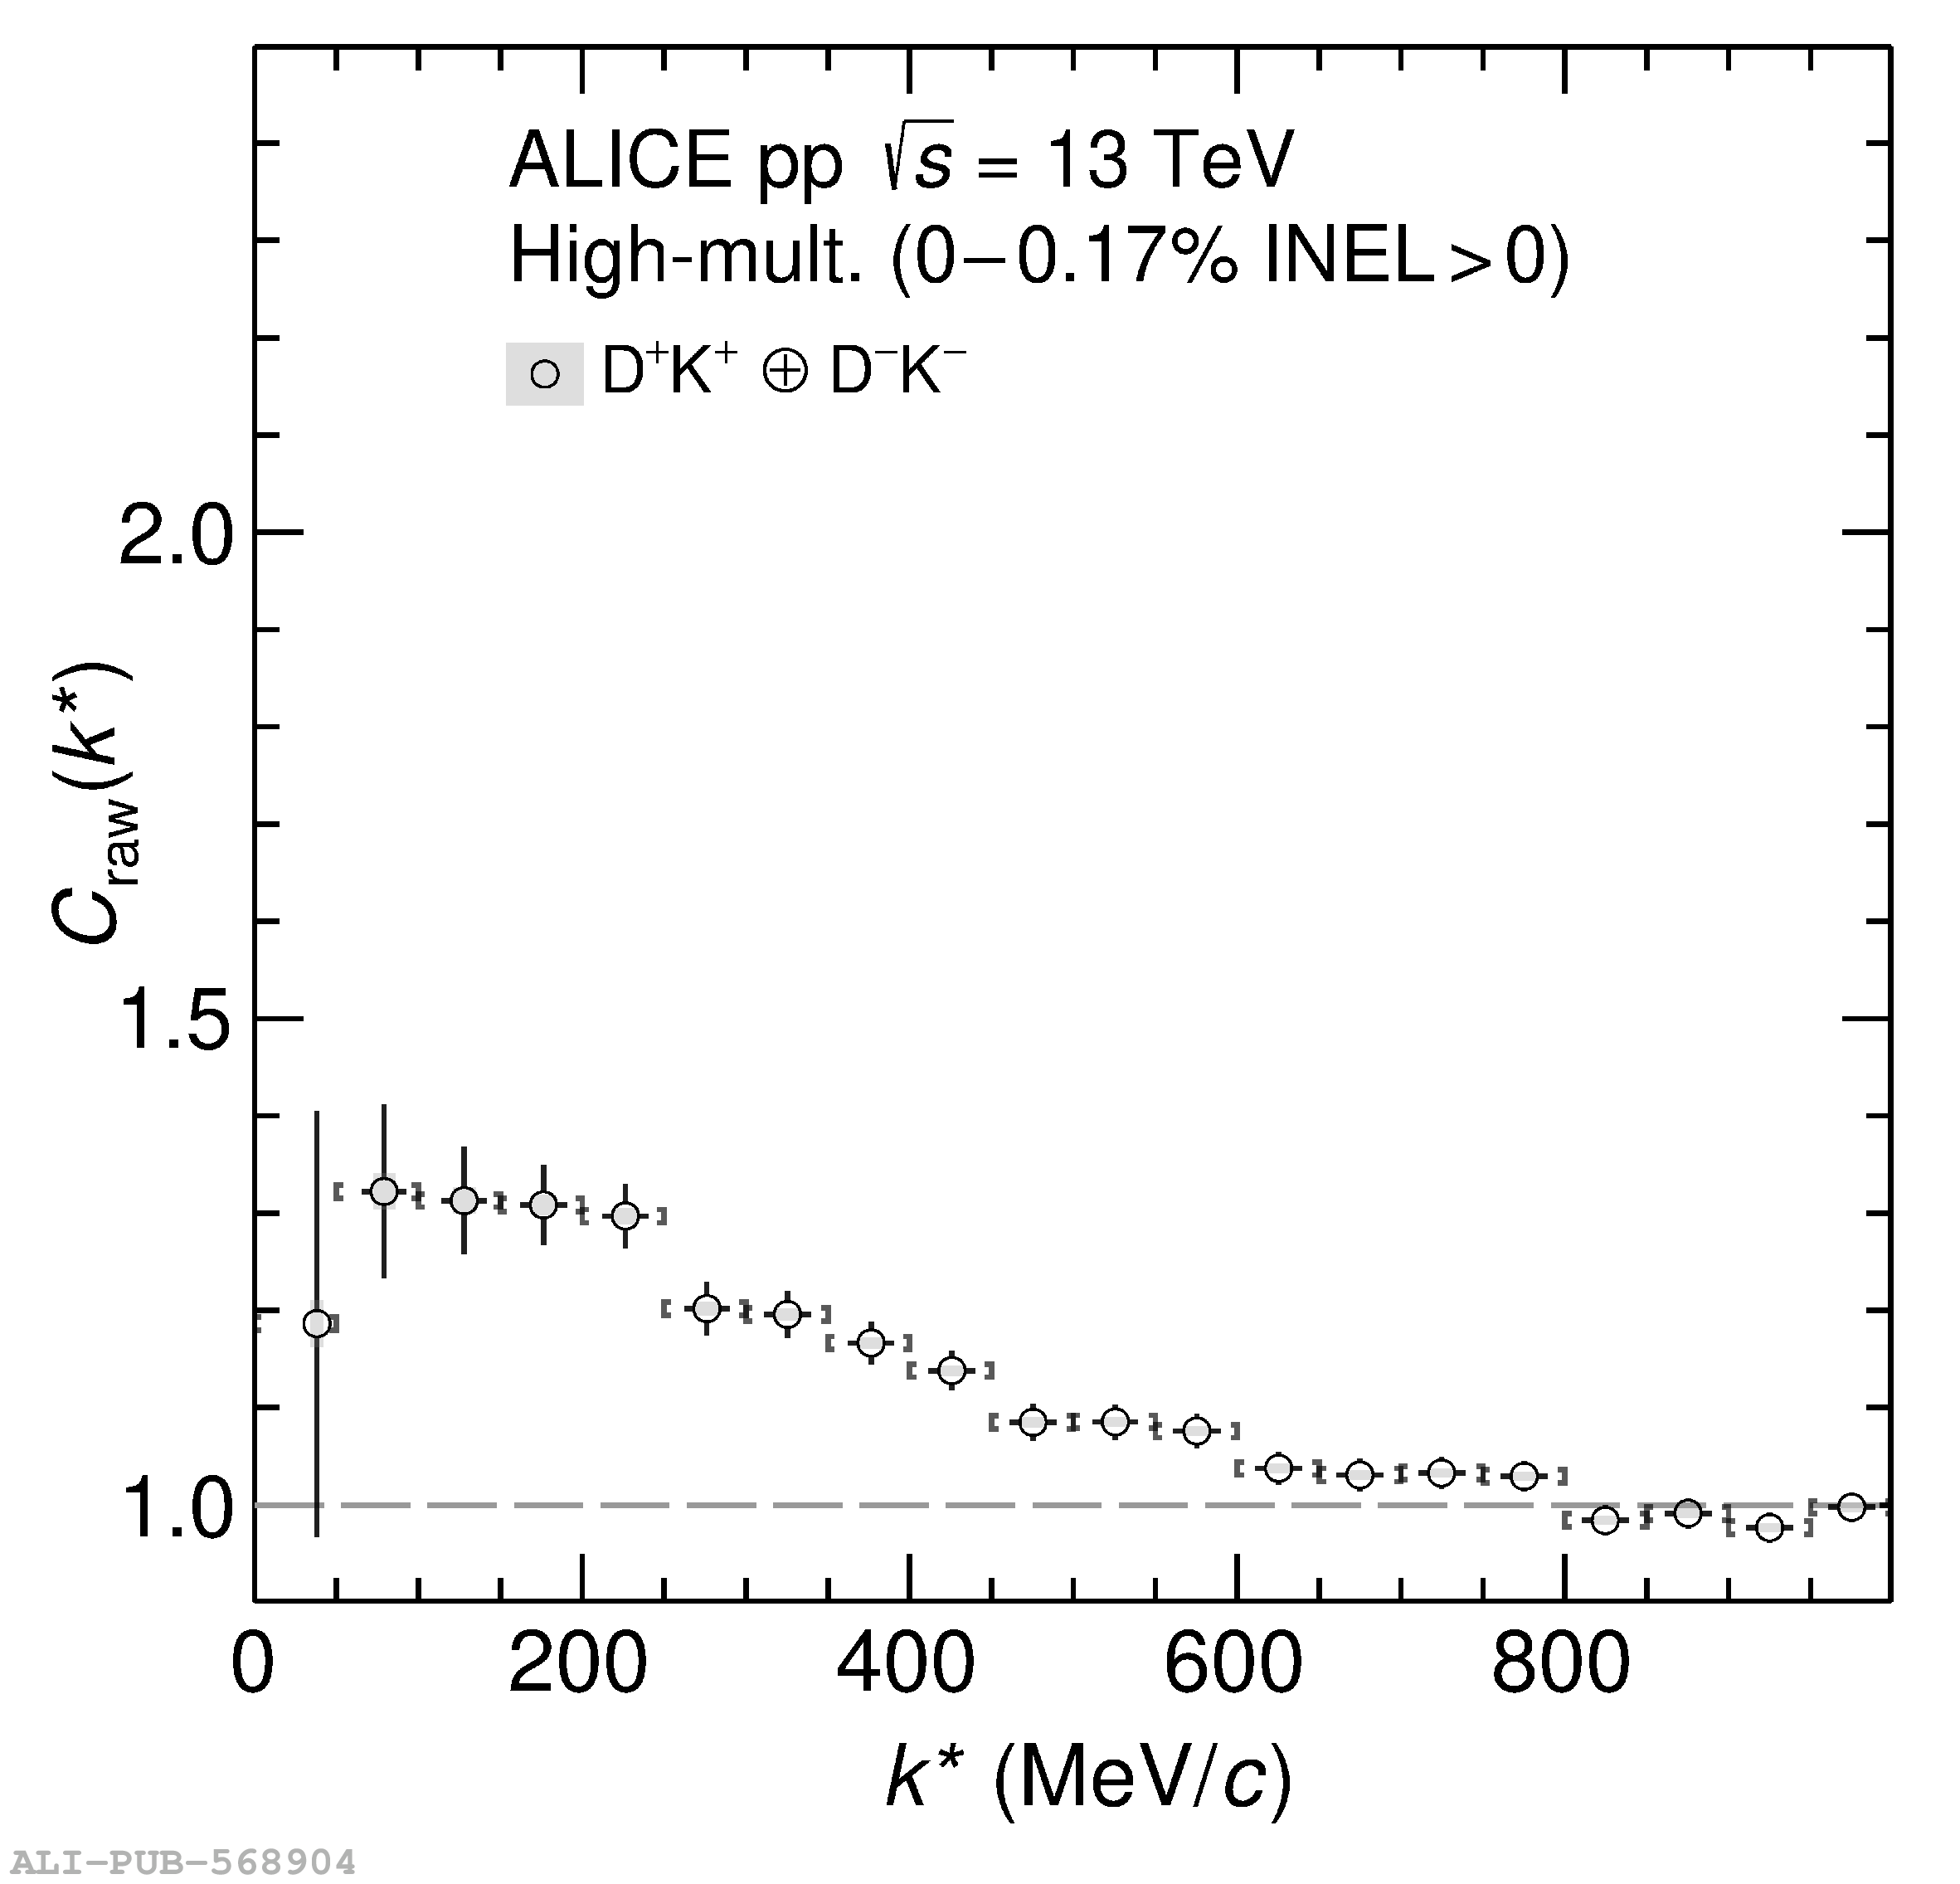 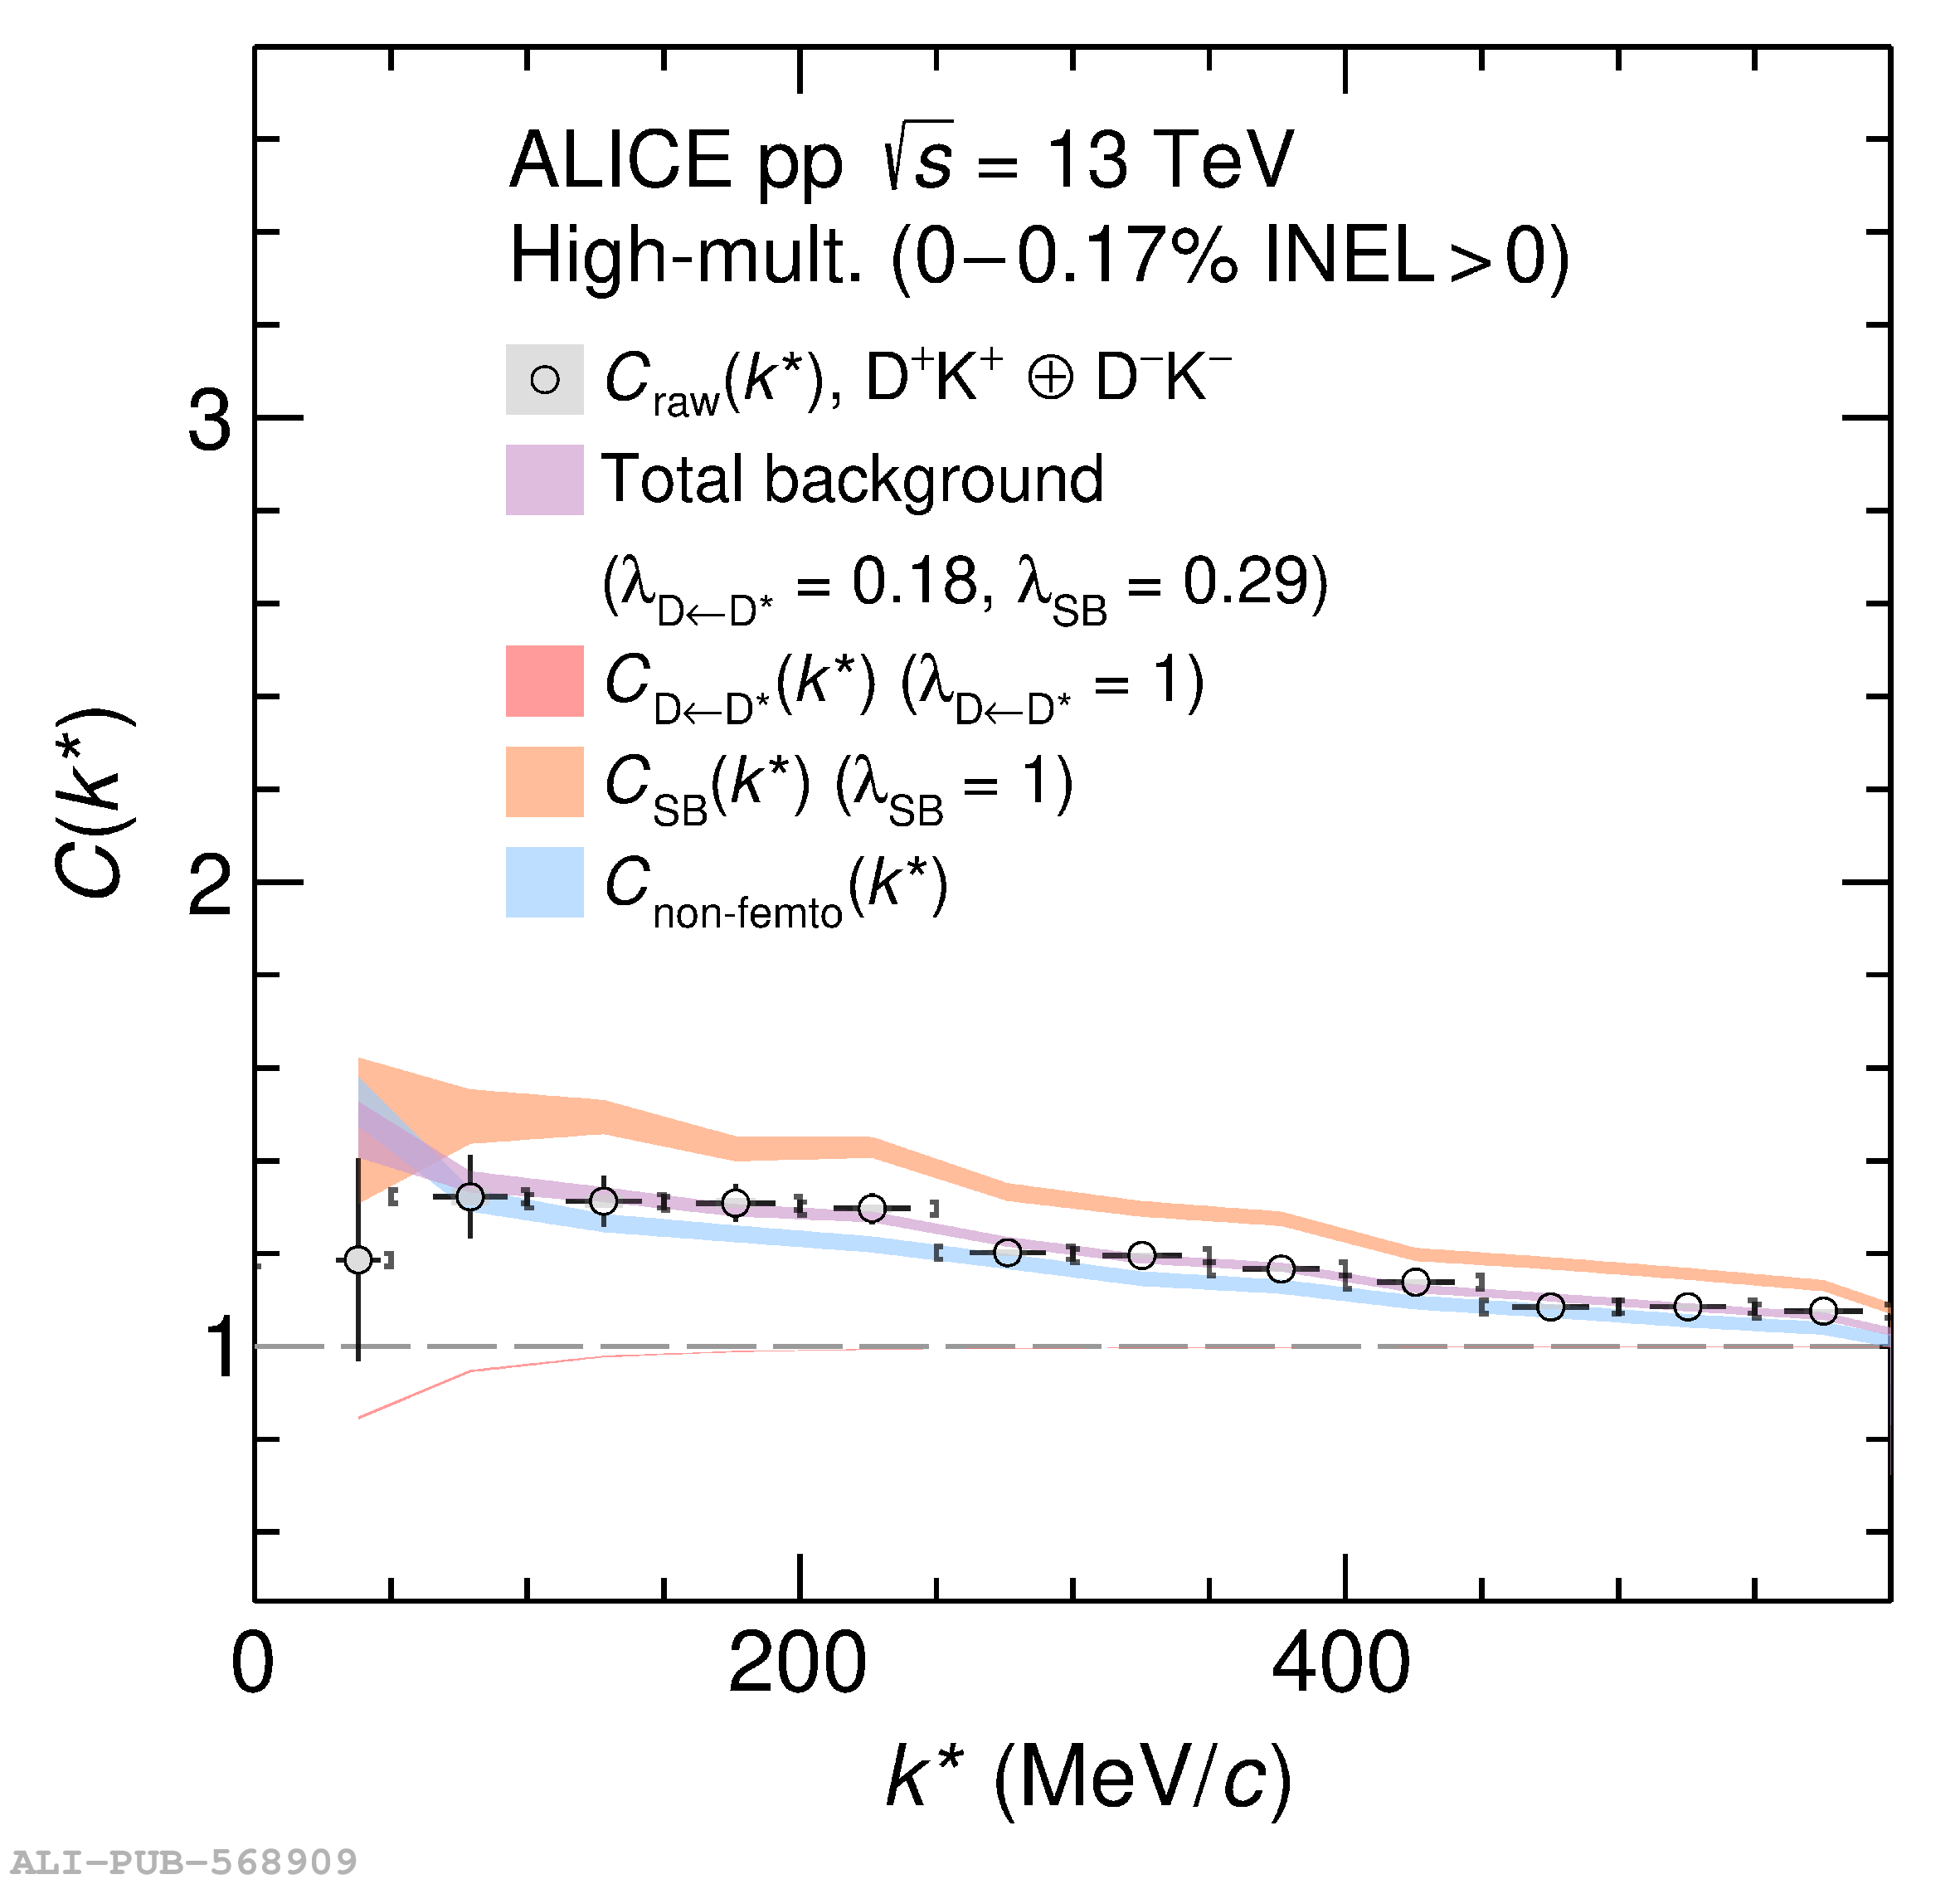 |
Figure 4
Genuine correlation functions with statistical (bars) and systematic uncertainties (boxes) compared to theoretical model predictions (bands), listed in Tables IV and V. The width of the theoretical bands represents the uncertainty related to the source. The number of standard deviations $n_{\sigma}$ is reported for each model in the legend. The results are shown for $\mathrm{D}\pi$ (first row) and $\mathrm{DK}$ (second row) for the opposite- (left column) and same-charge (right column) combinations. | 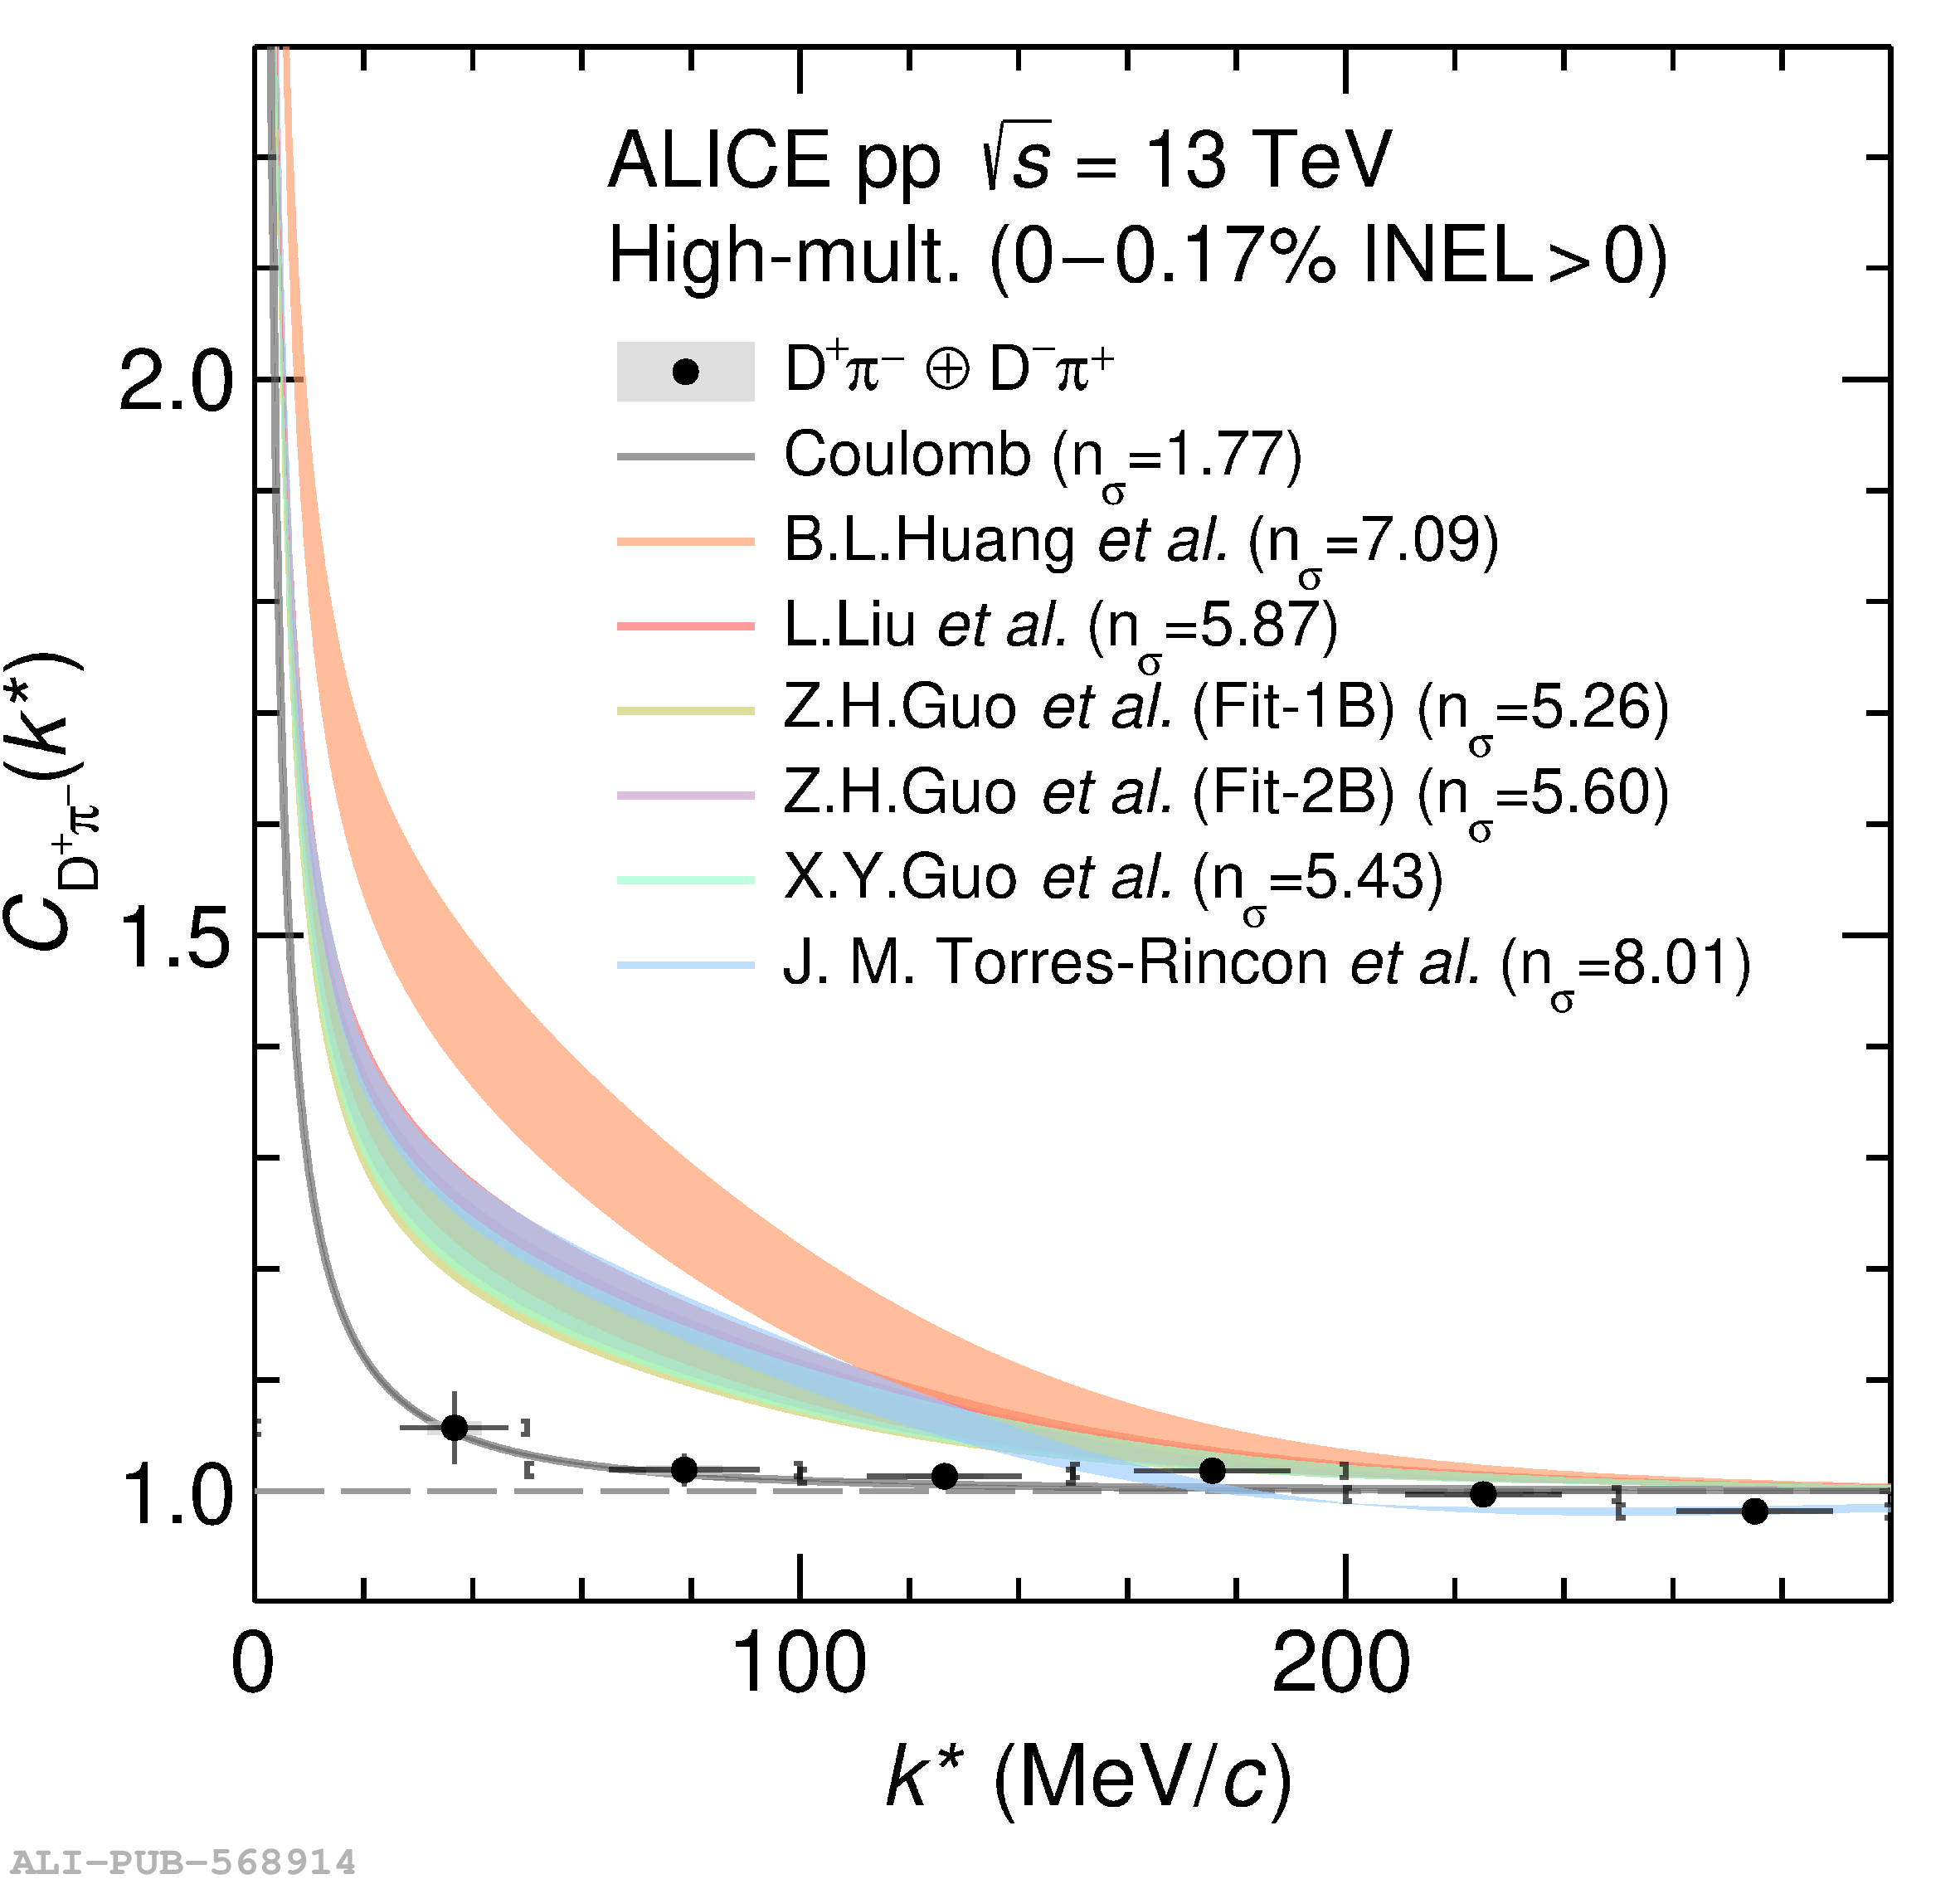 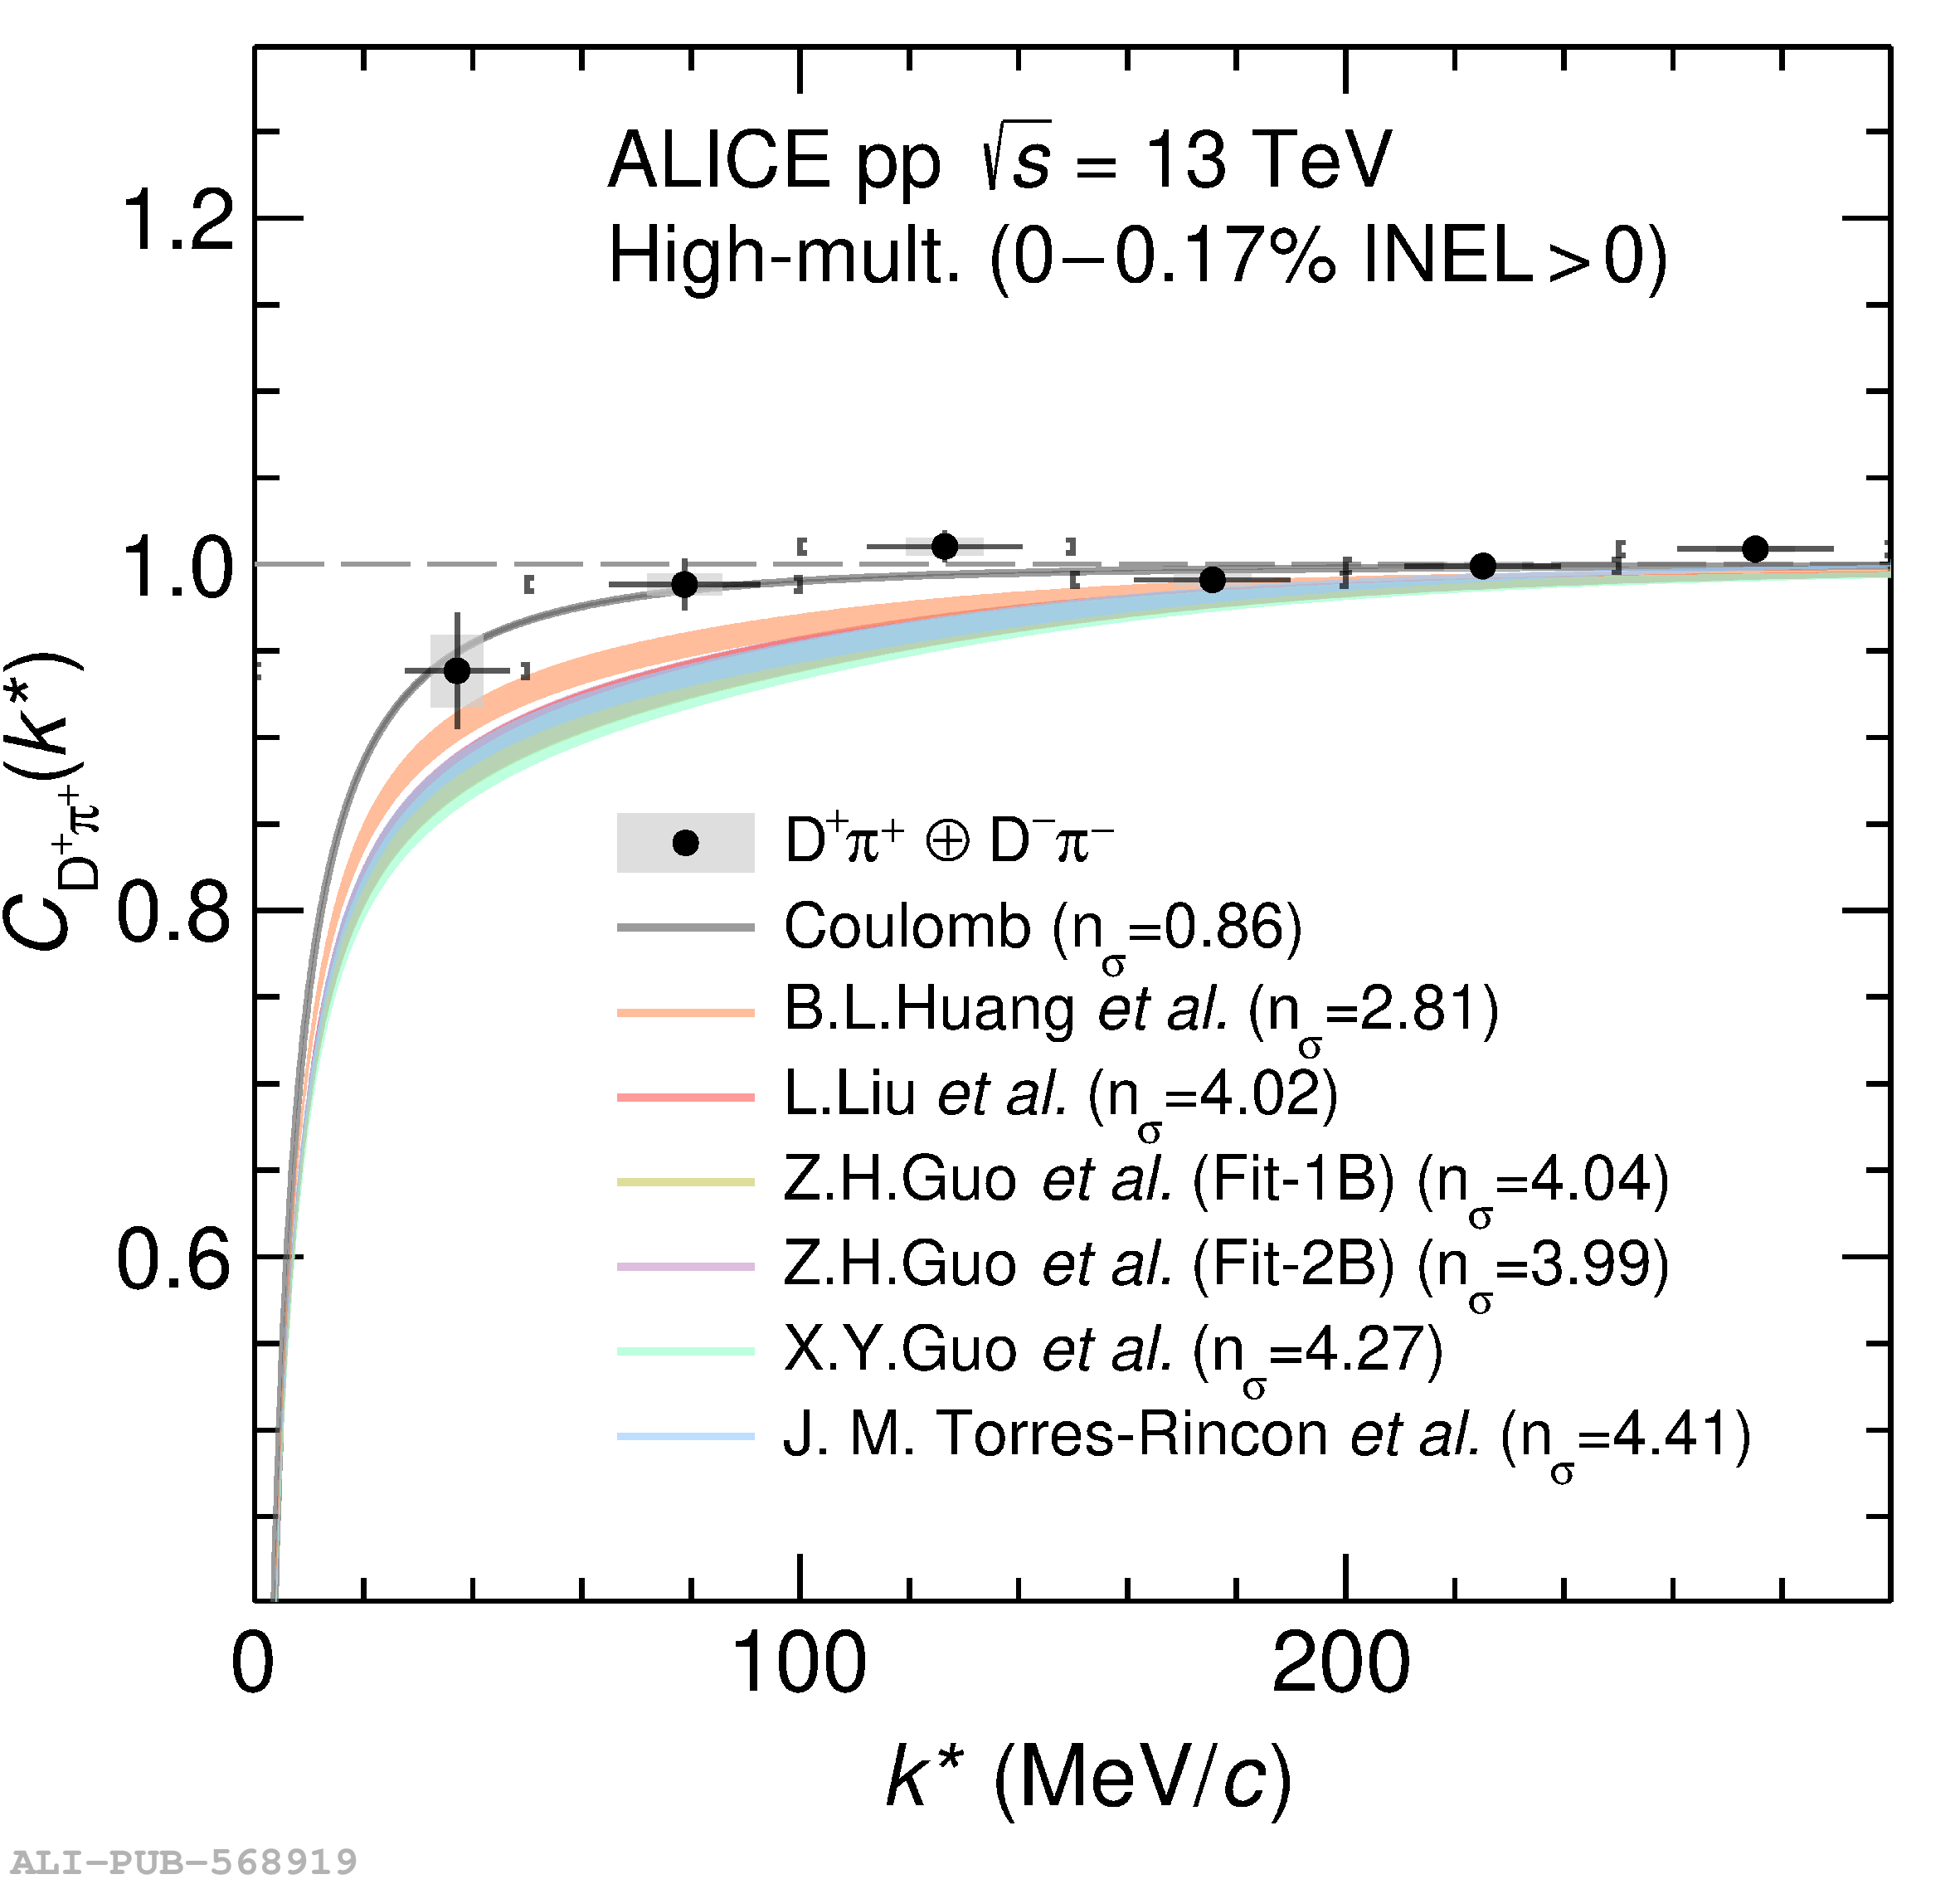 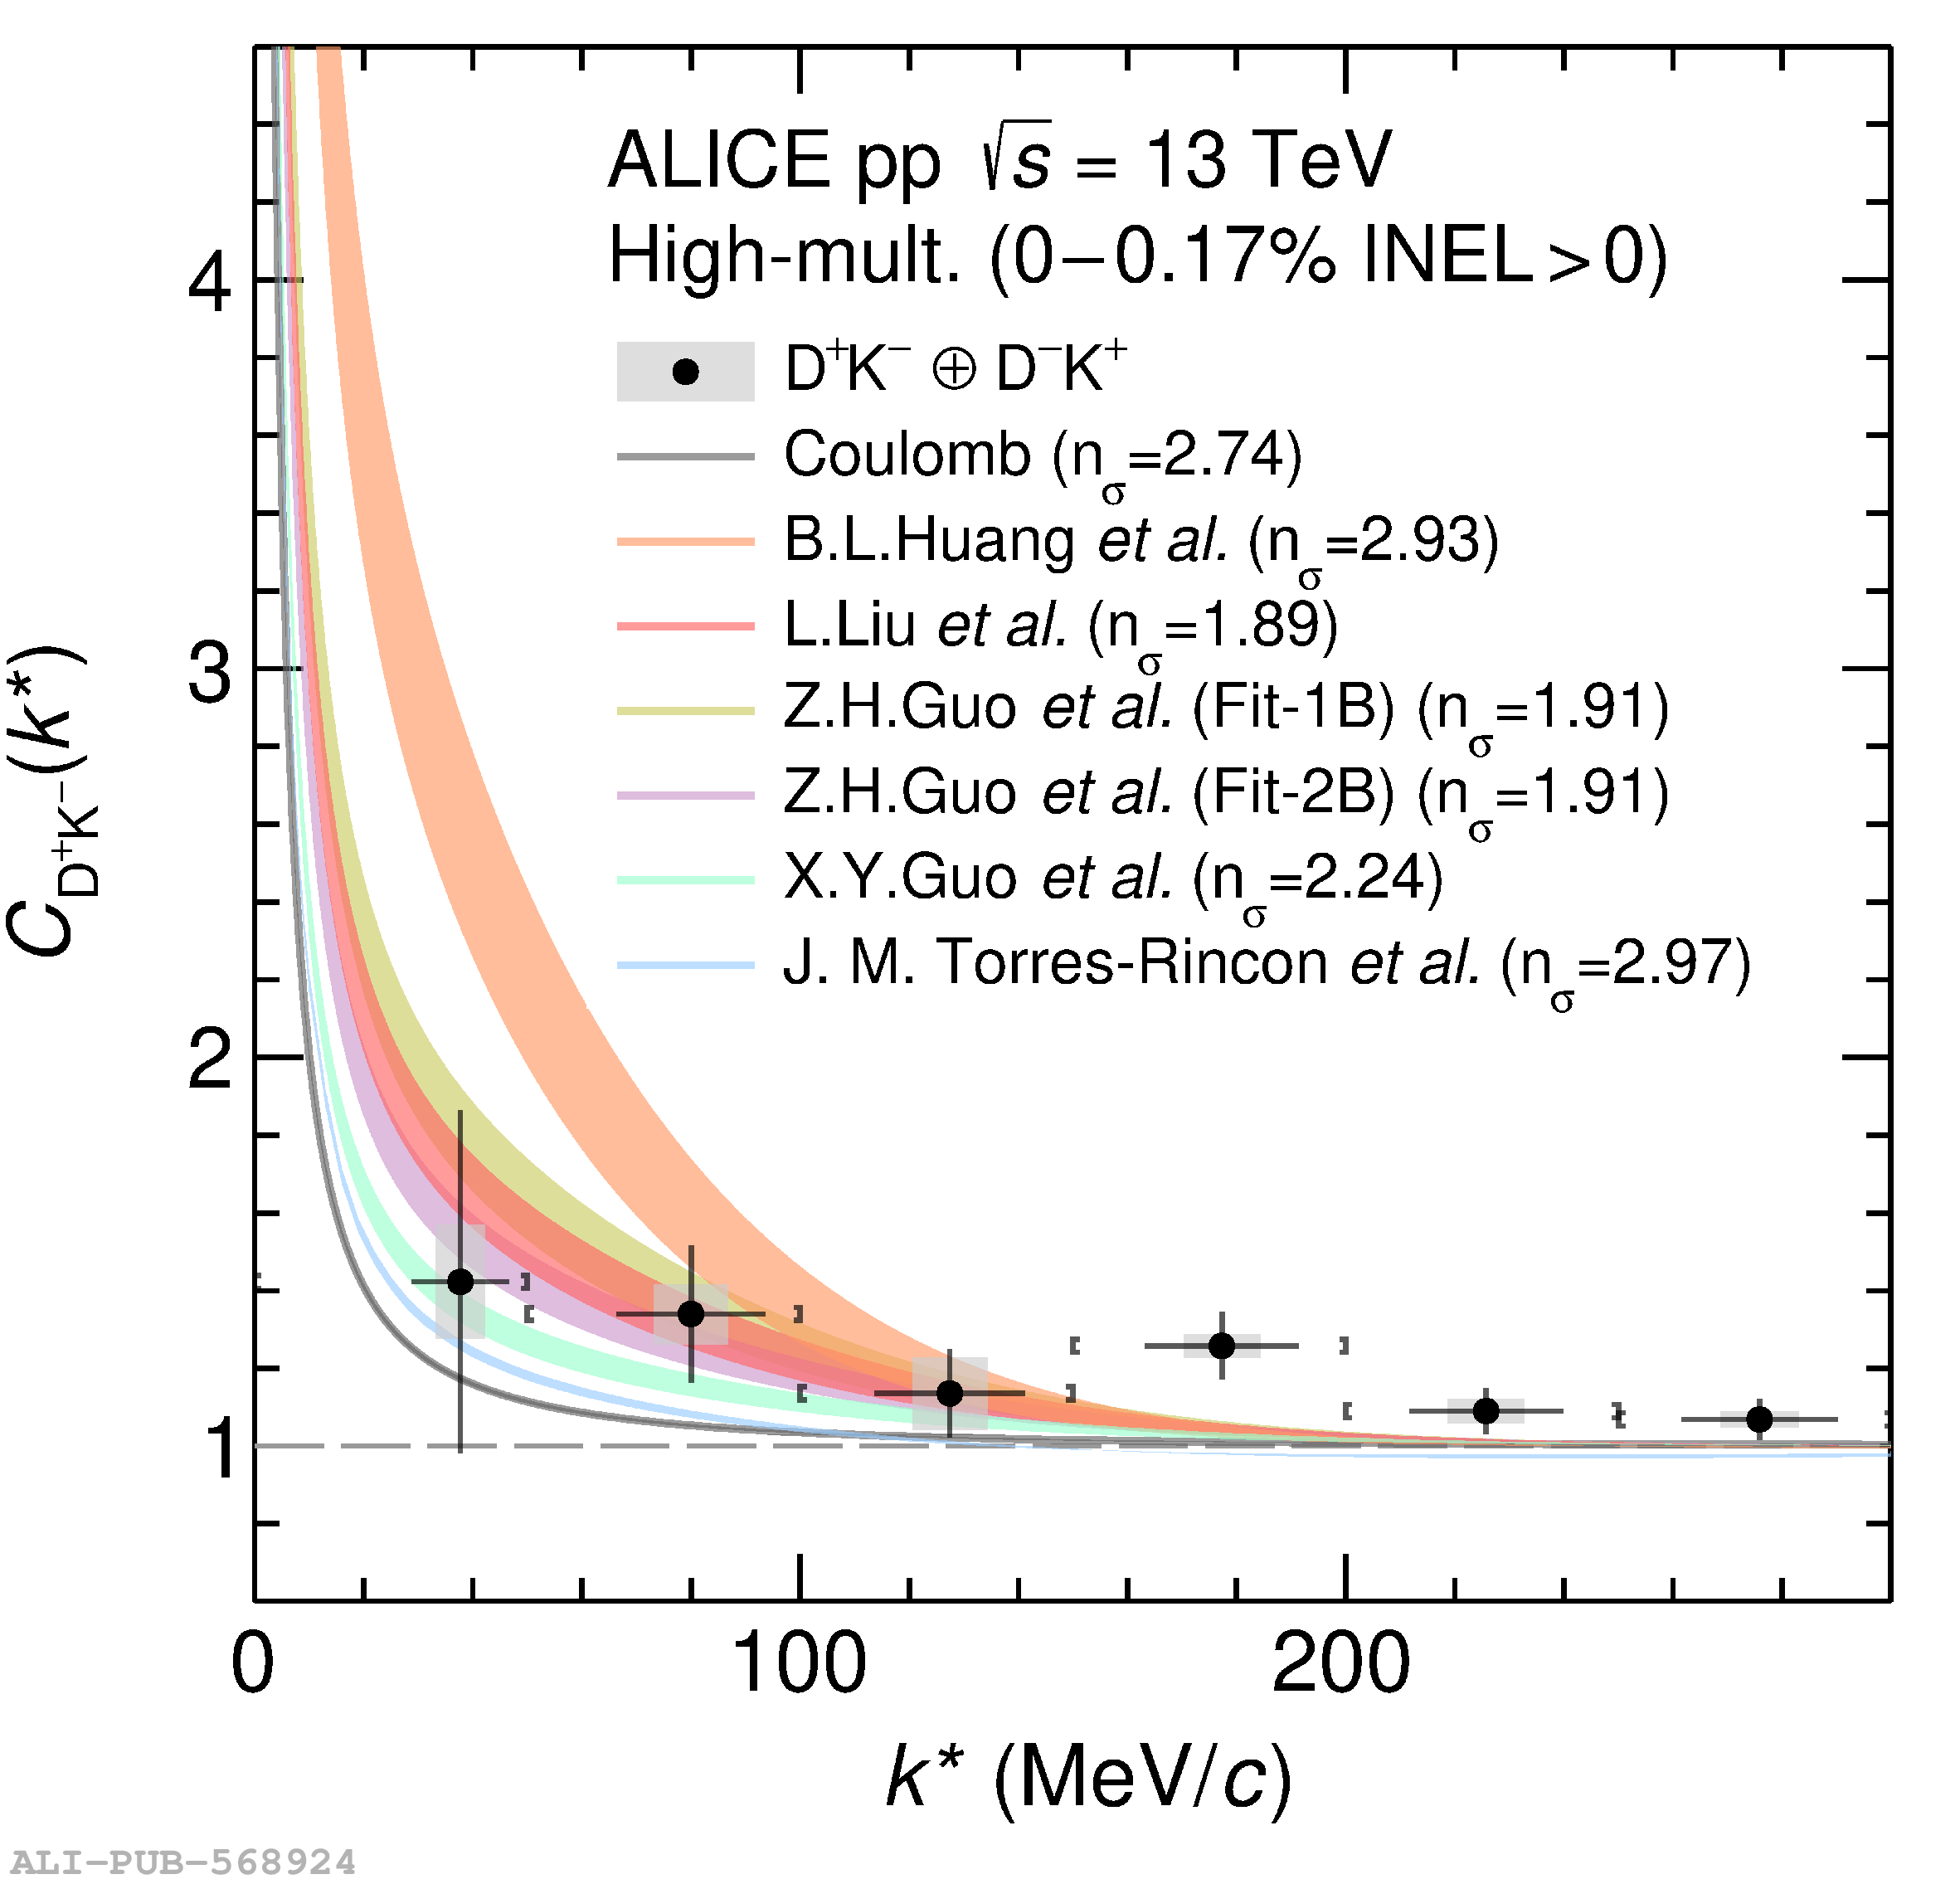 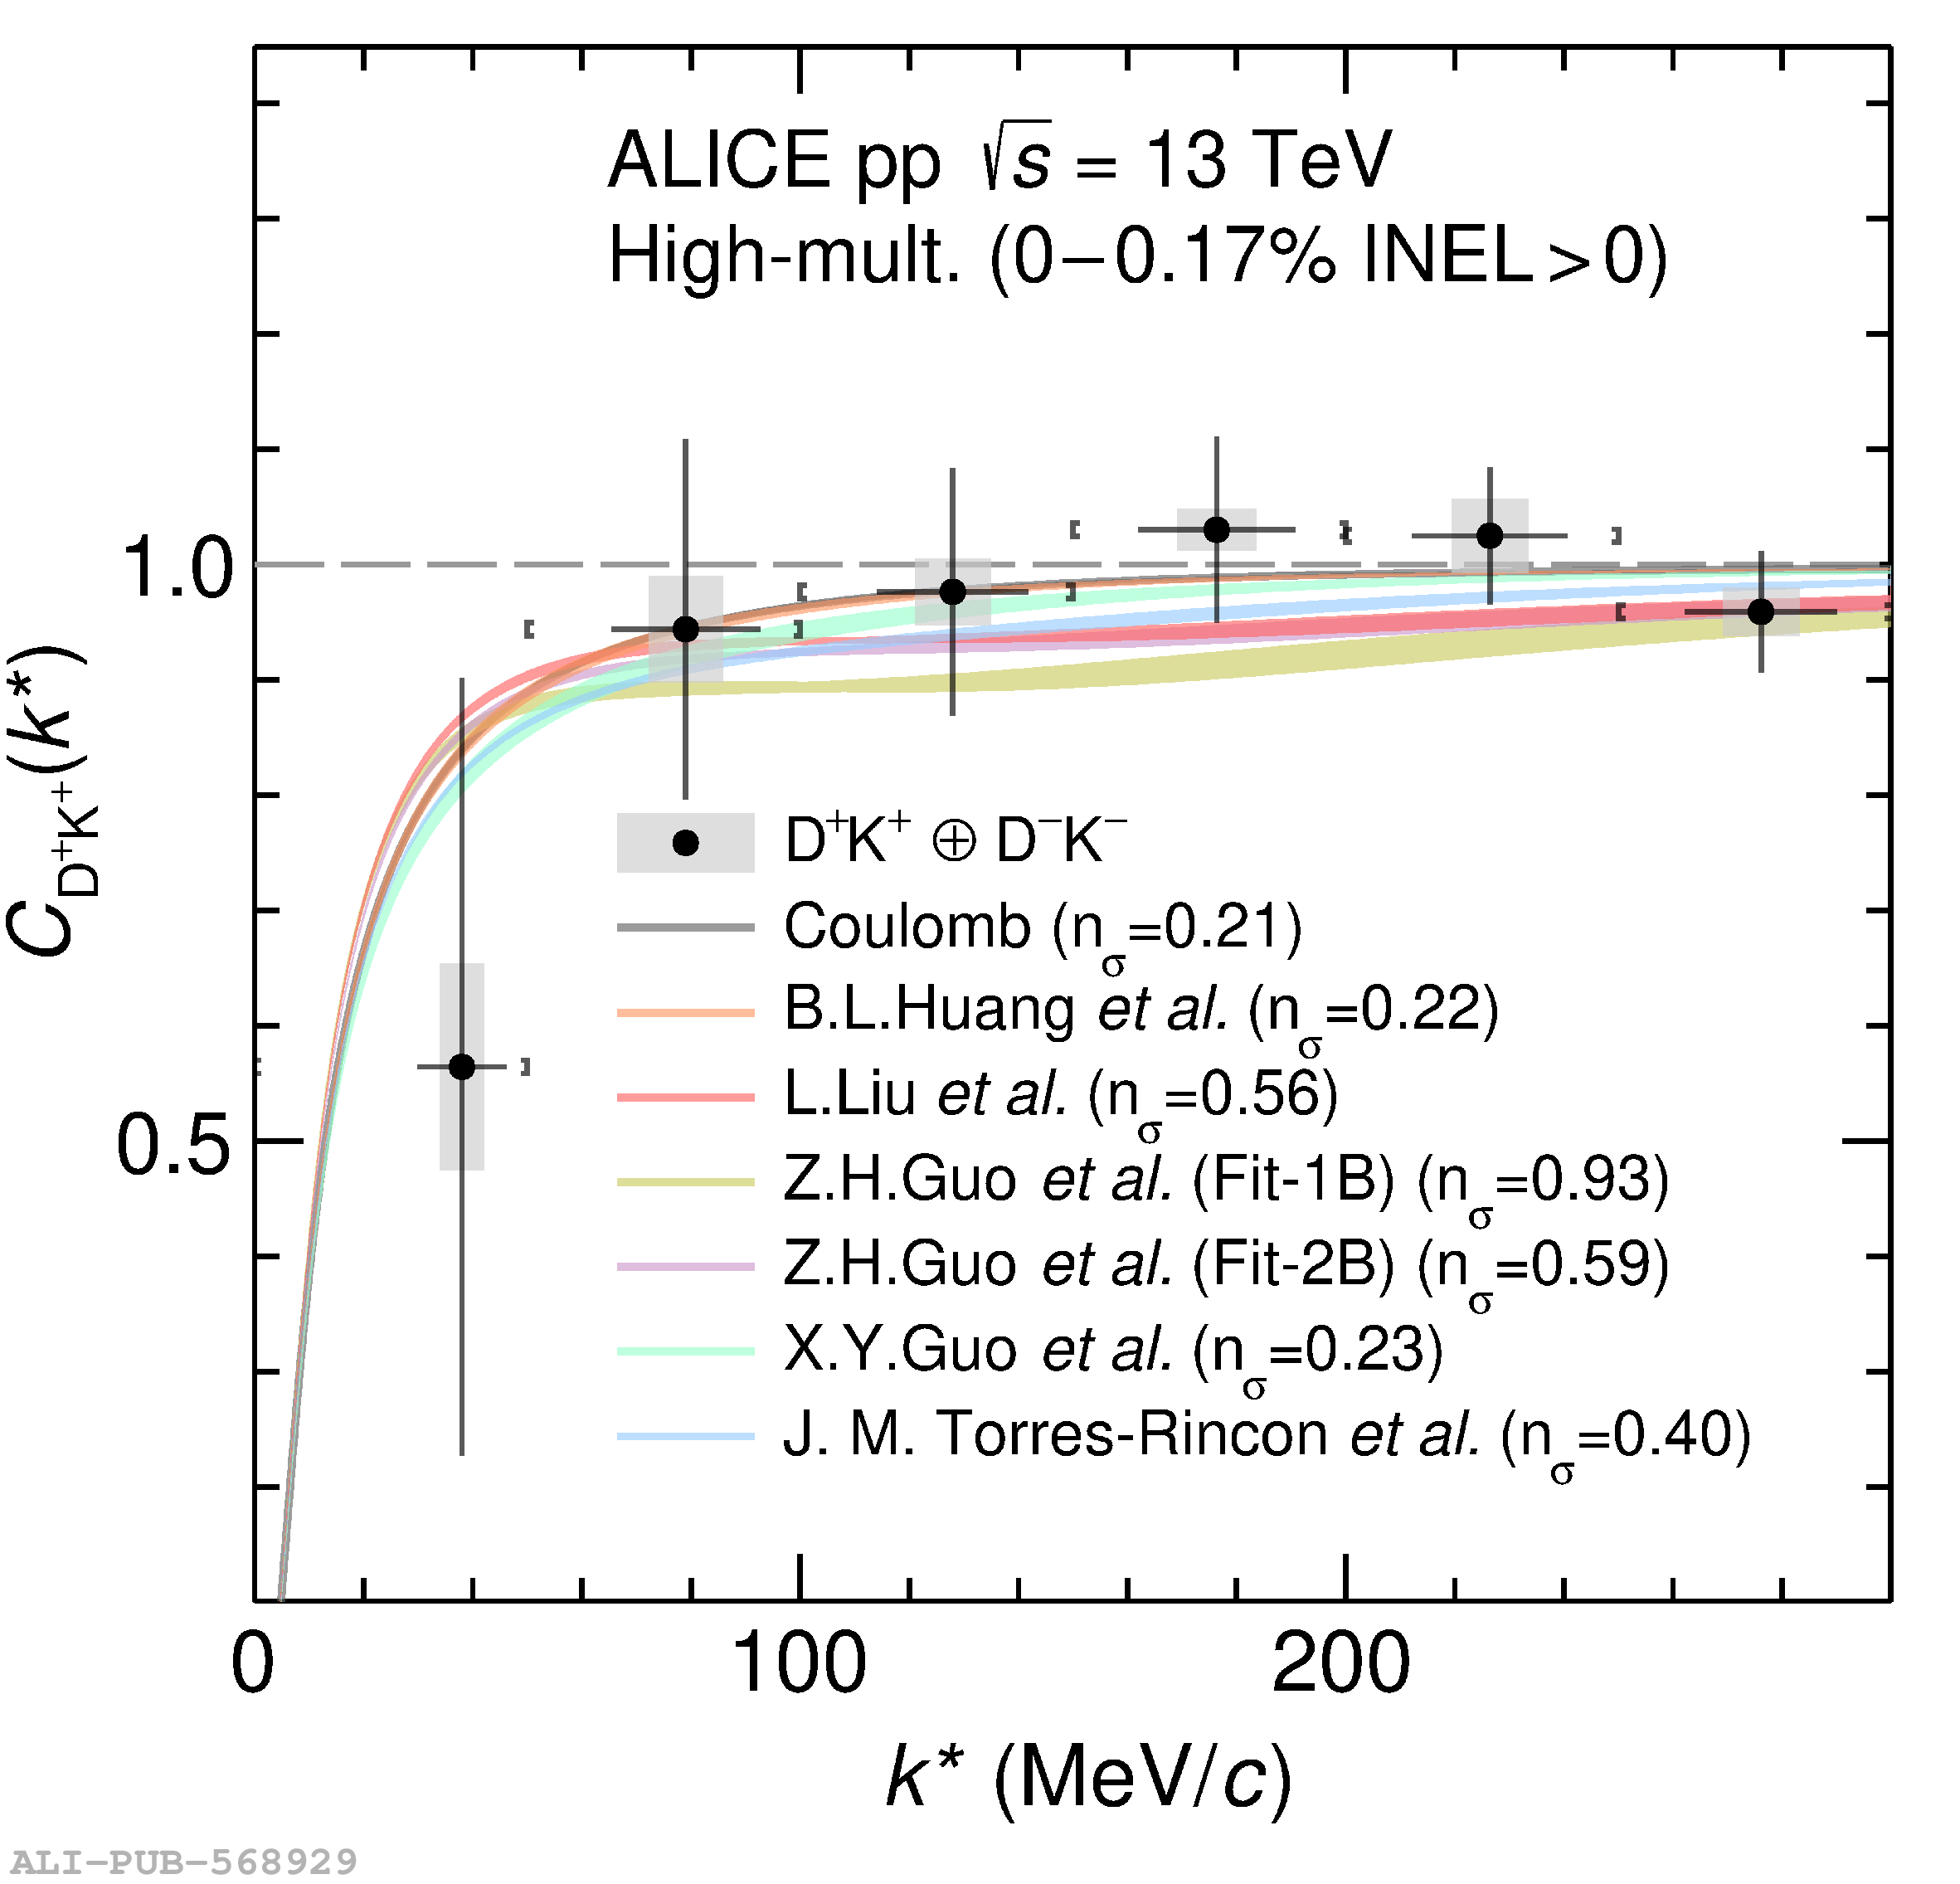 |
Figure 5
Genuine correlation functions with statistical (bars) and systematic uncertainties (boxes) compared to theoretical model predictions (bands). The width of the bands represents the uncertainty related to the source. The number of standard deviations $n_{\sigma}$ is reported for each model in the legend. The results are shown for $\mathrm{D^*}\pi$ (first row) and $\mathrm{D^*K}$ (second row) for the opposite- (left column) and same-chage (right column) combinations. | 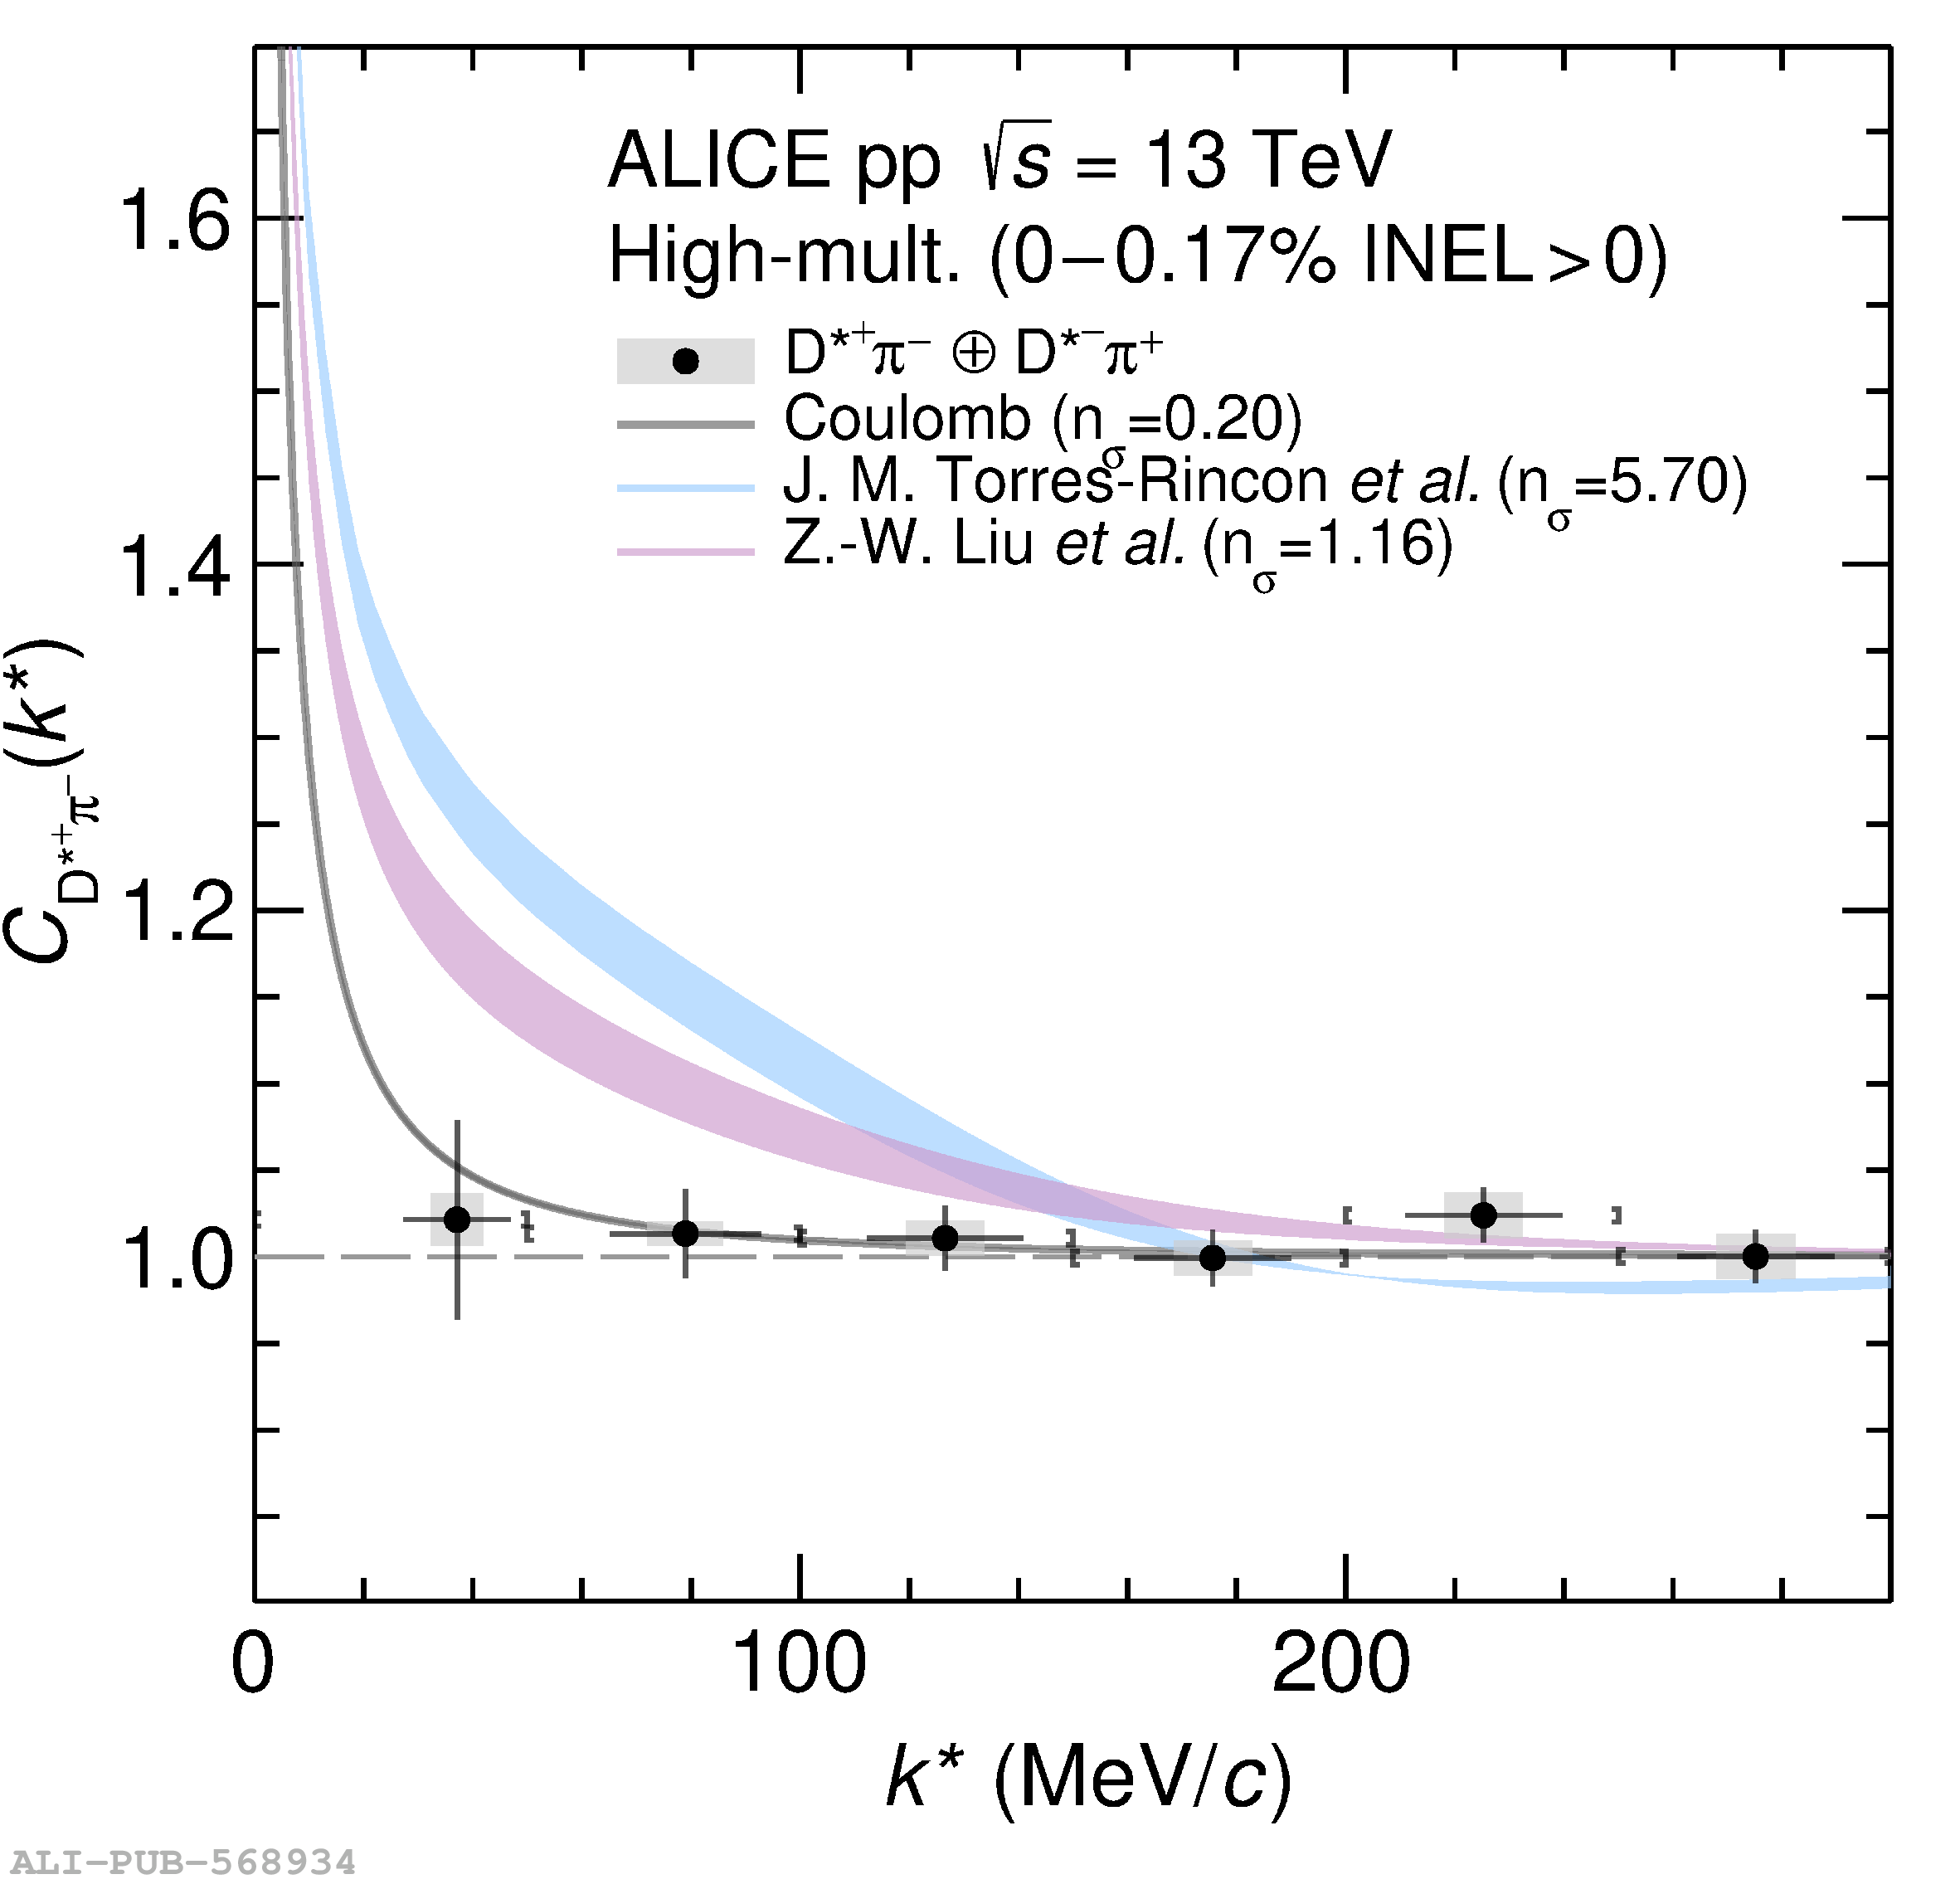  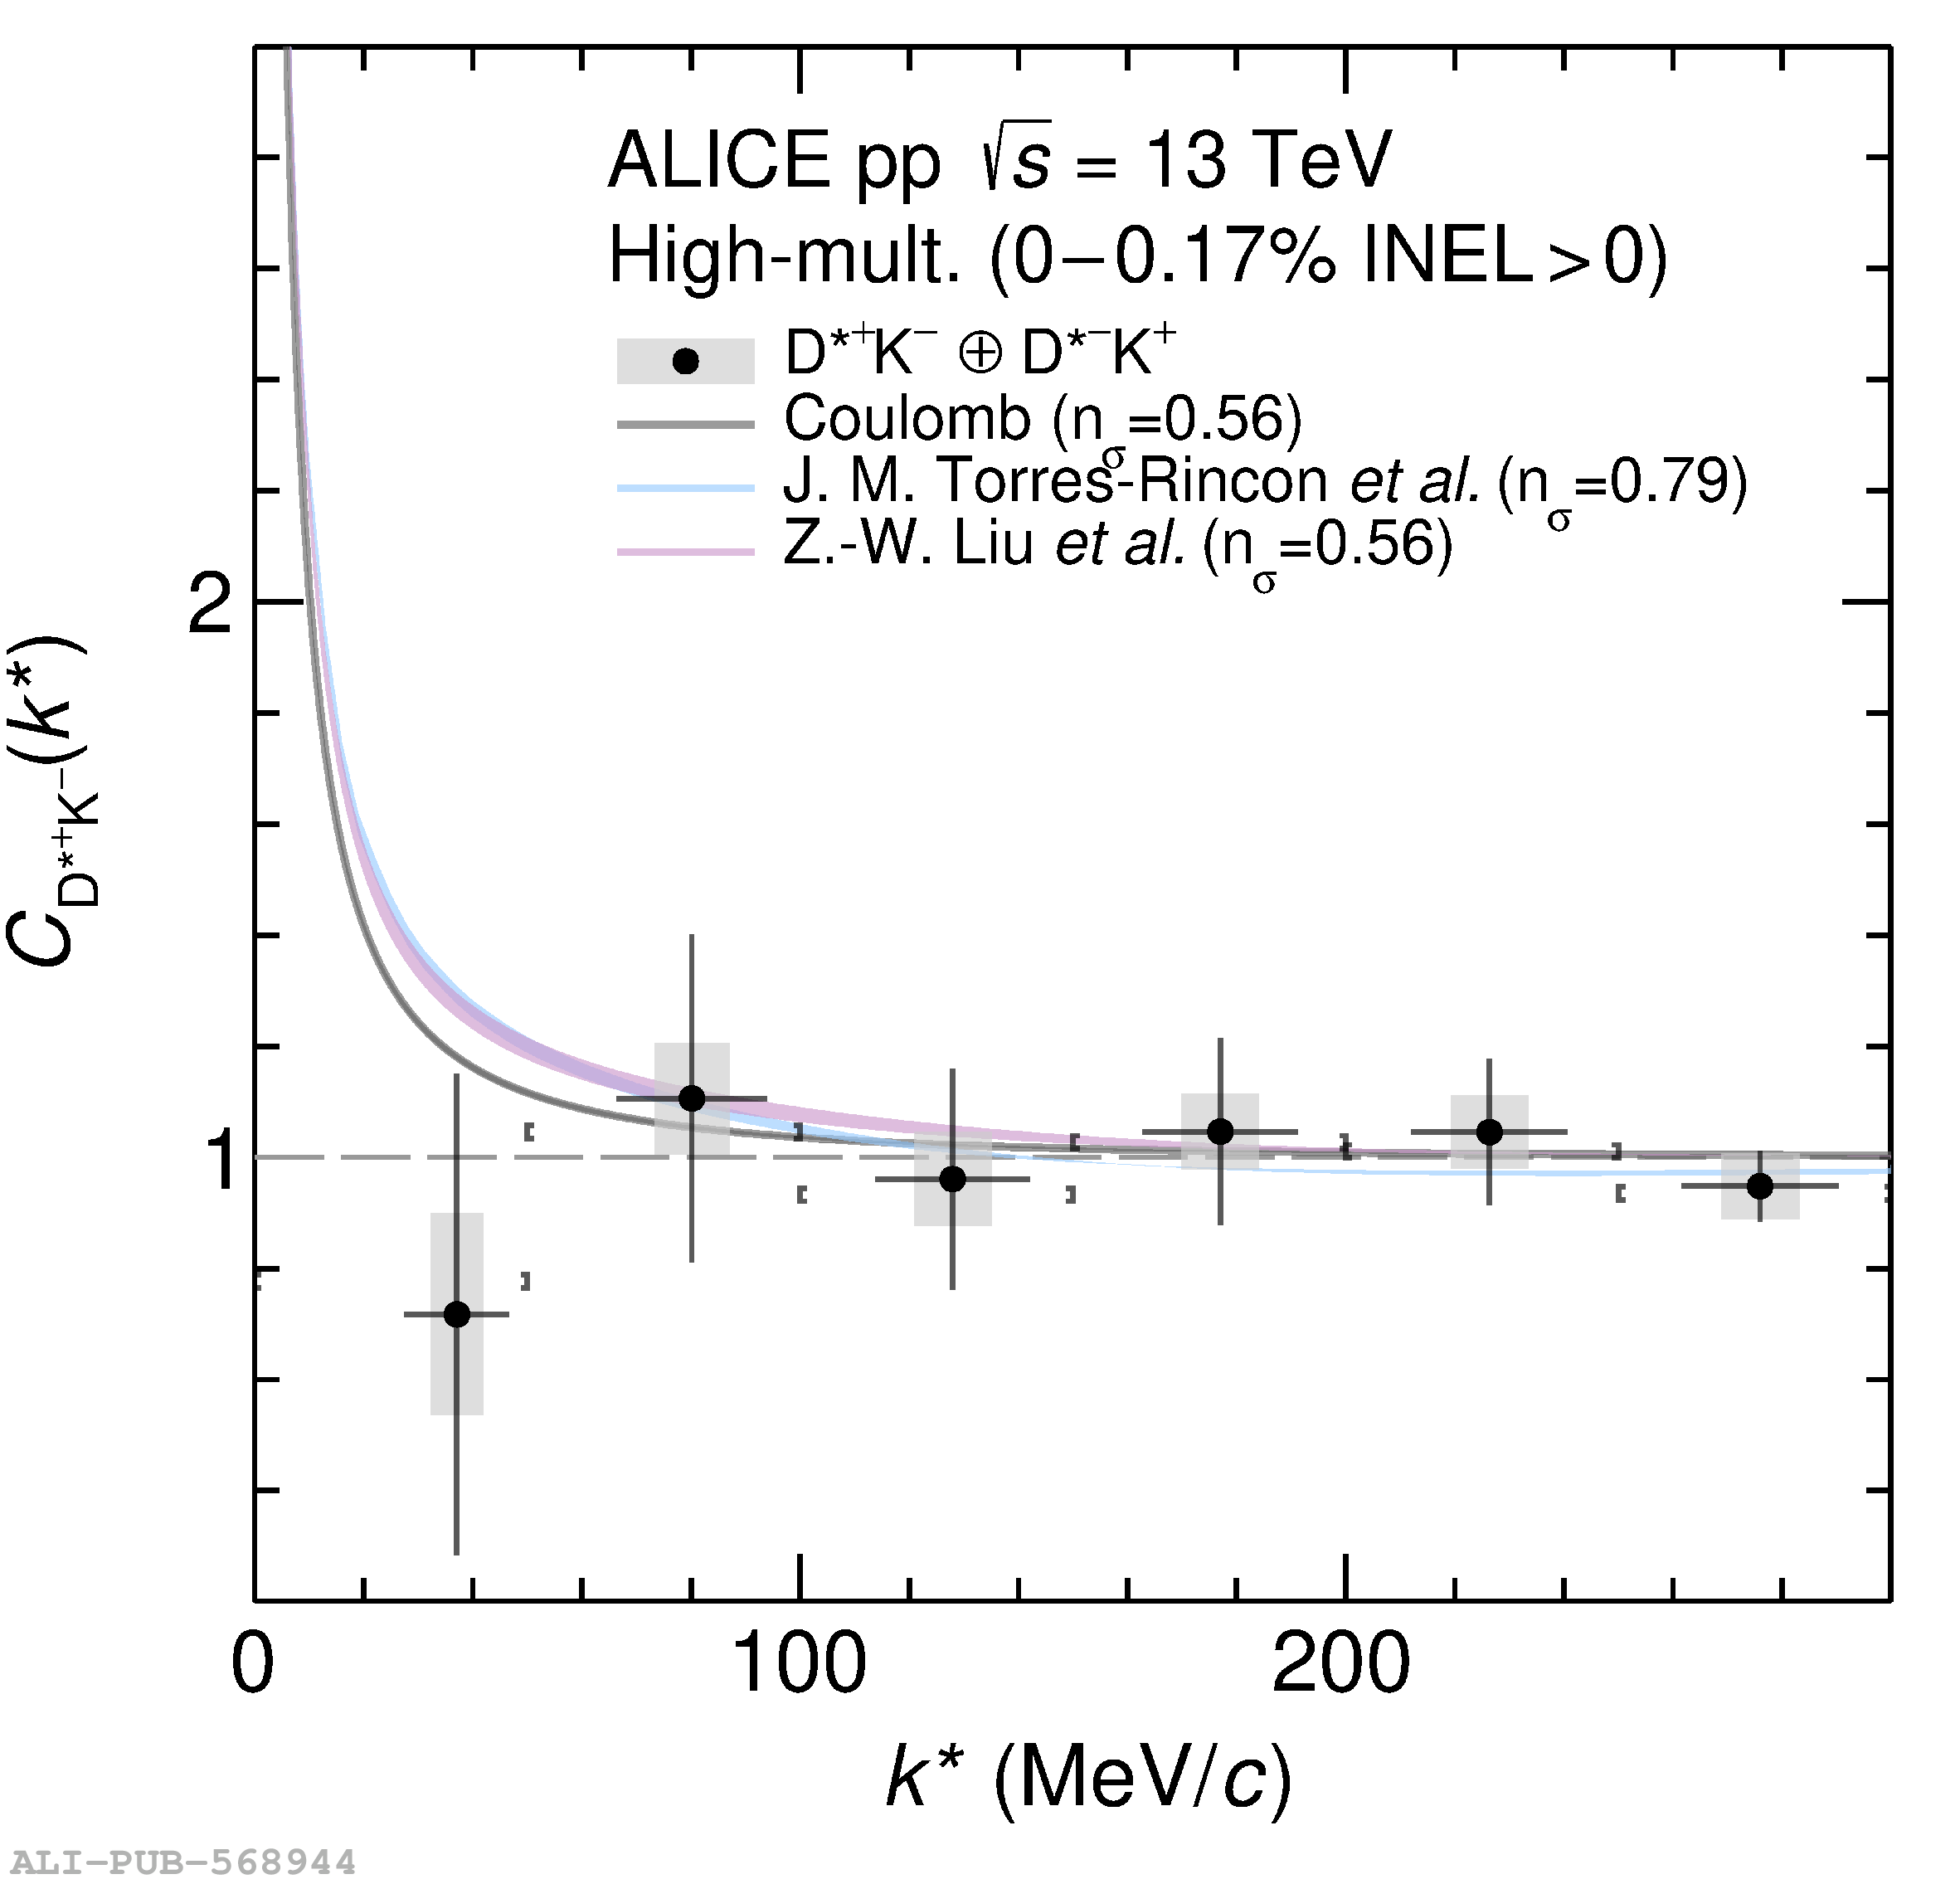 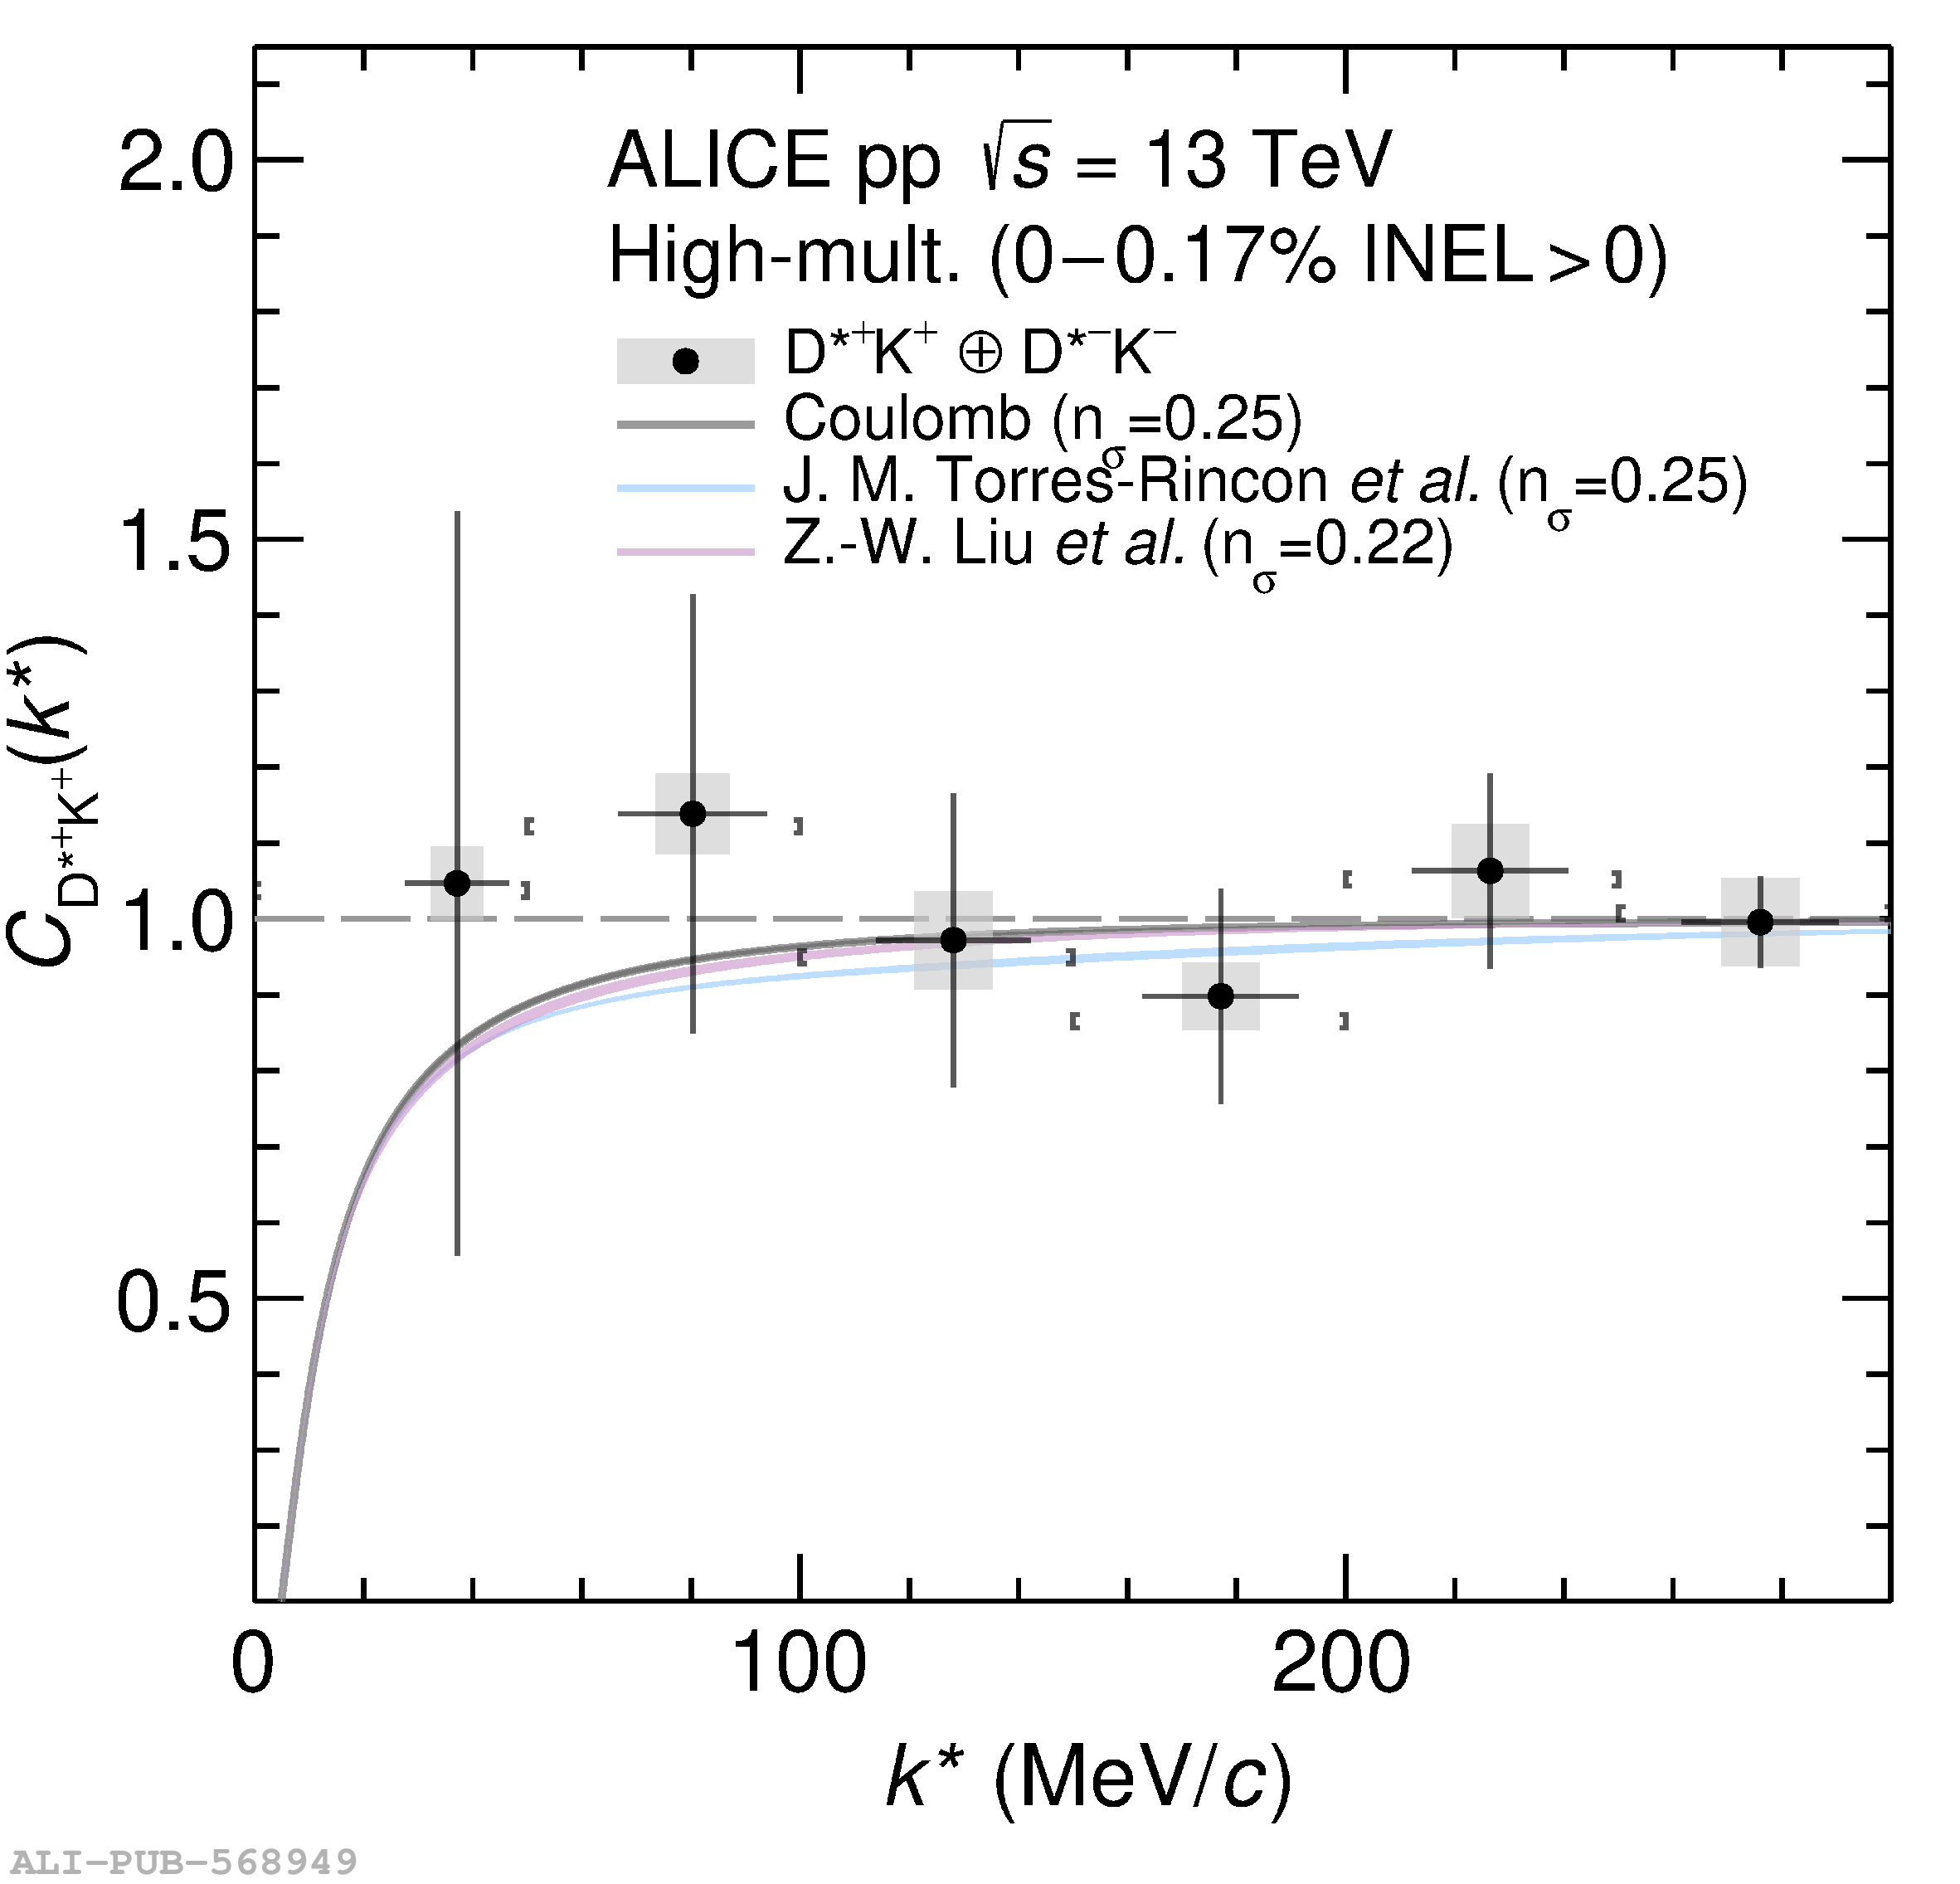 |
Figure 6
Comparison of the $\mathrm{D}\pi$ (first row) and $\mathrm{D^*}\pi$ (second row) genuine correlation functions of same- (left column) and opposite-charge (right column) combinations with the results of the $\chi^2$ minimization using a Gaussian potential to parameterize the strong interaction (red band). The width of the band corresponds to the total uncertainty. The gray curve represents the correlation functions assuming only interaction via the Coulomb force. | 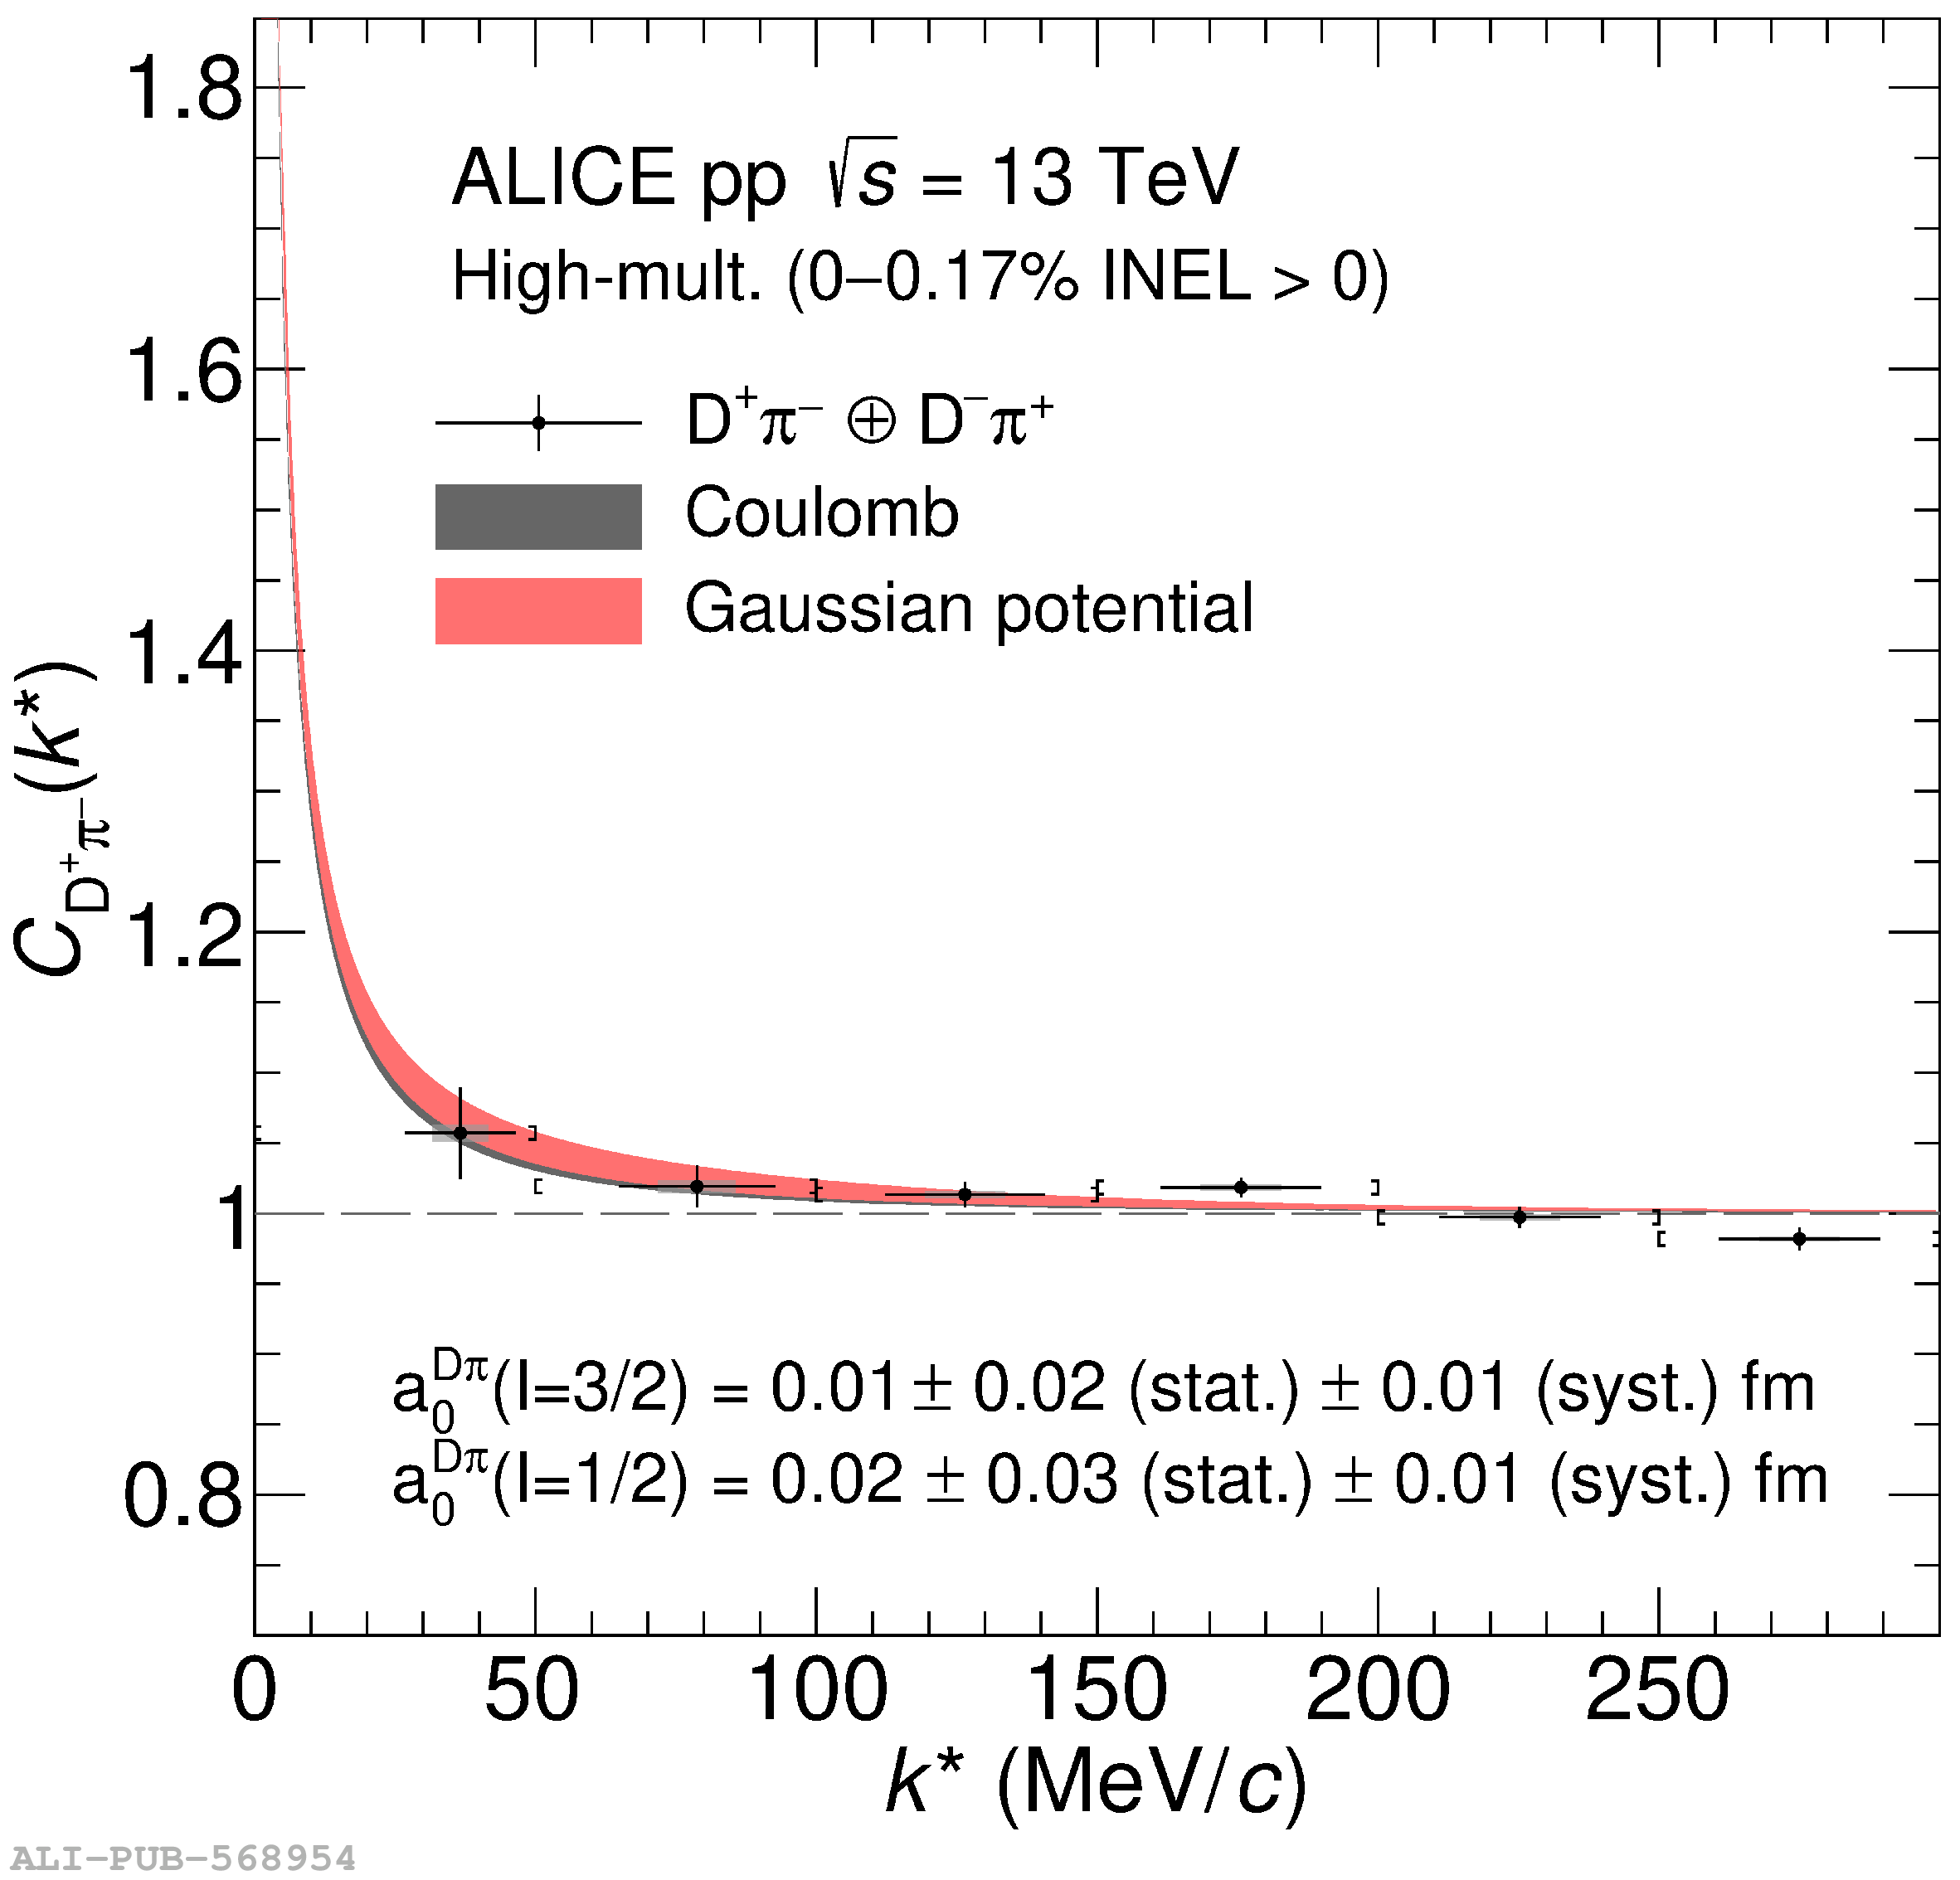 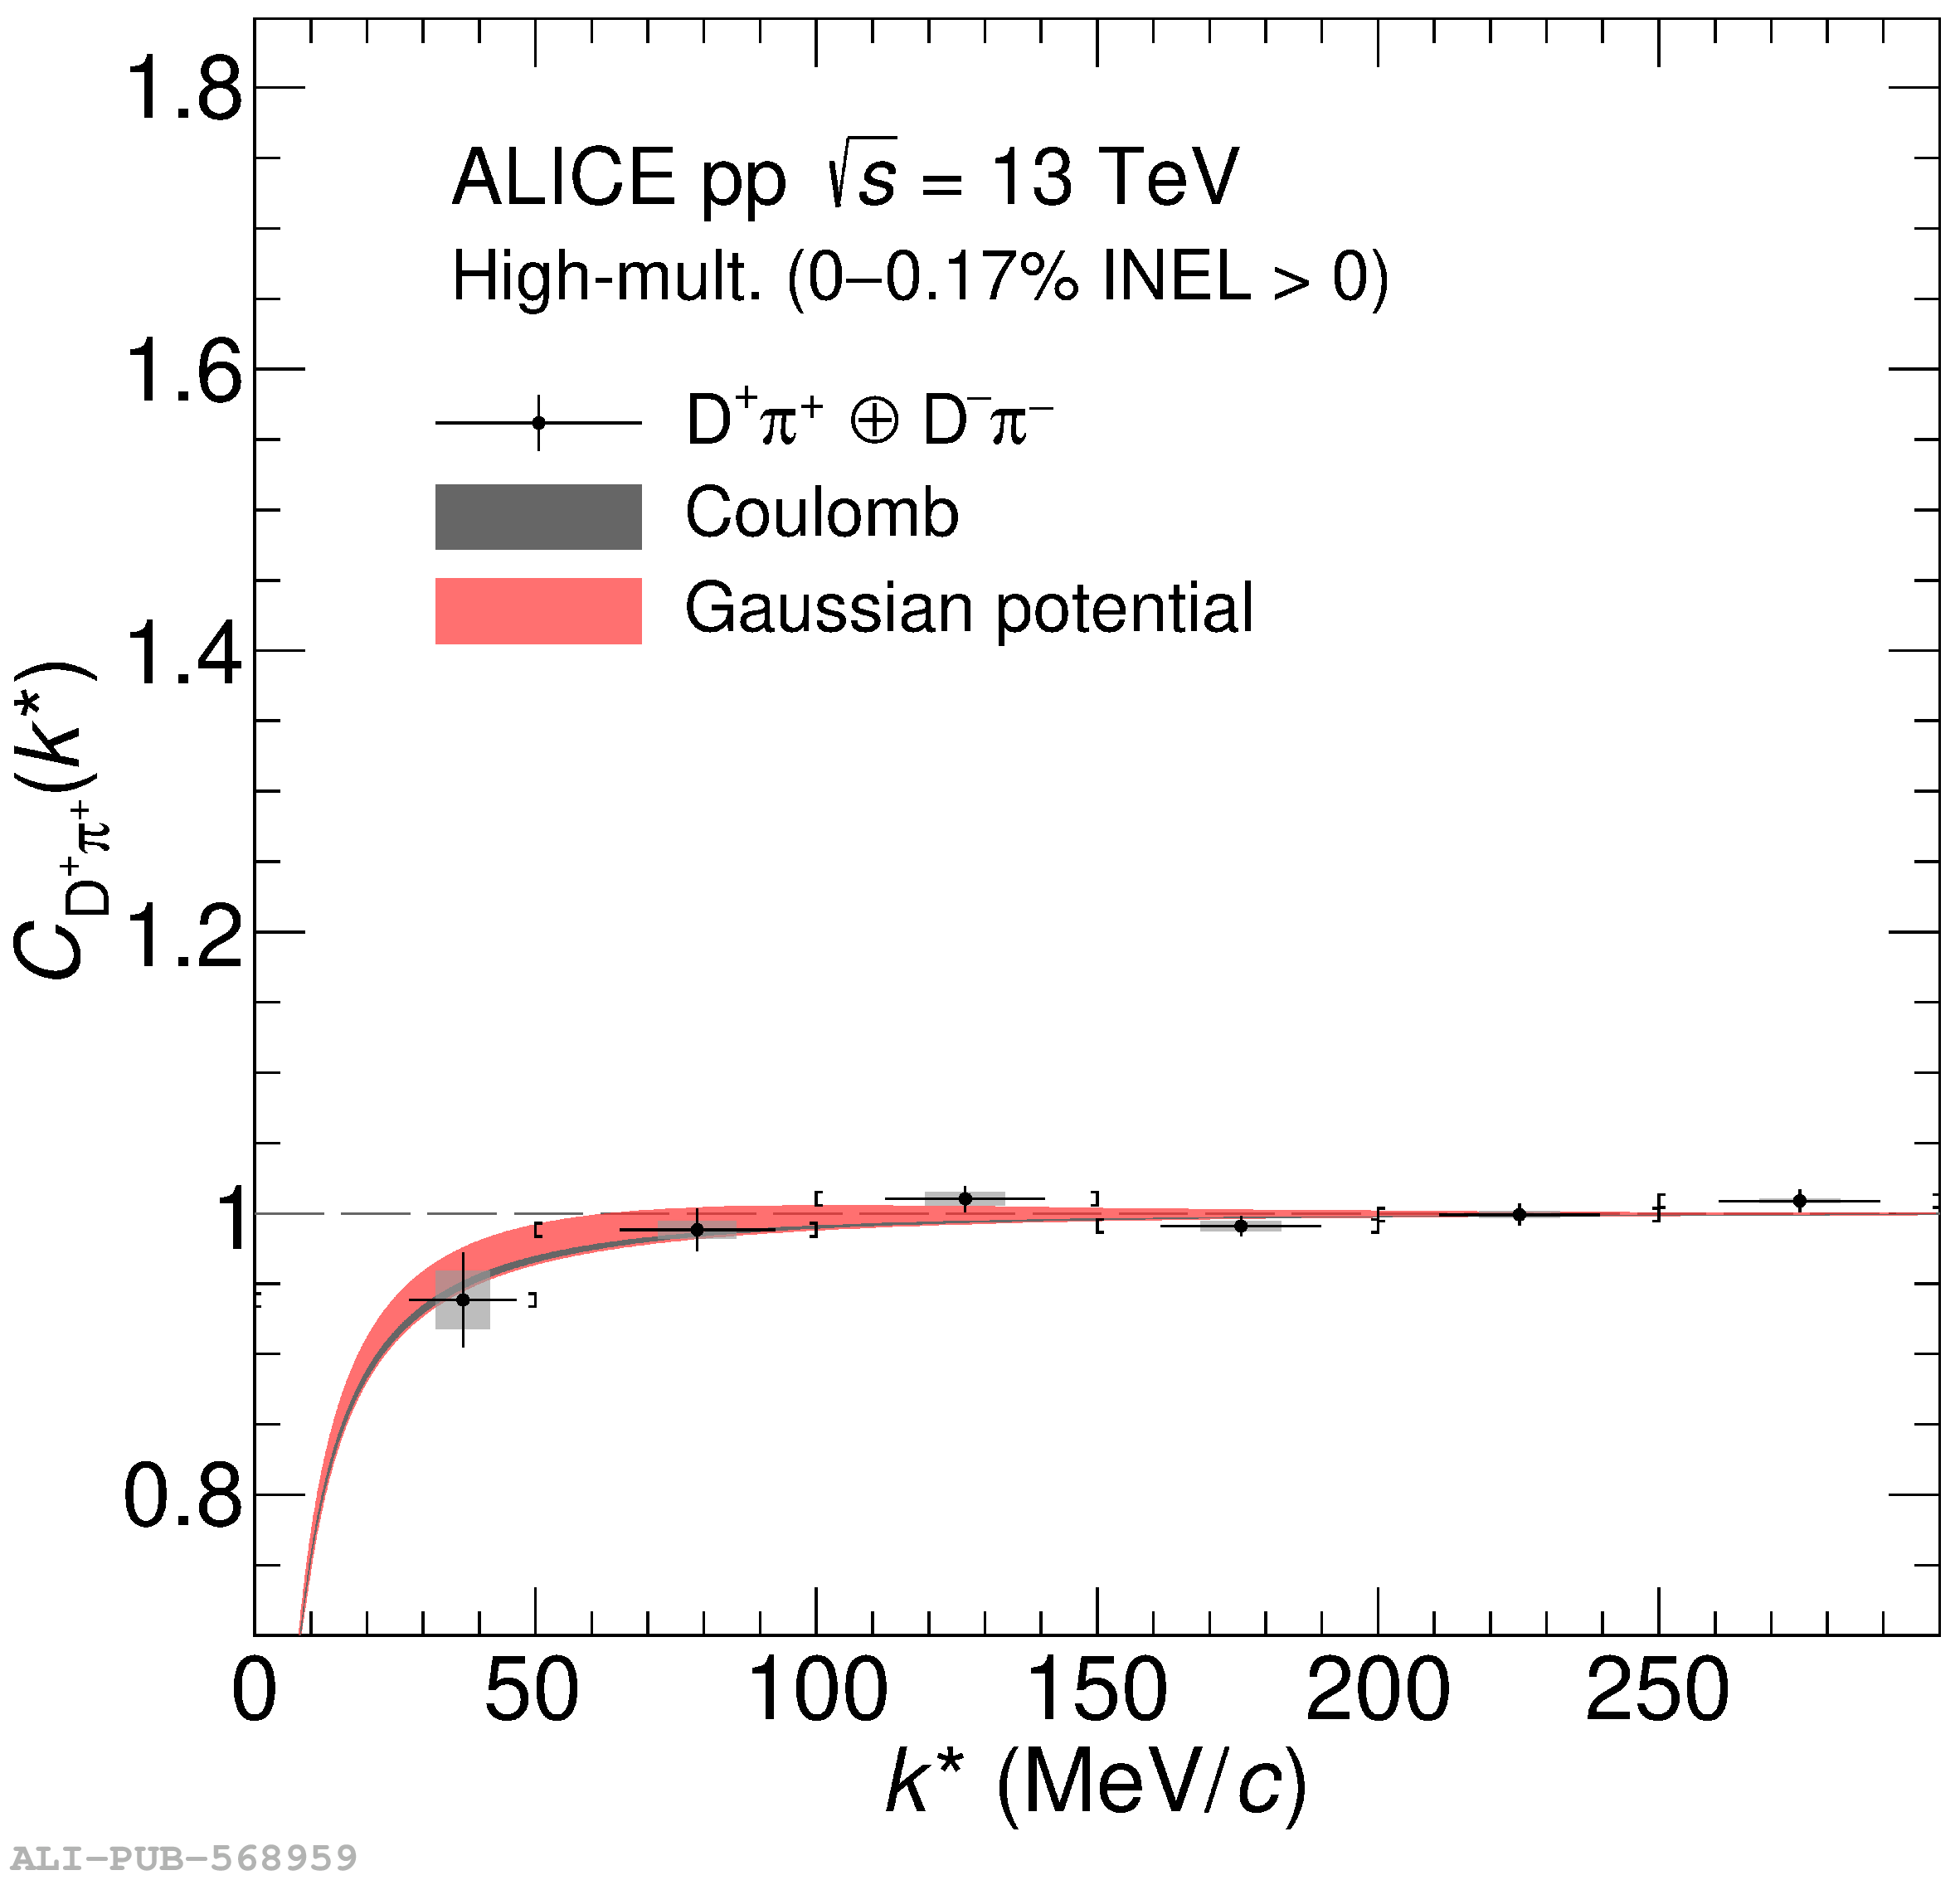 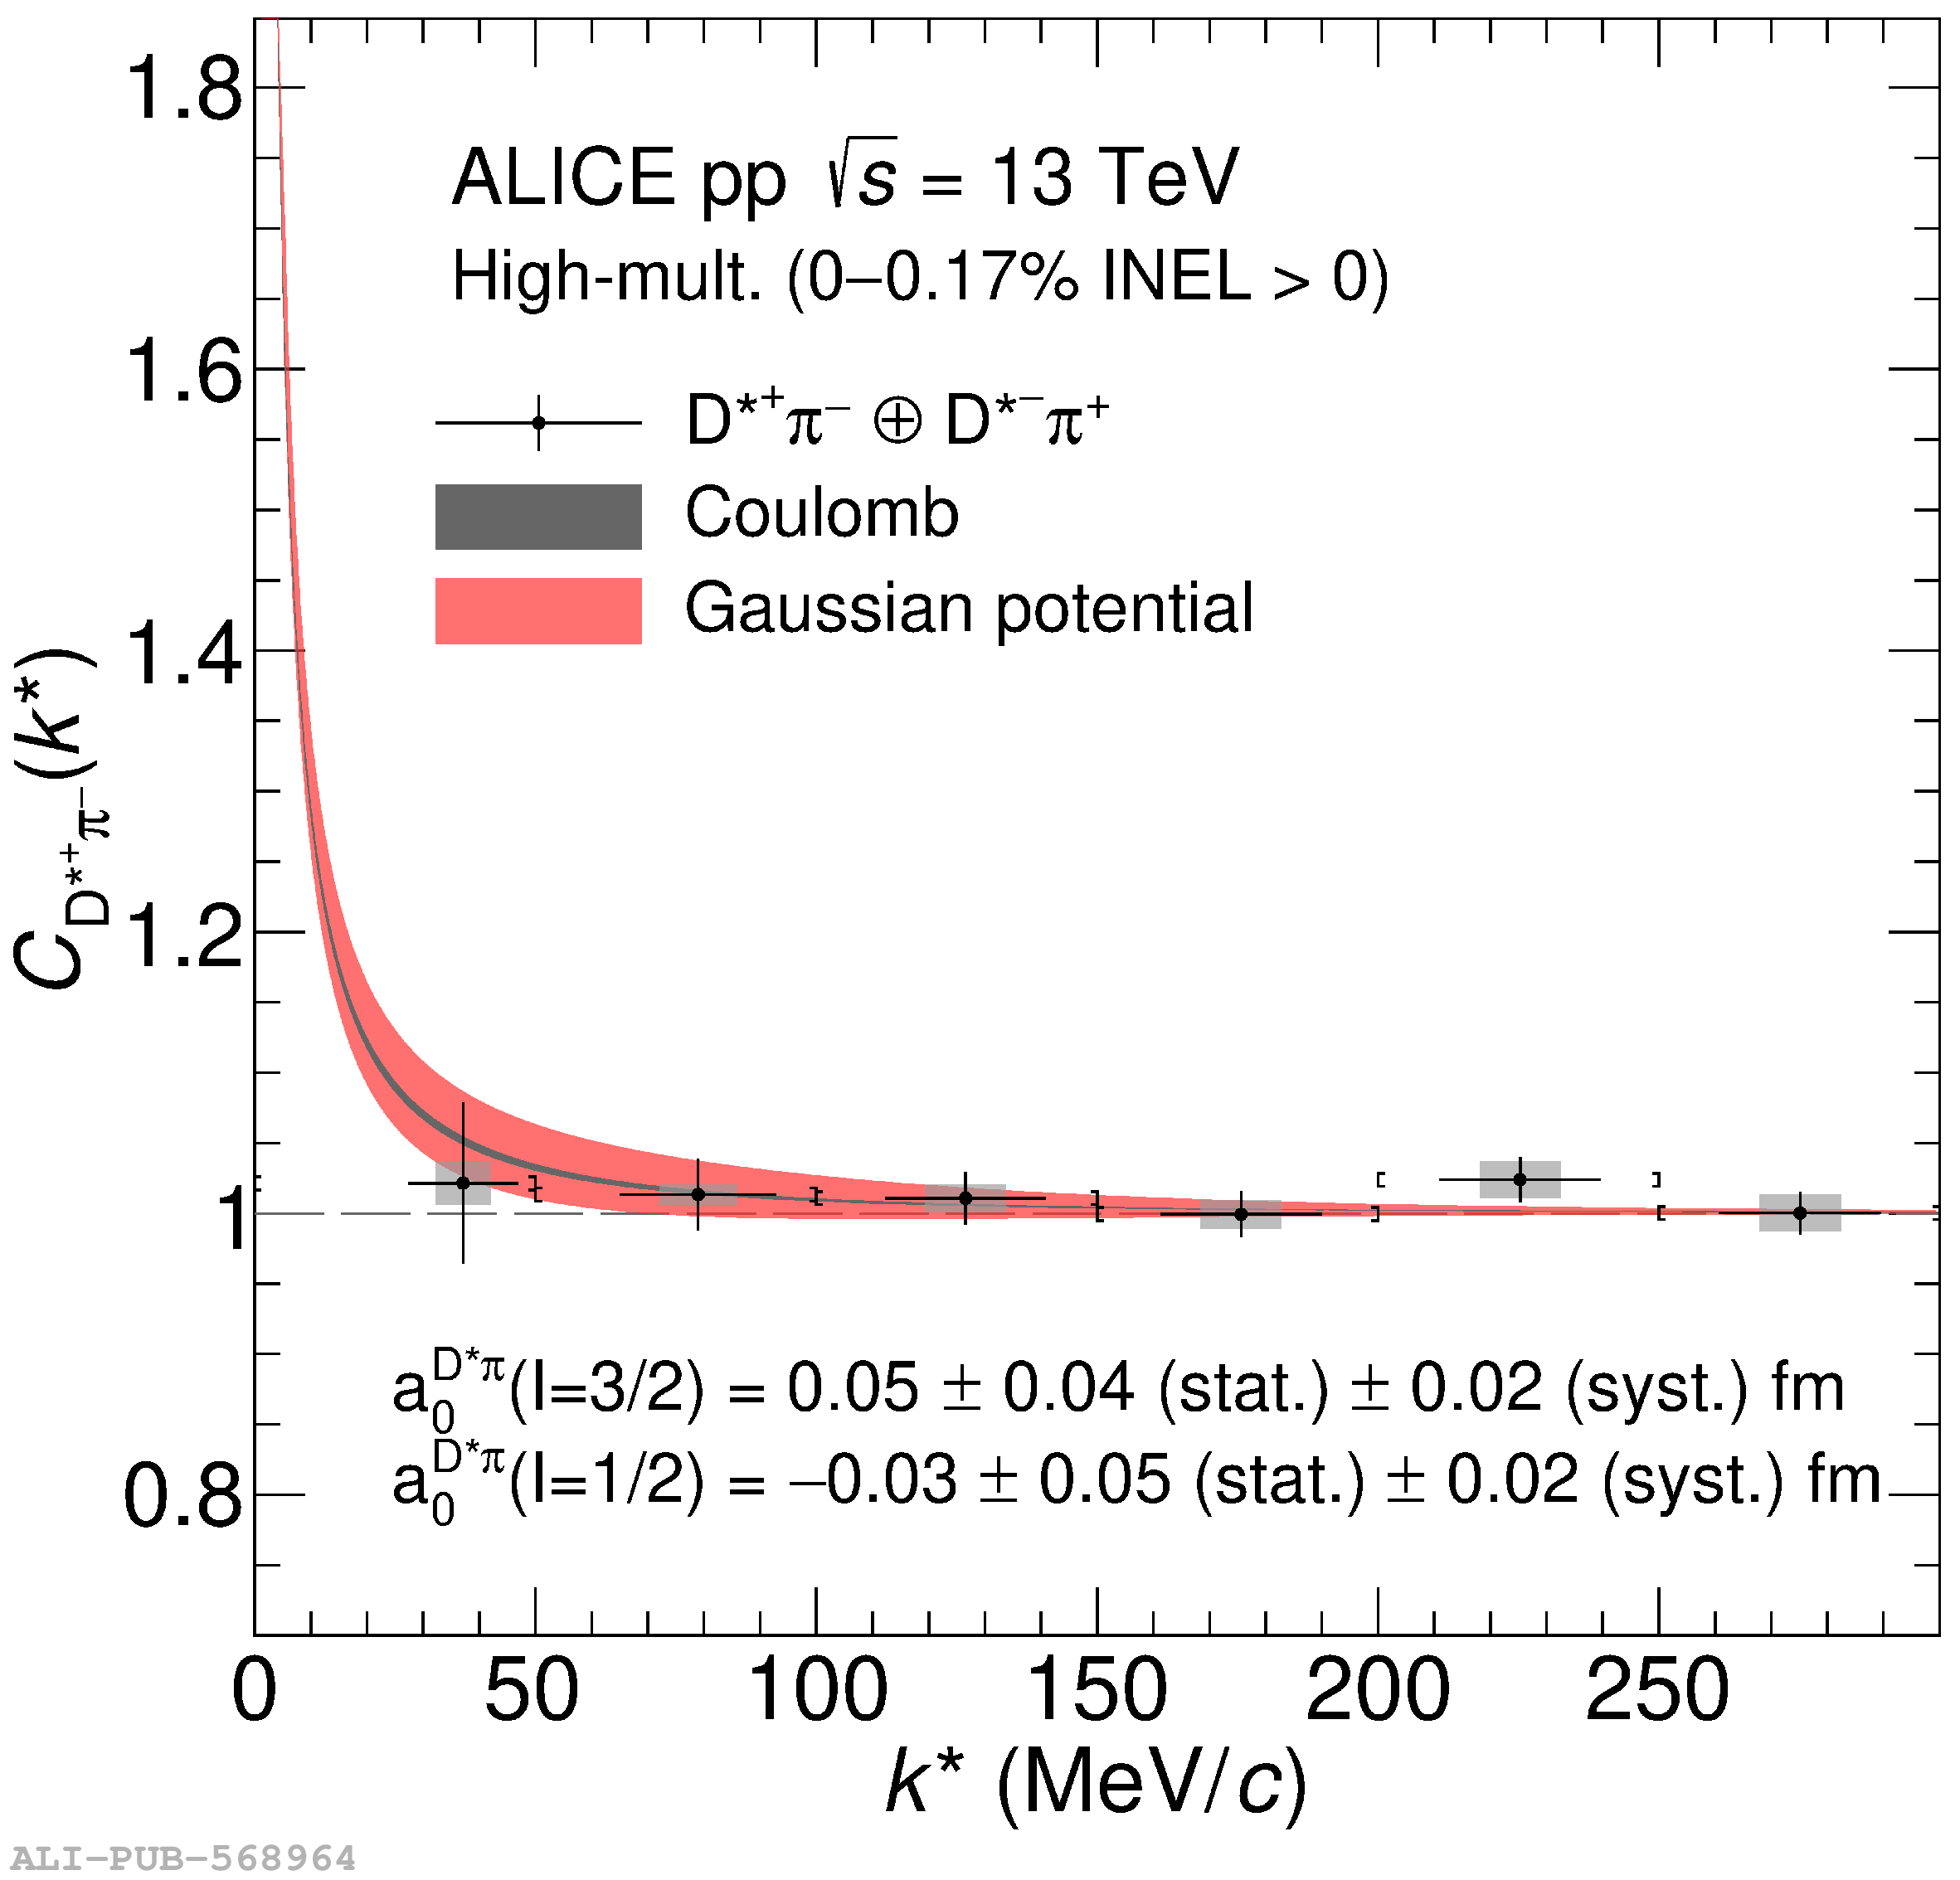 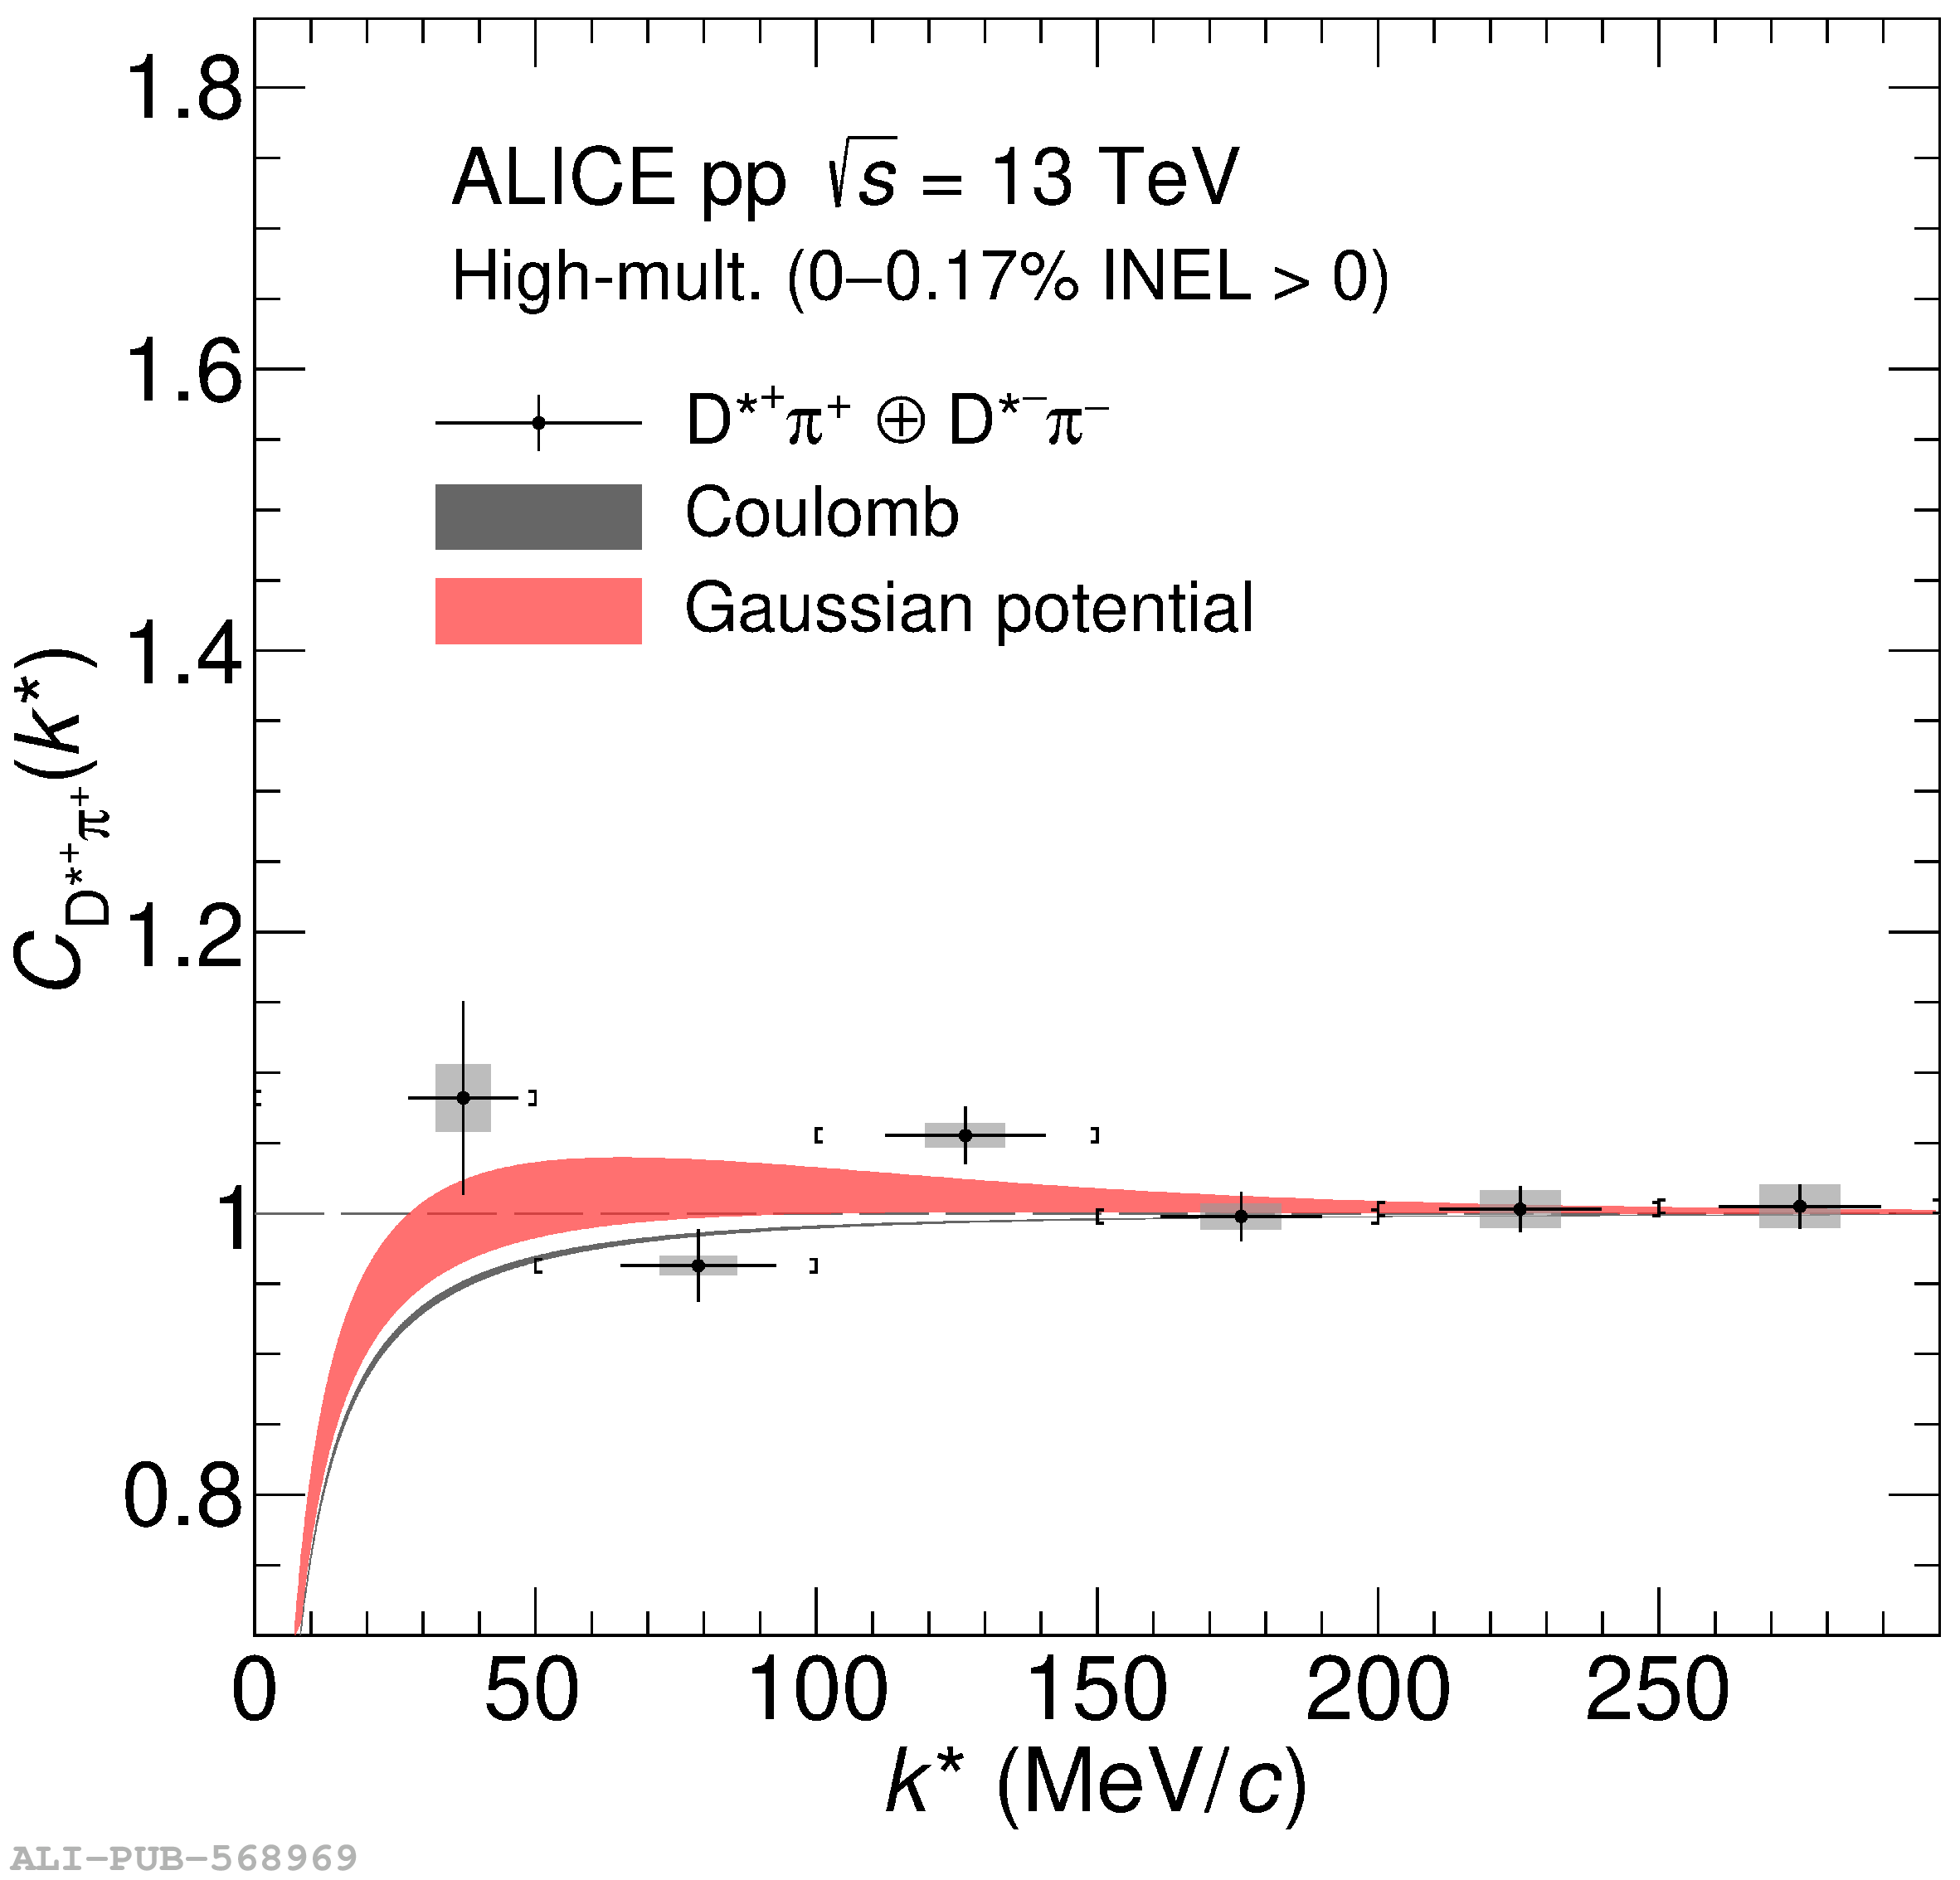 |
Figure 7
Scattering length of the $\mathrm{D}\pi$ (left) and $\mathrm{D^*}\pi$ (right) interaction, for the two isospin channels that characterize the systems. They are extracted from a simultaneous $\chi^2$ minimization to the experimental correlation functions. The red (orange) areas represent the resulting confidence intervals for a 68% (95%) probability. The dashed lines correspond to Coulomb interaction only, as the scattering lengths of the strong interaction vanish. As comparison, the available theoretical predictions , listed in Tables IV and V are shown as well. | 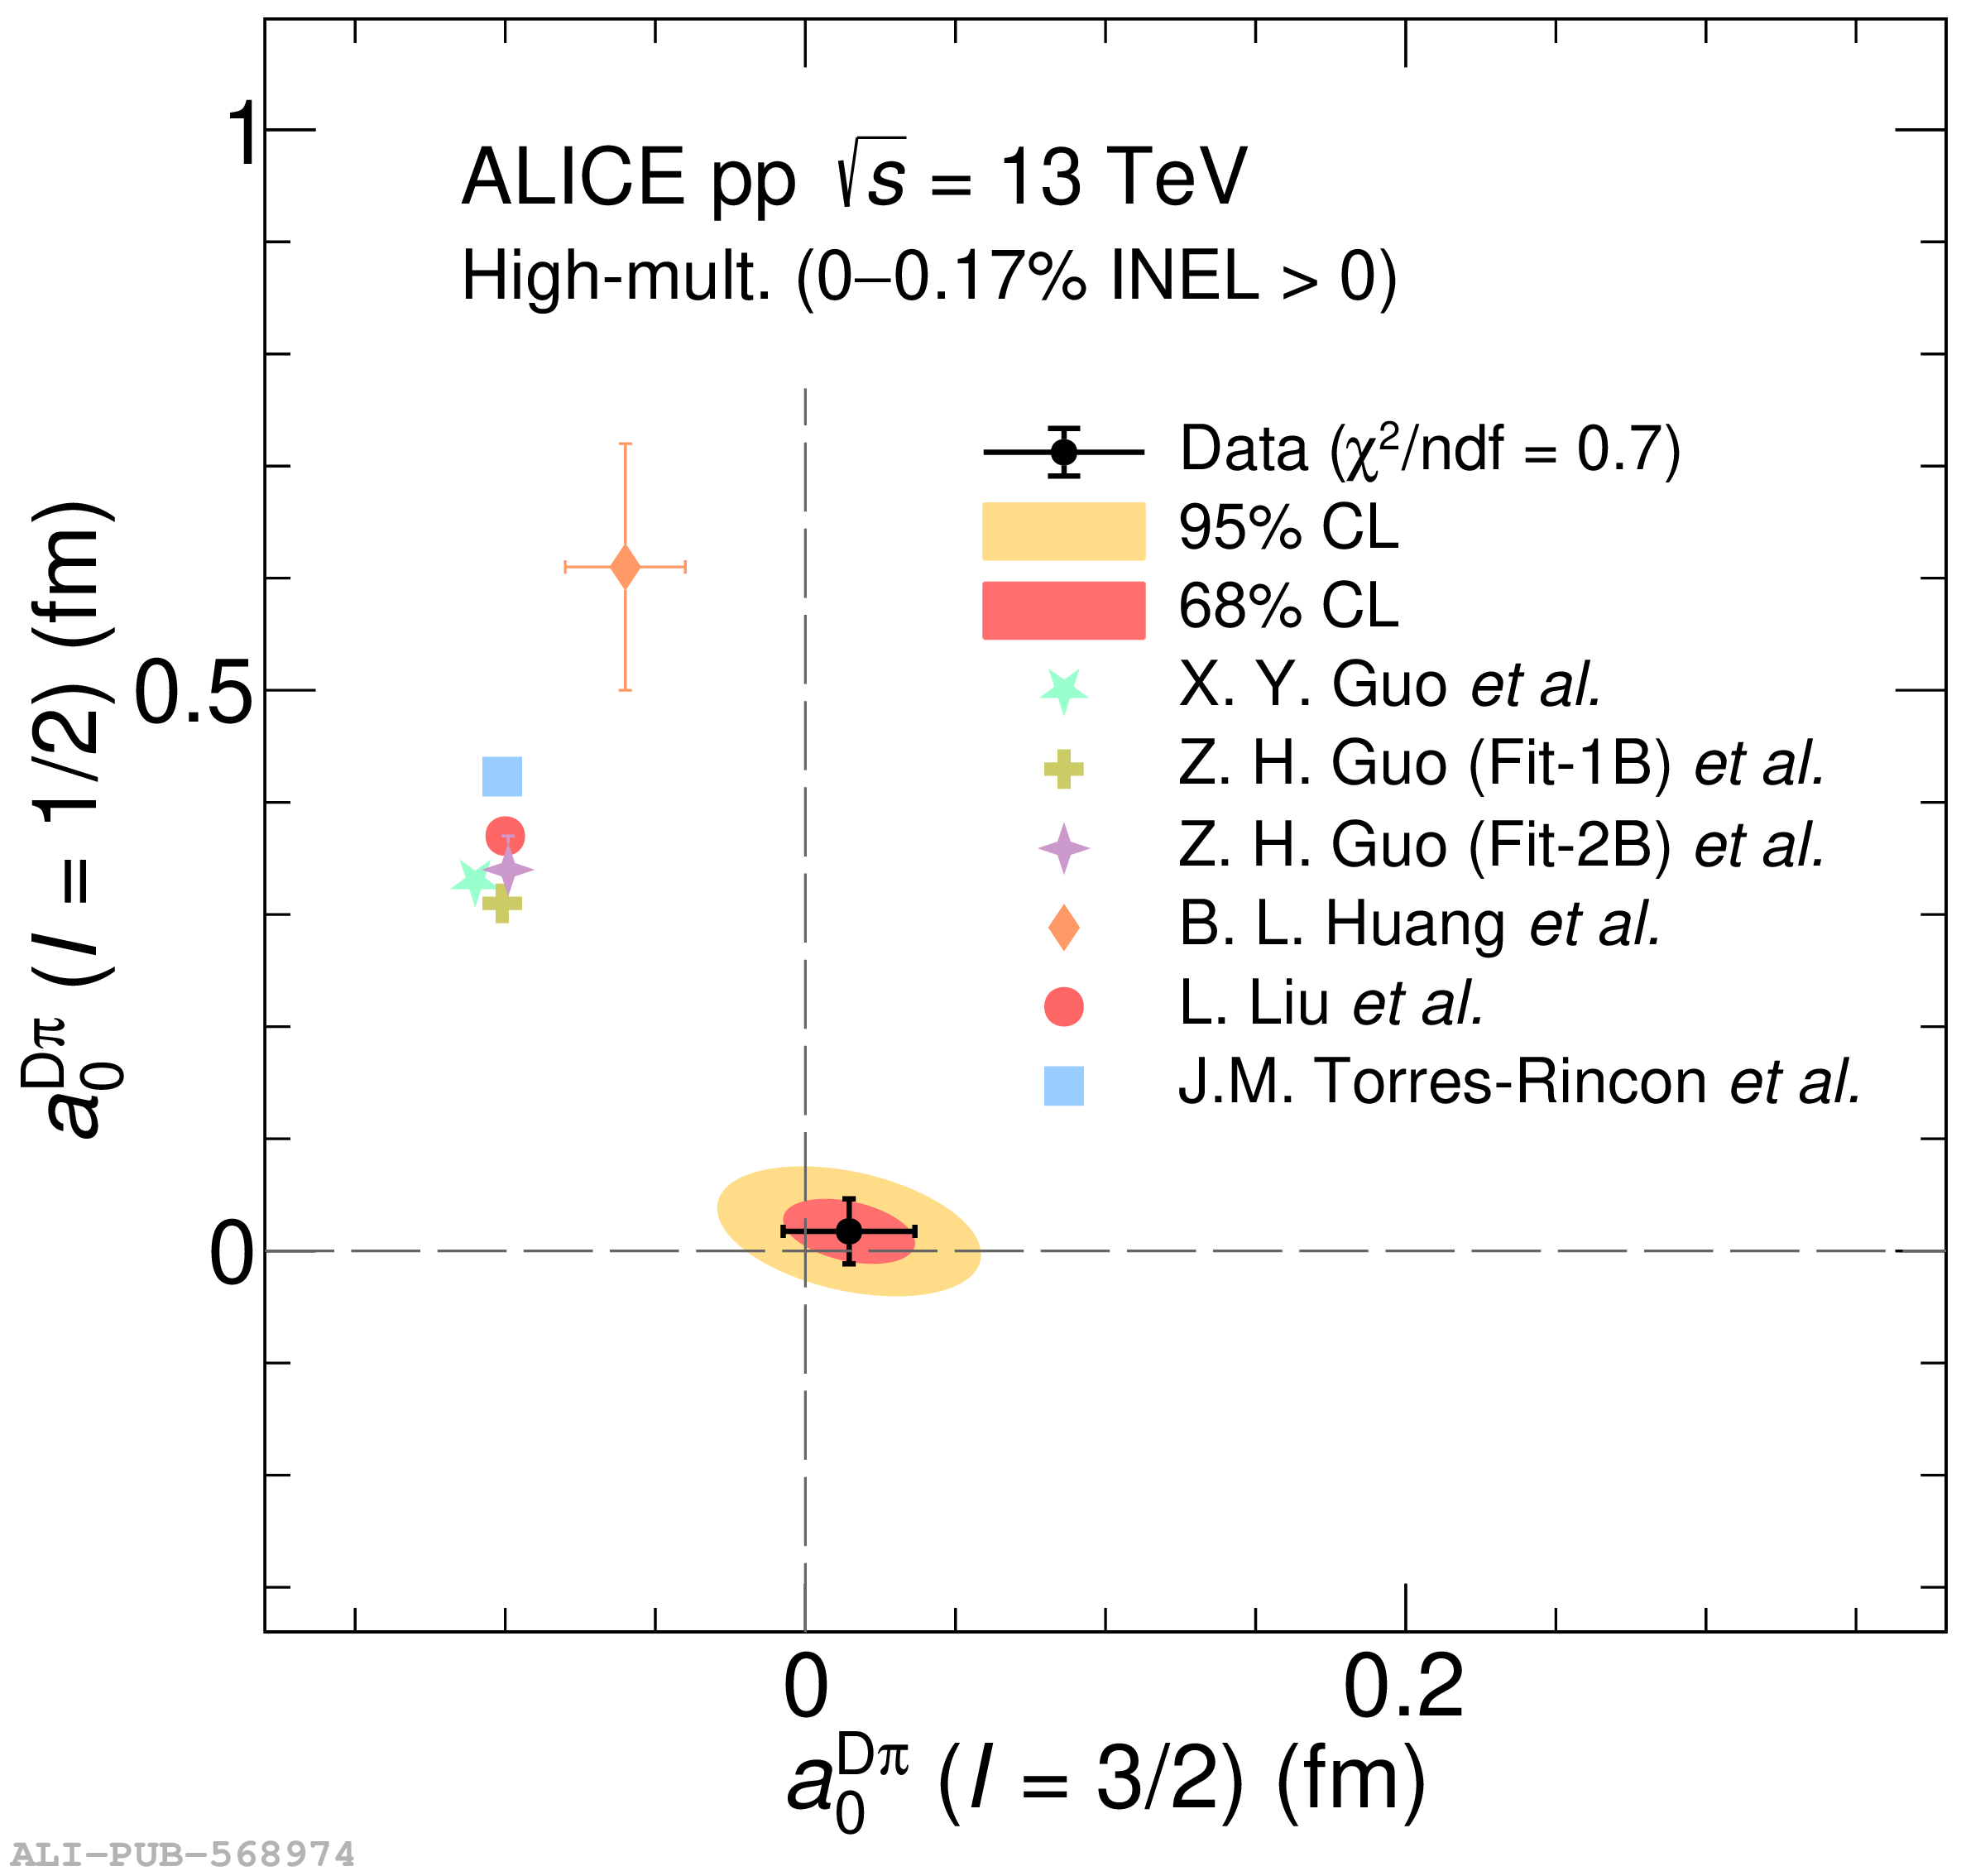 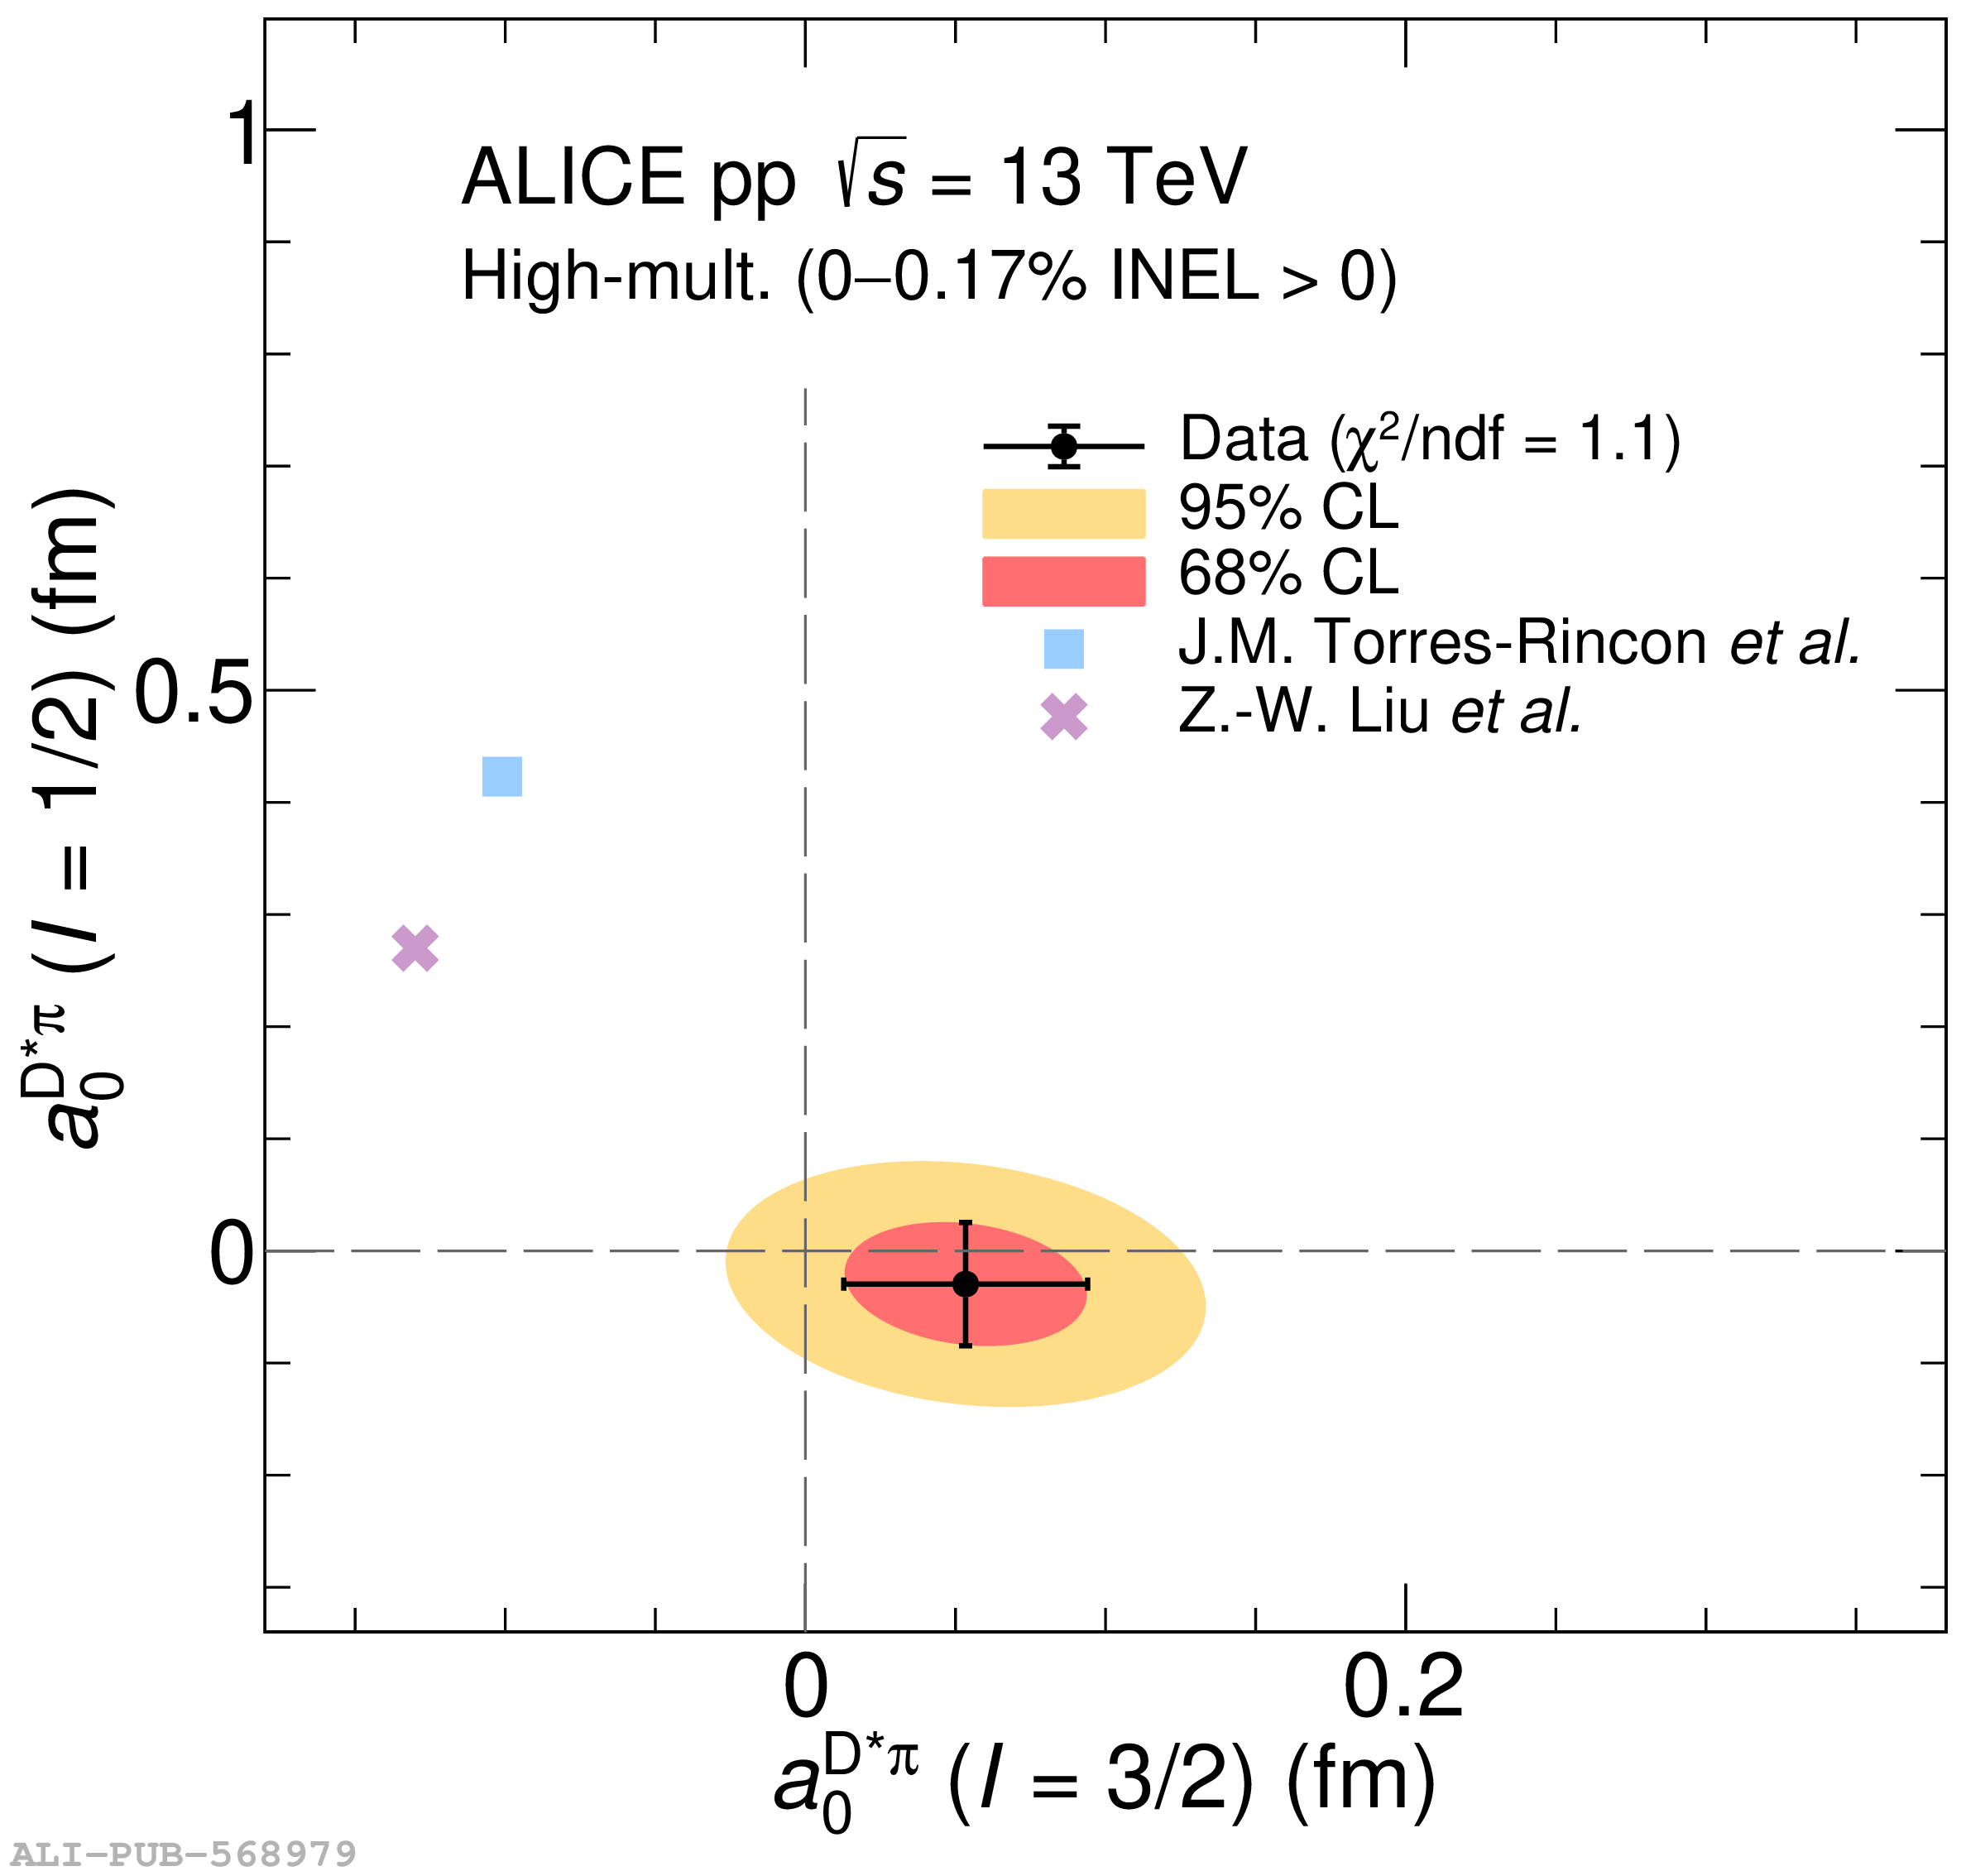 |