Genuine correlation functions with statistical (bars) and systematic uncertainties (boxes) compared to theoretical model predictions (bands), listed in Tables \ref{tab:scatParamPi} and \ref{tab:scatParamK}. The width of the theoretical bands represents the uncertainty related to the source. The number of standard deviations $n_{\sigma}$ is reported for each model in the legend. The results are shown for \DPi (first row) and DK (second row) for the opposite- (left column) and same-charge (right column) combinations. | 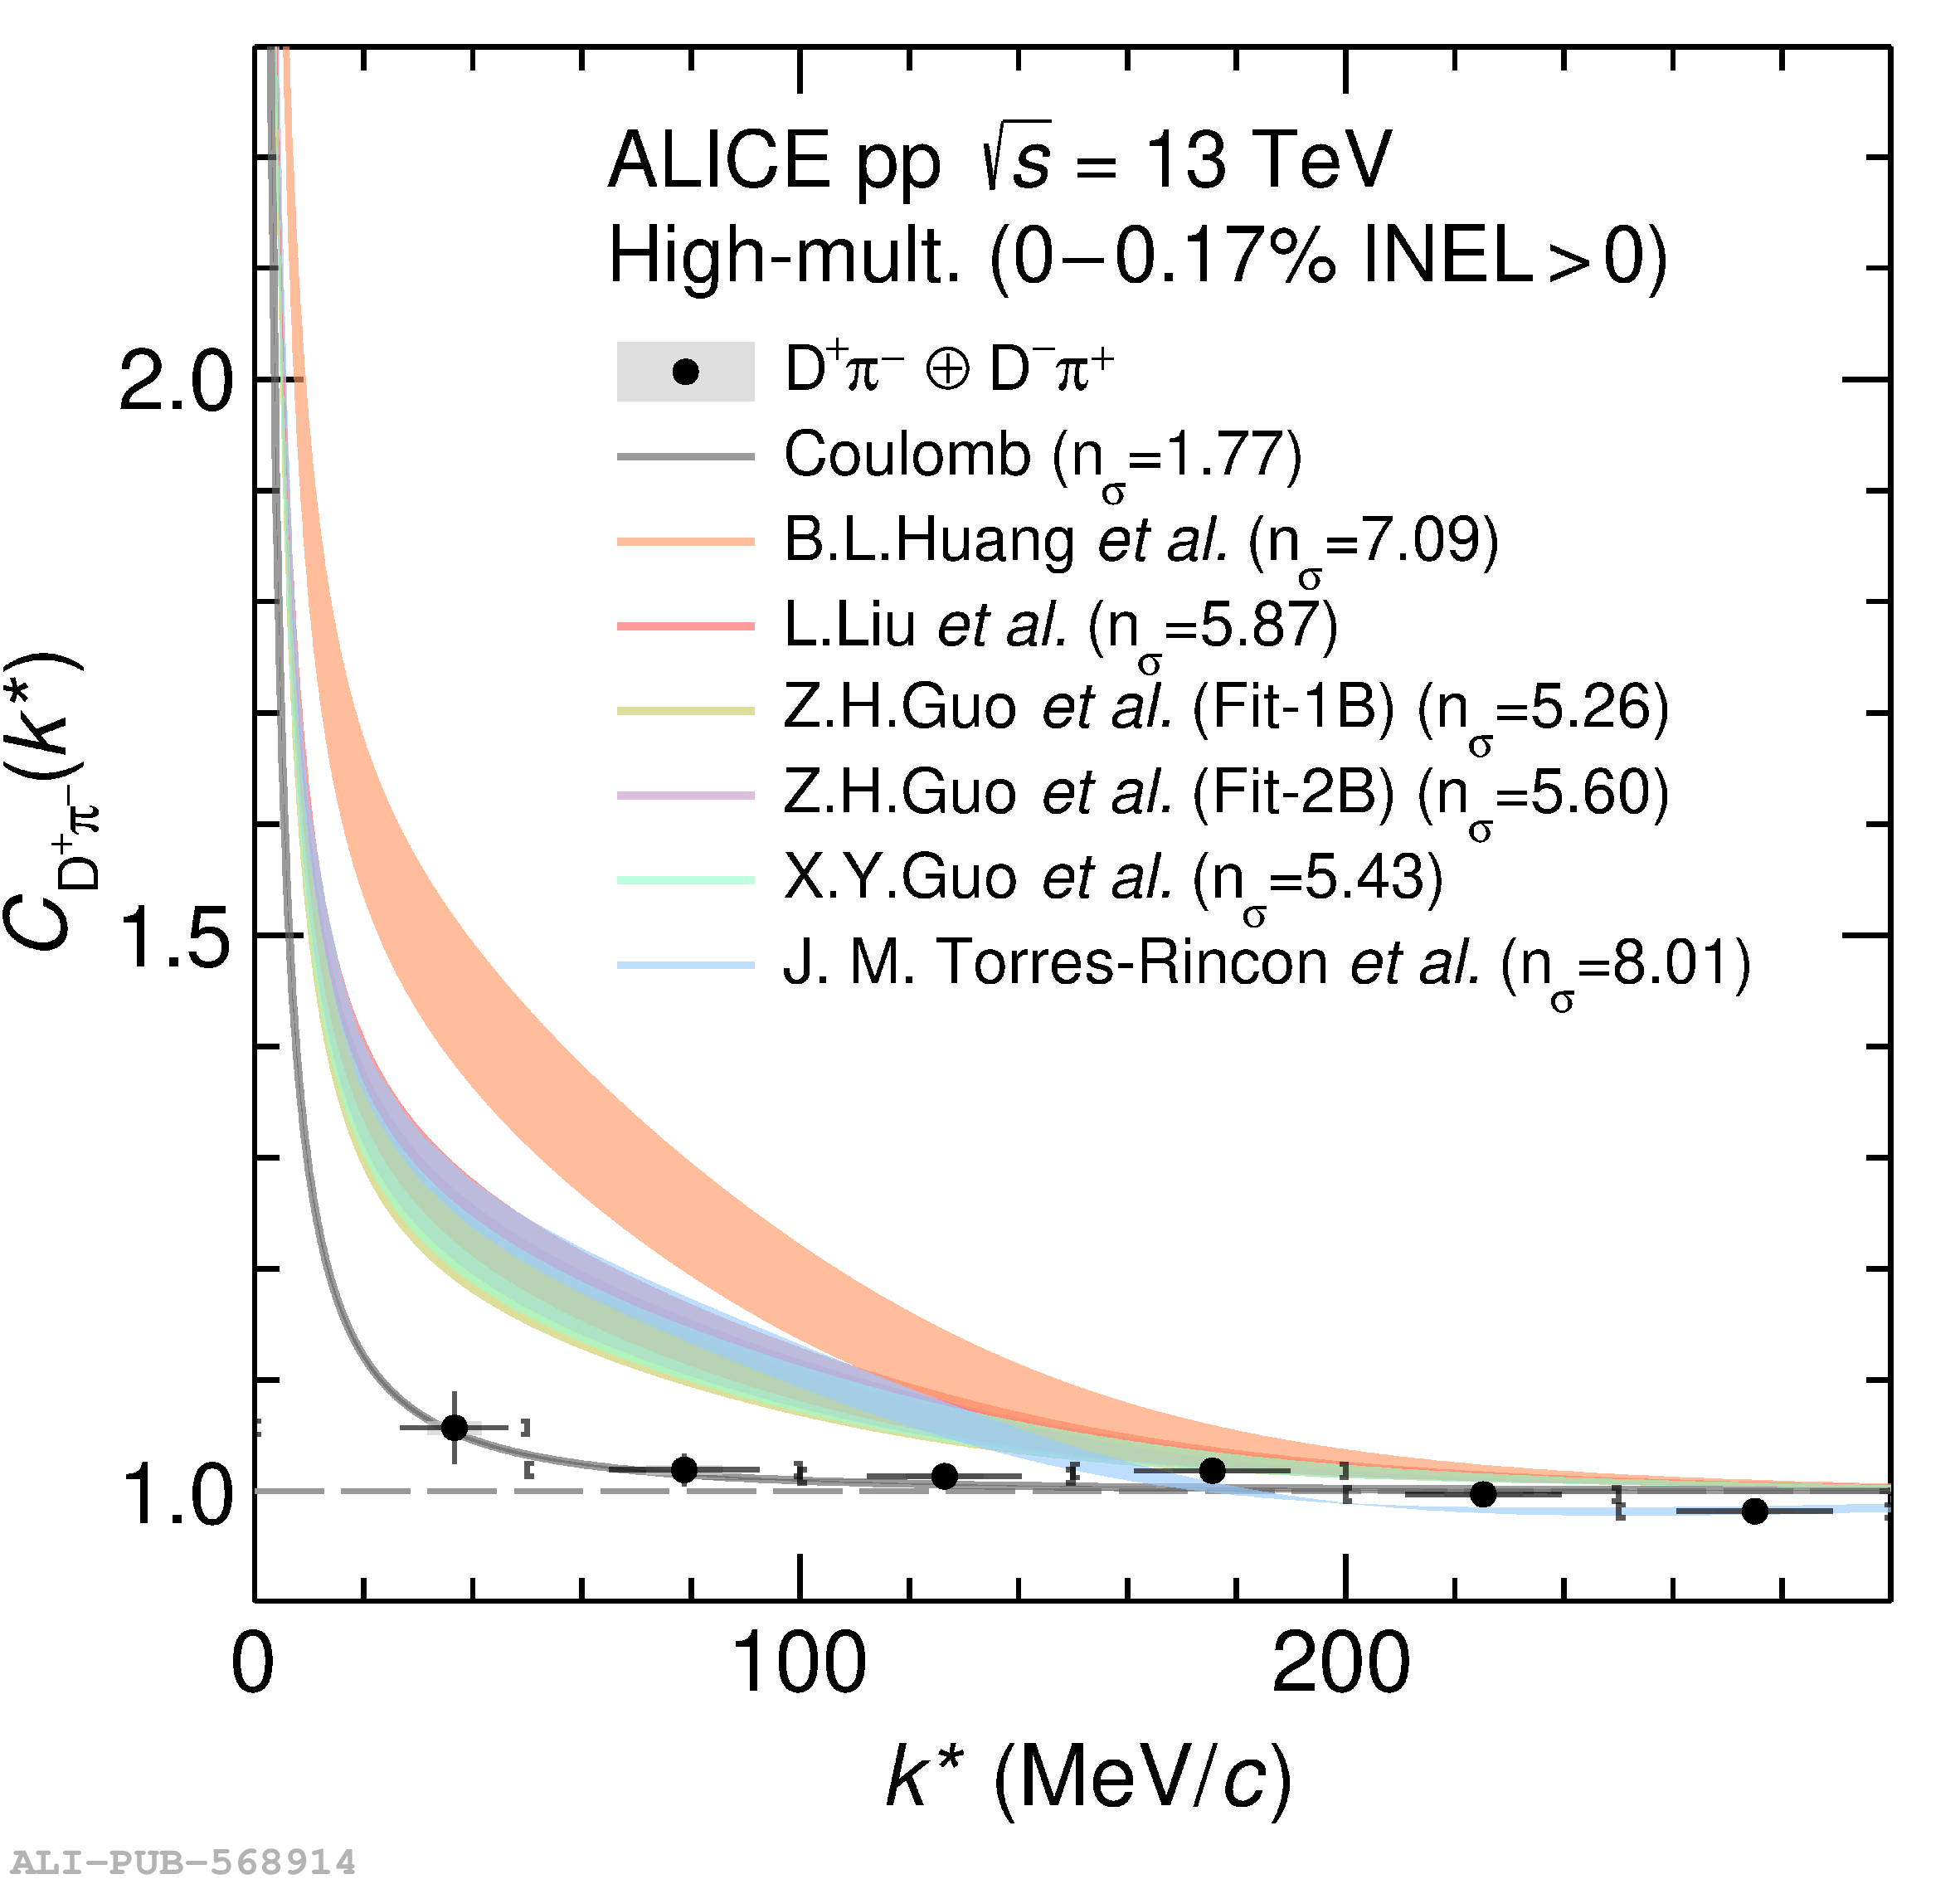 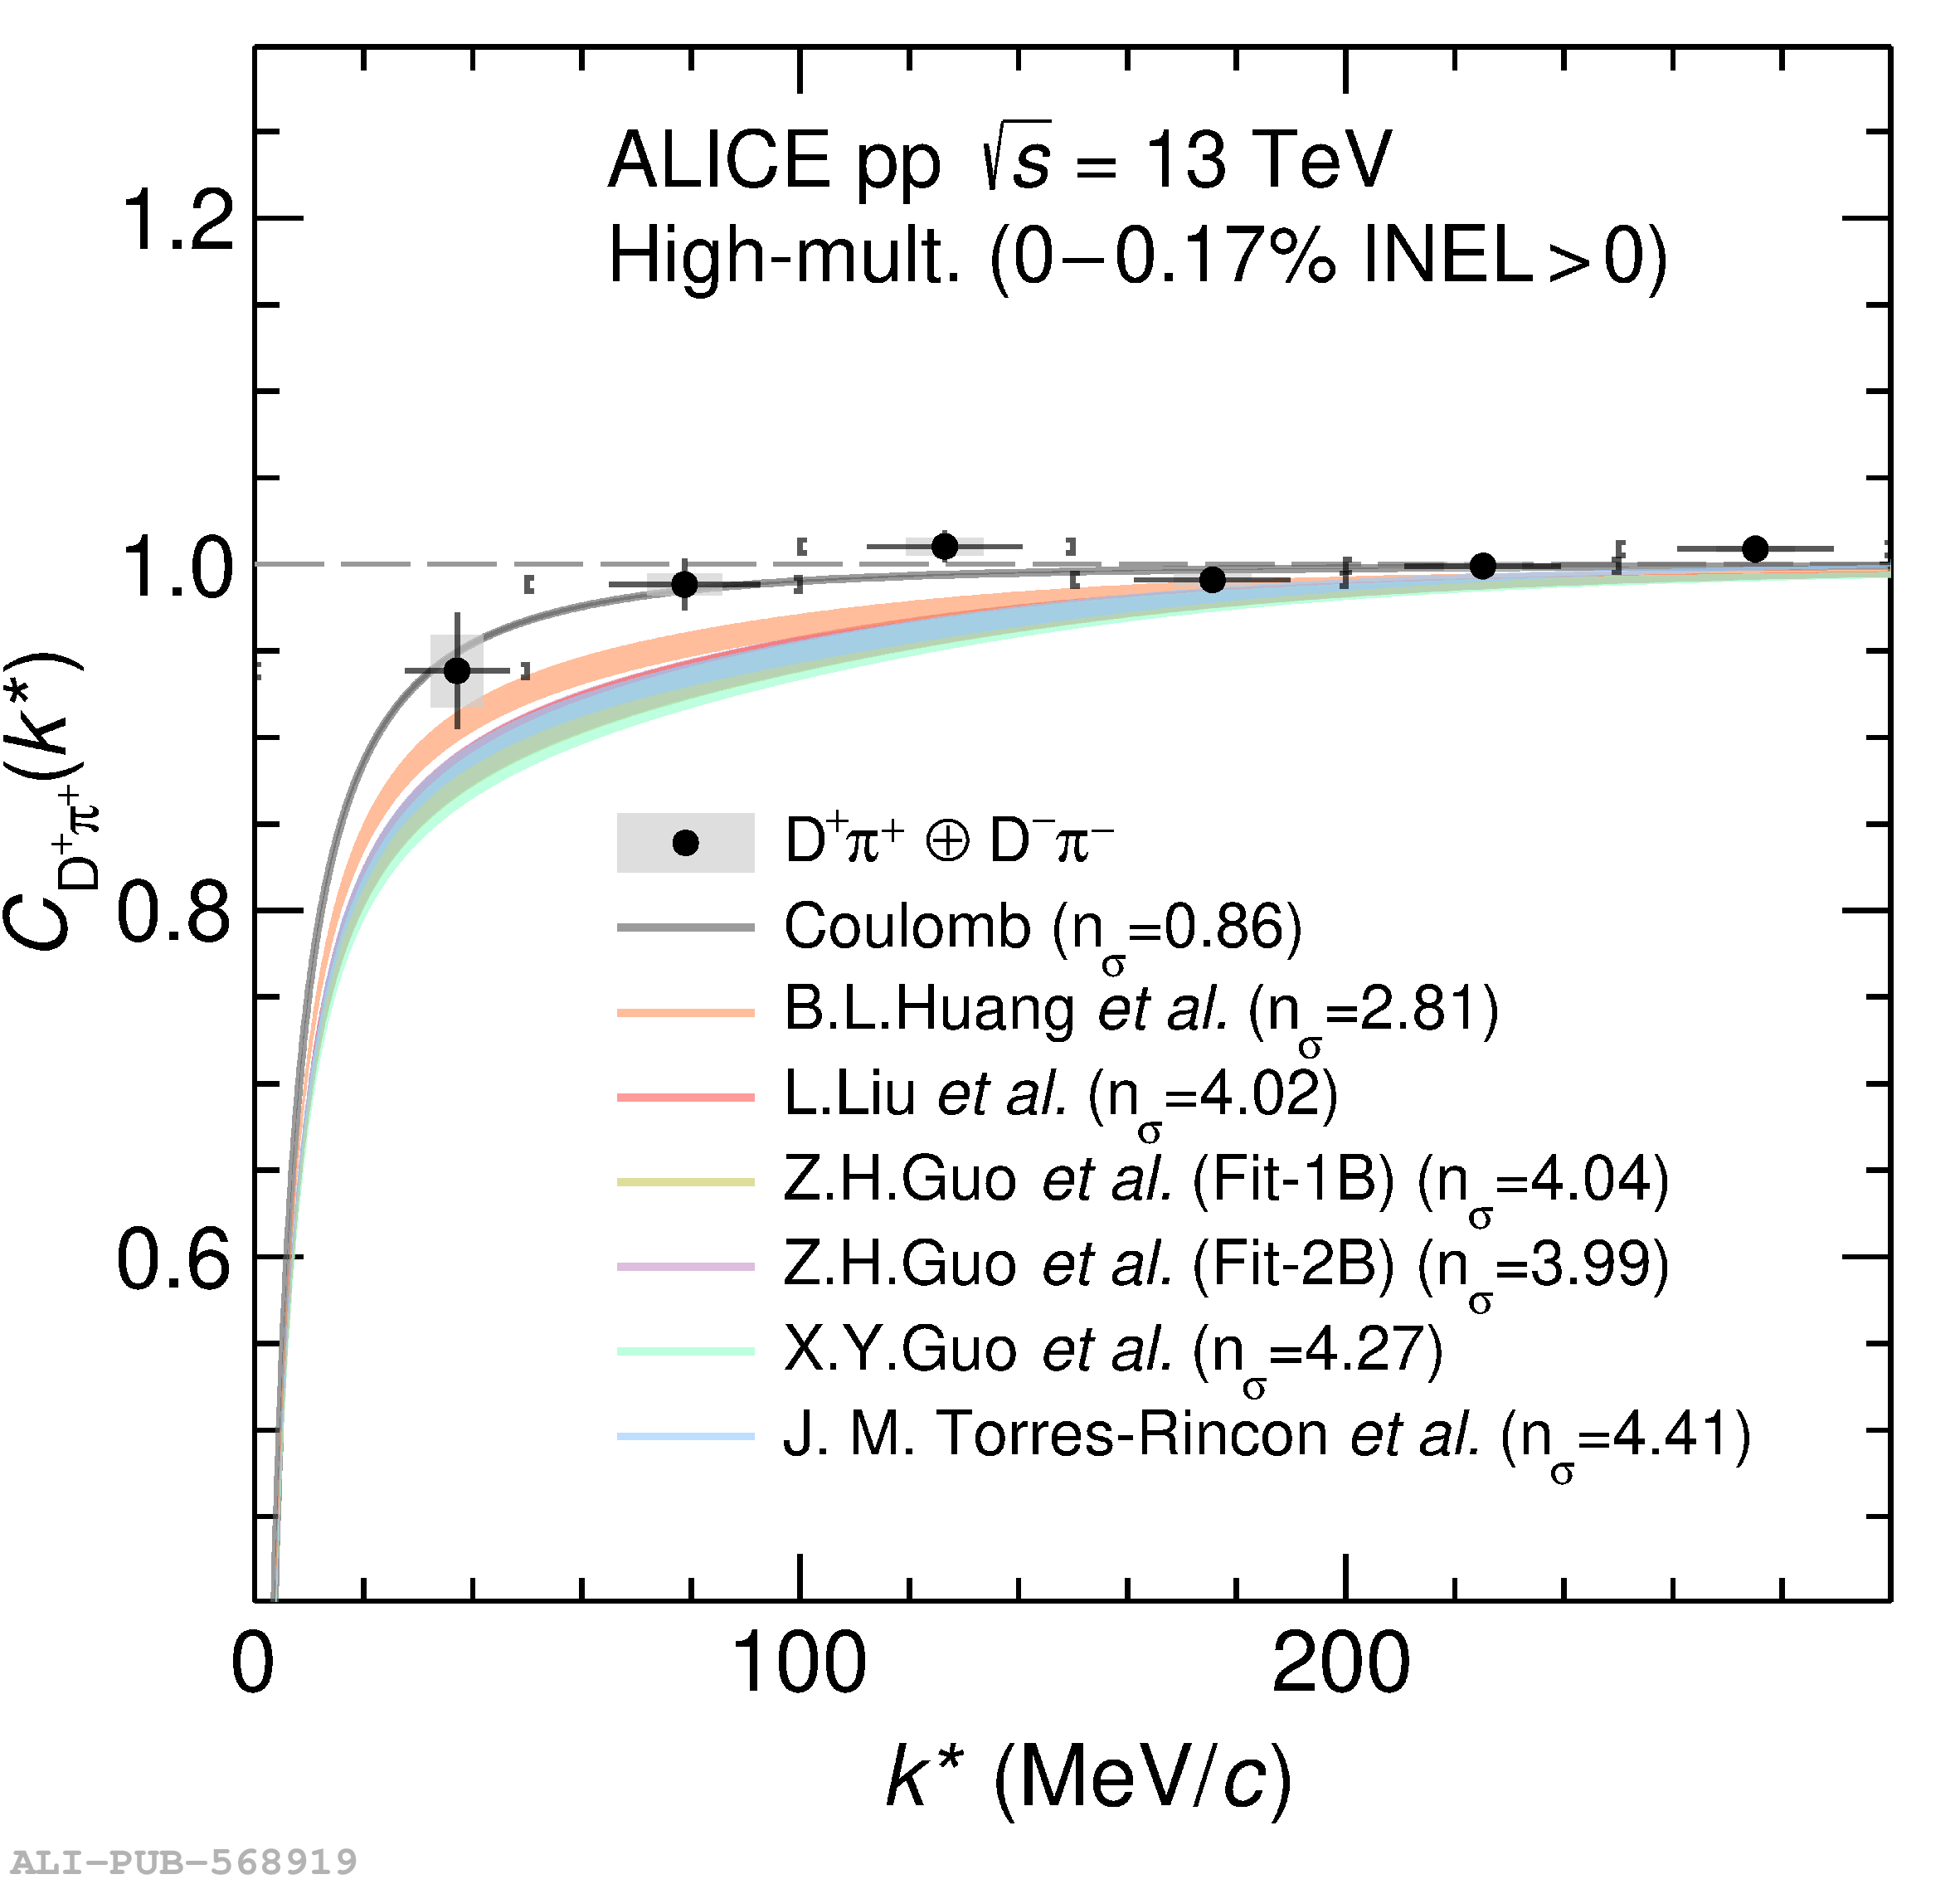 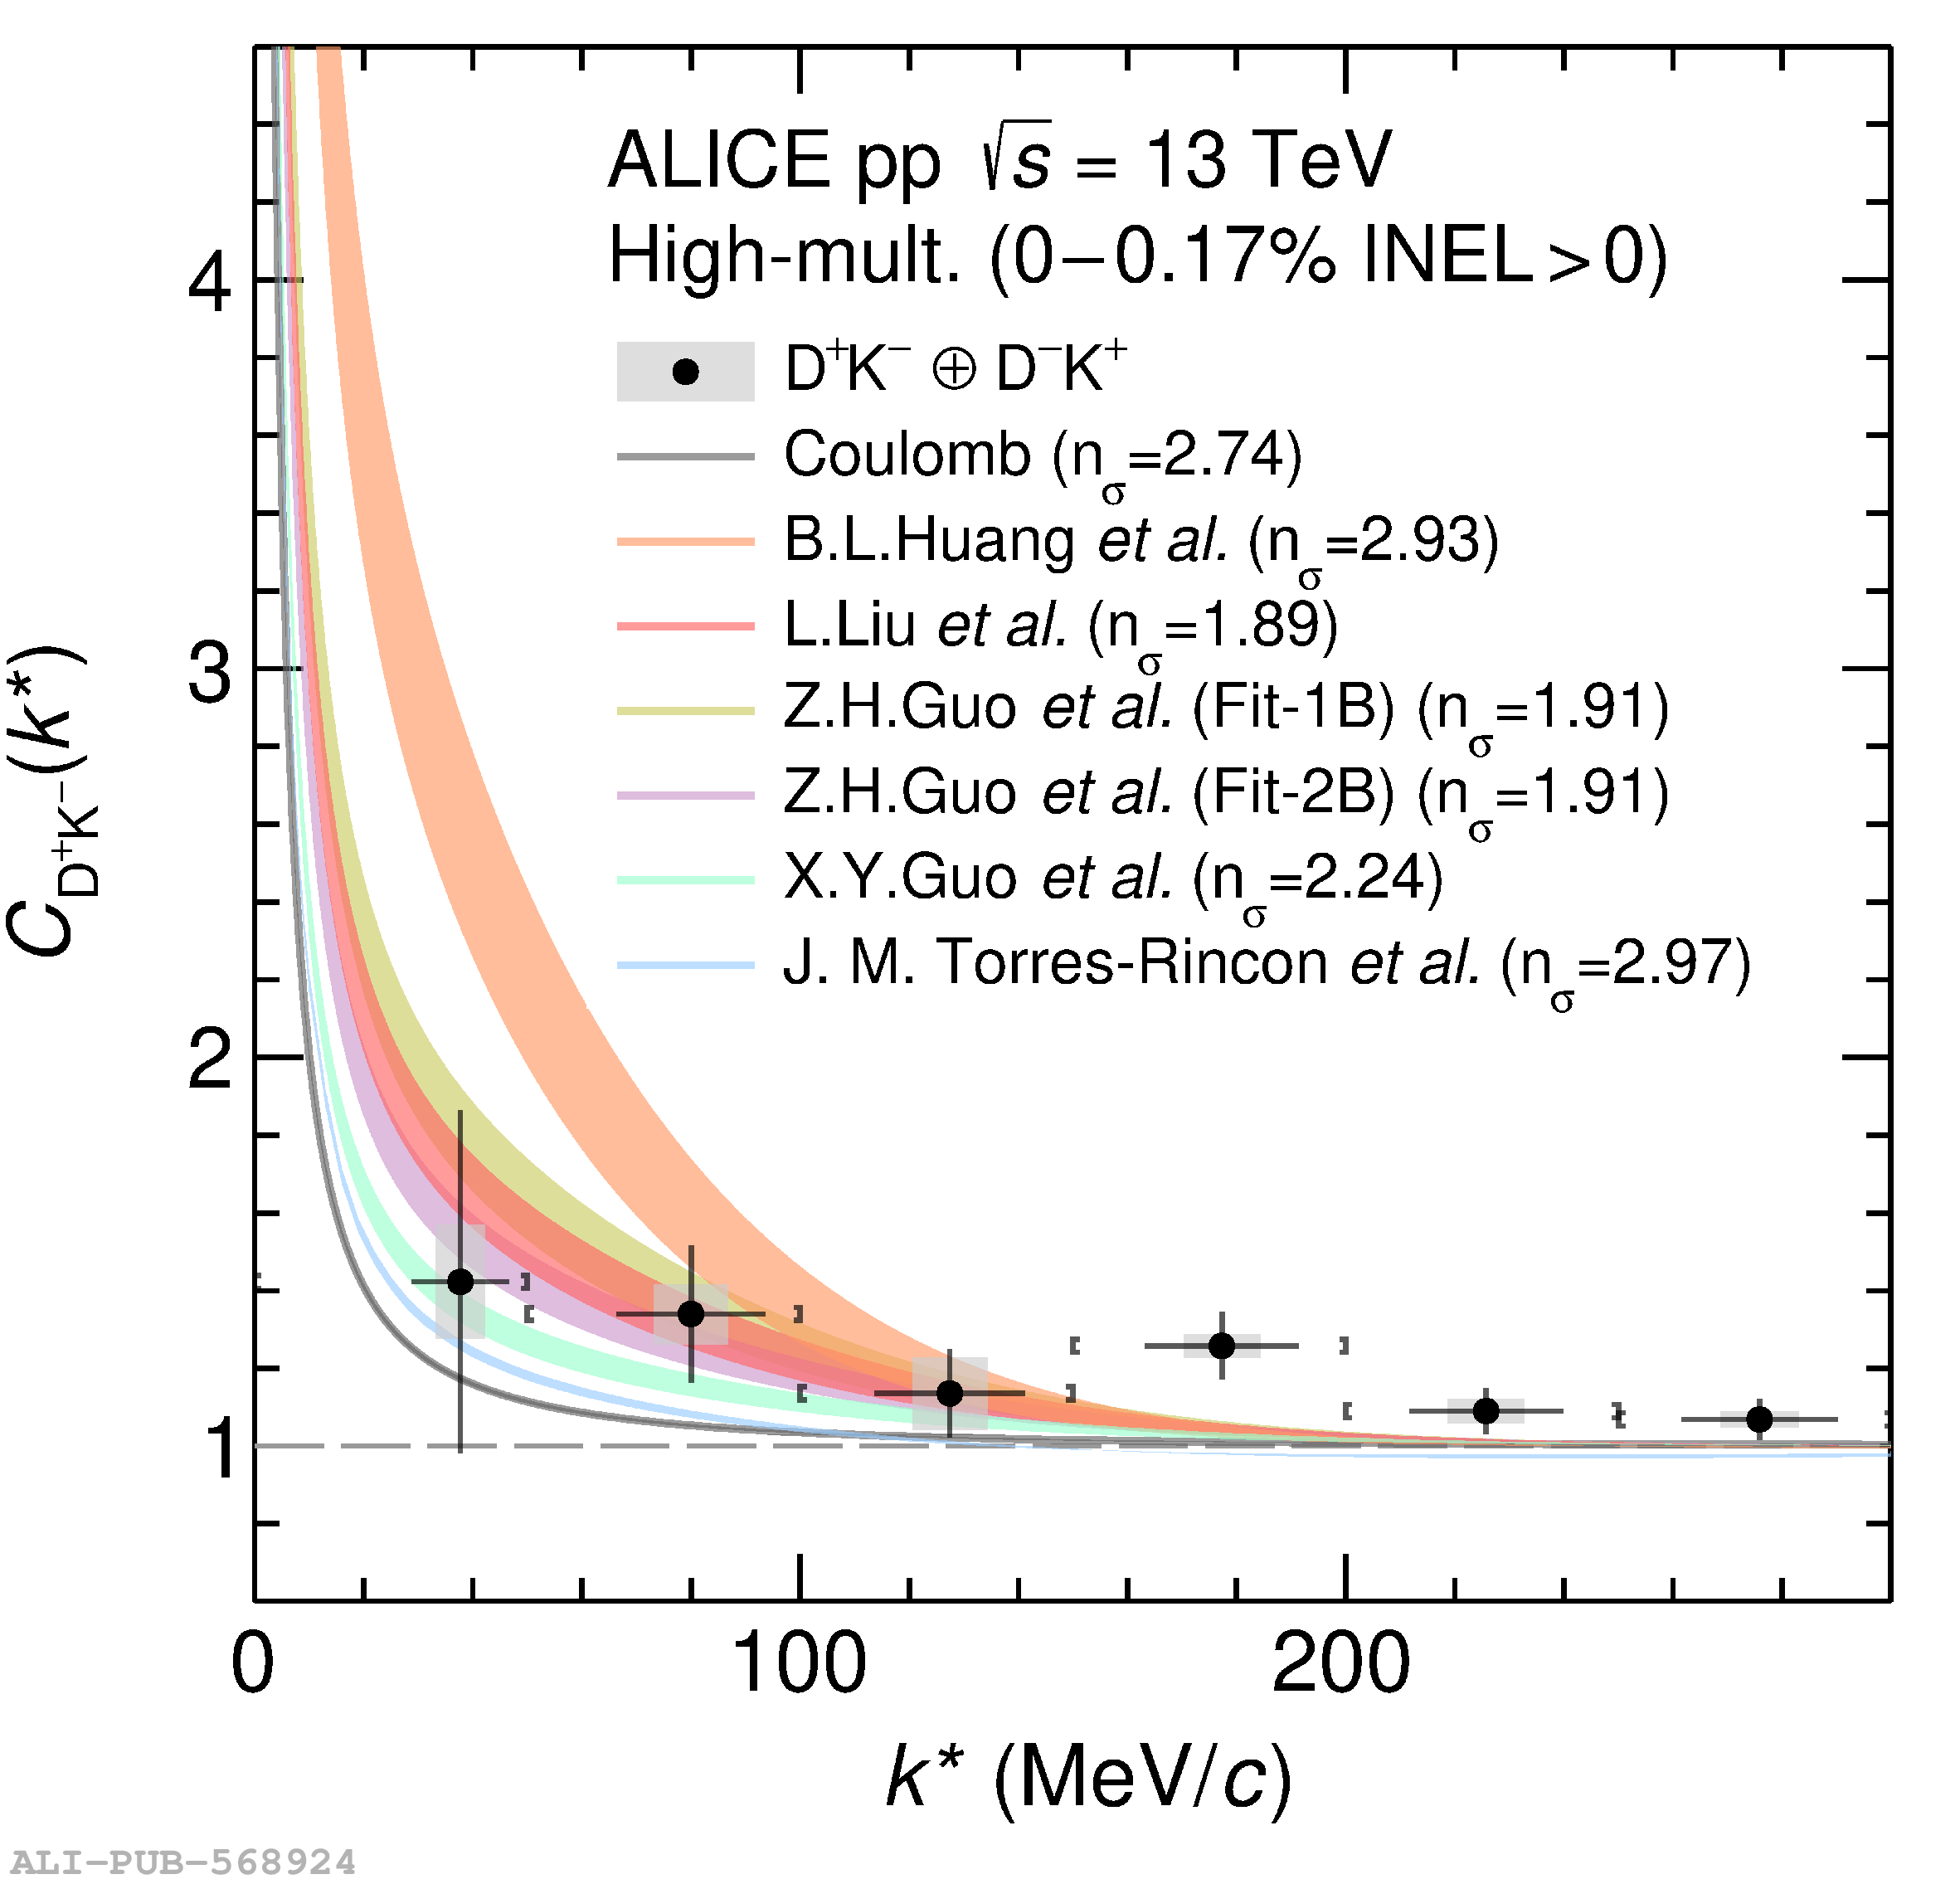 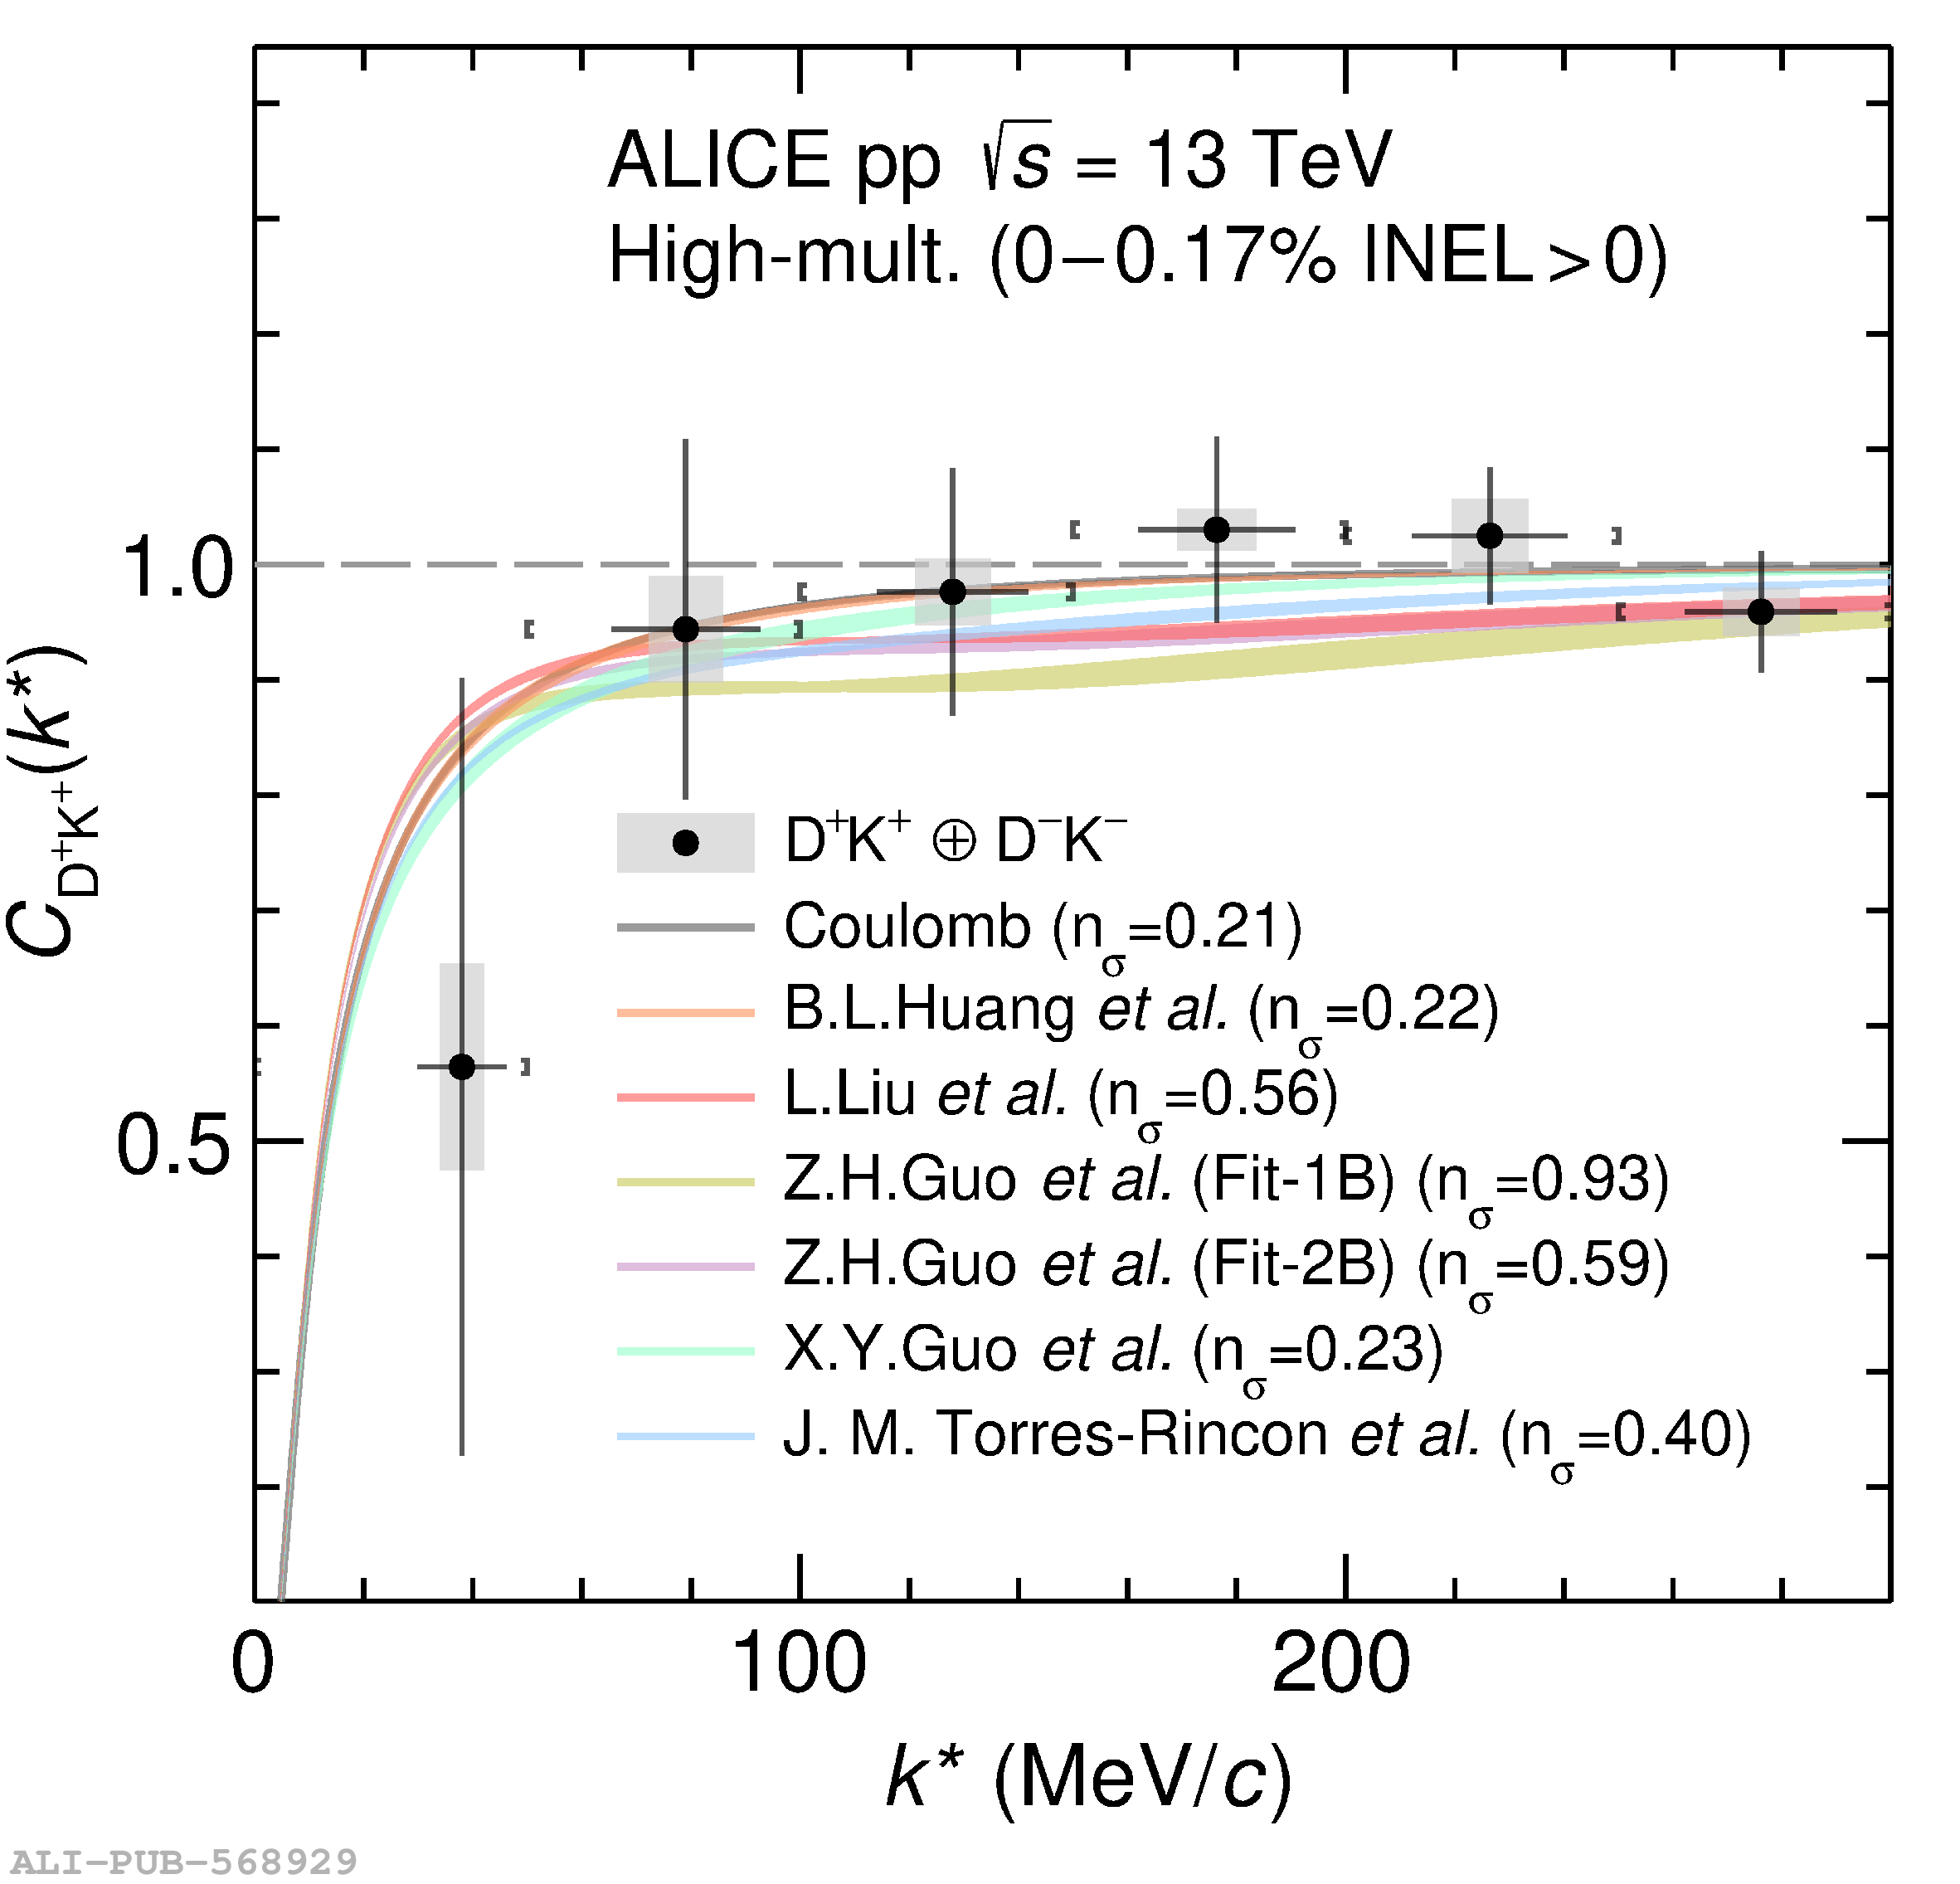 |