Experimental \DPi raw correlation functions ($C_\mathrm{raw}(\kstar)$) with statistical (bars) and systematic uncertainties (boxes) (left column), and background contributions to the experimental correlation functions (right column). The width of the bands corresponds to the total uncertainty $\sigma_\mathrm{tot}=\sqrt{\sigma_\mathrm{stat}^2+\sigma_\mathrm{syst}^2}$. The violet band describes the total background, fitted to the data, and used to extract the genuine correlation function from the raw signal. This band consists of several contributions, which are also shown individually in the figure, scaled by the appropriate $\lambda$ parameter. The results are shown for opposite-charge (first row) and same-charge (second row) pairs. | 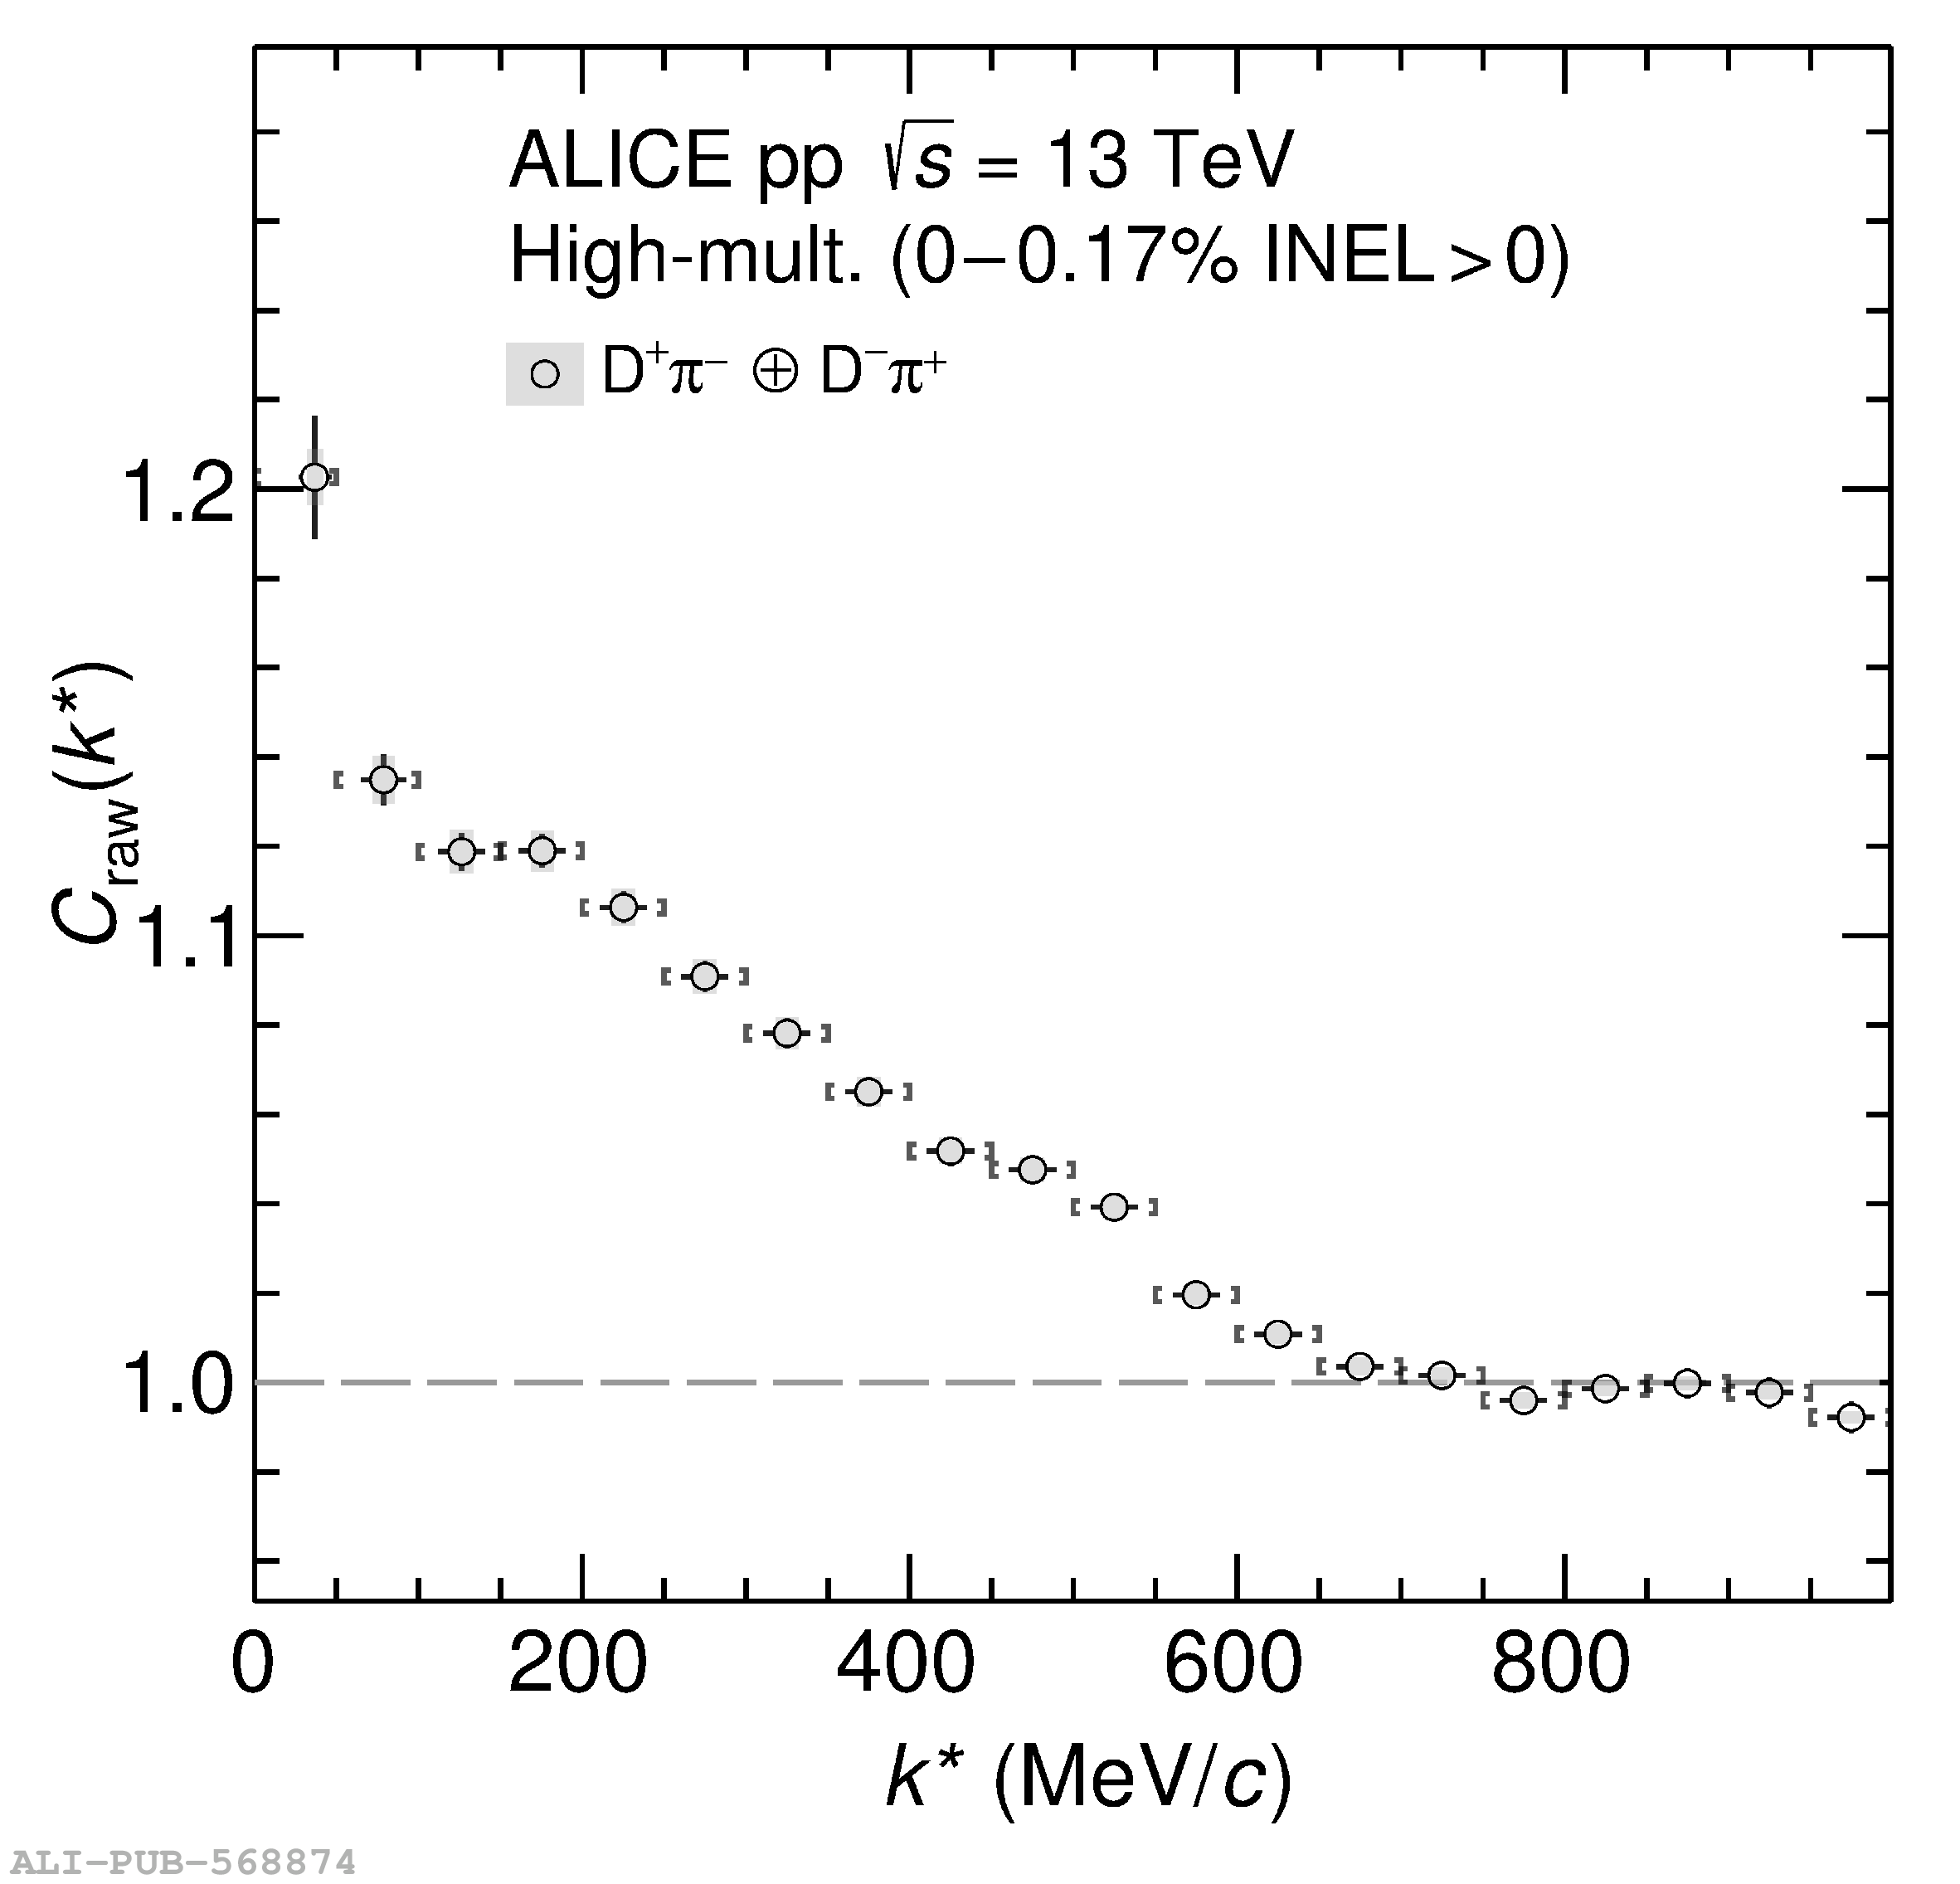 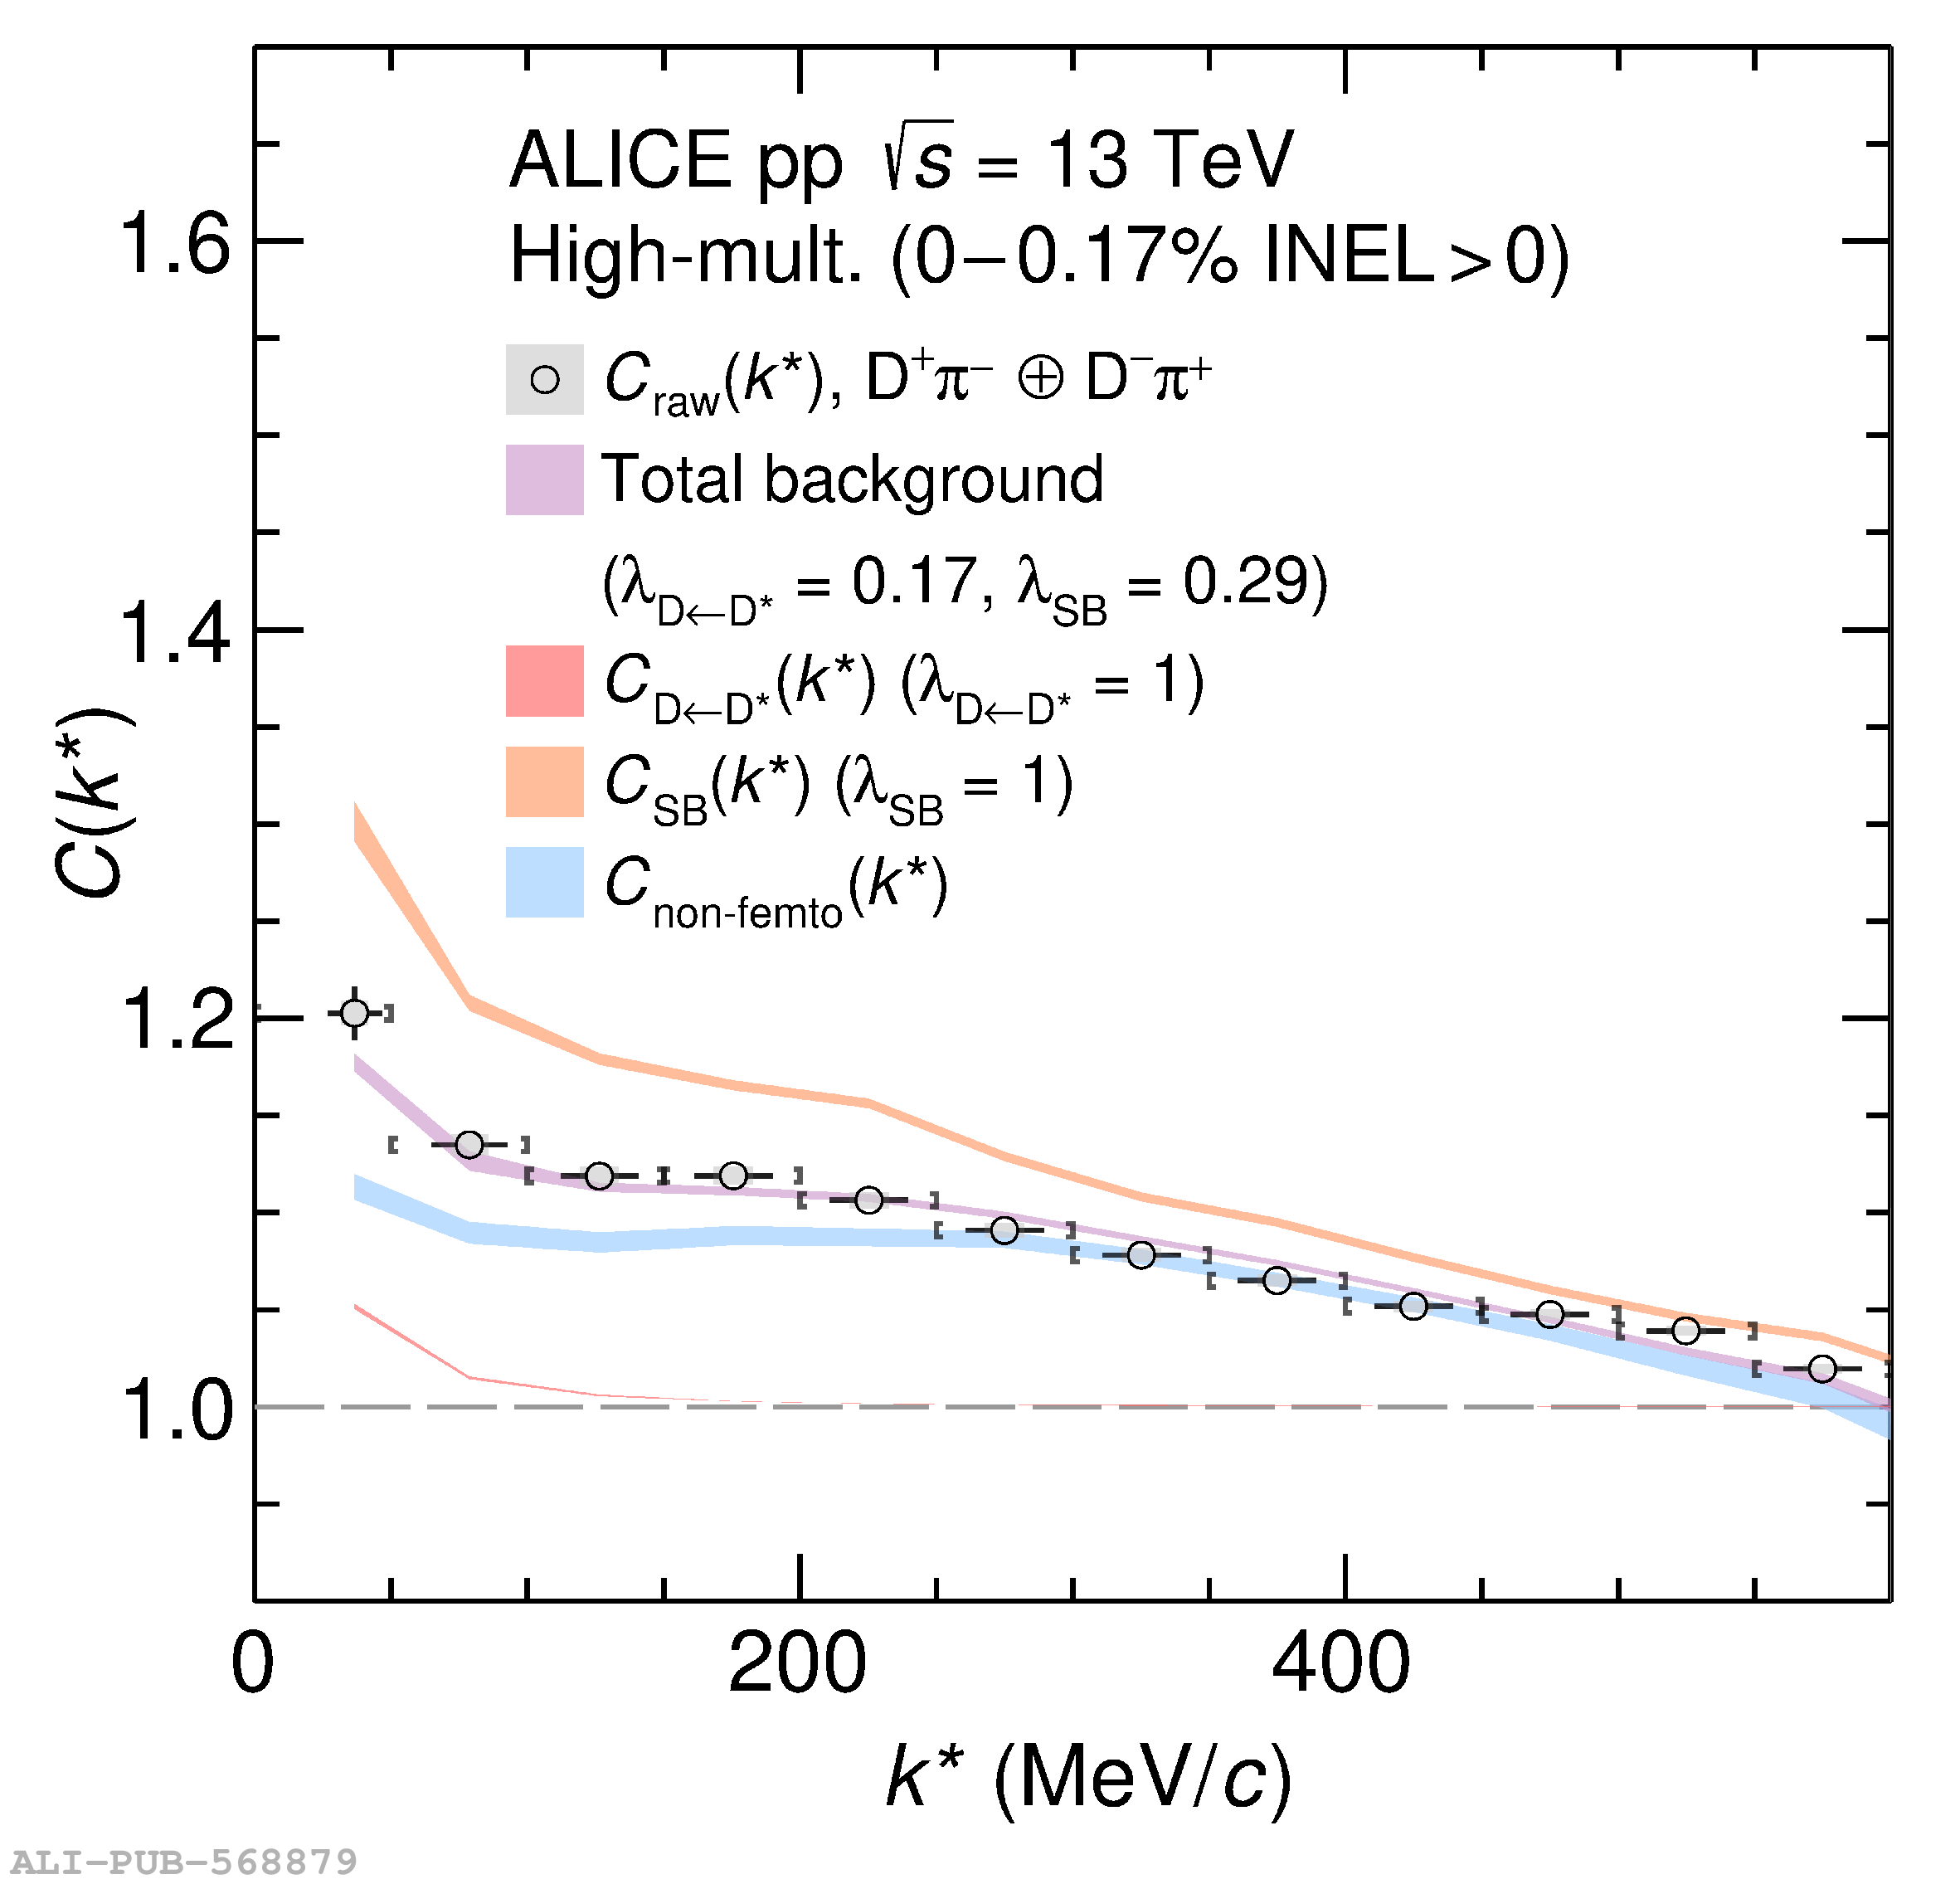 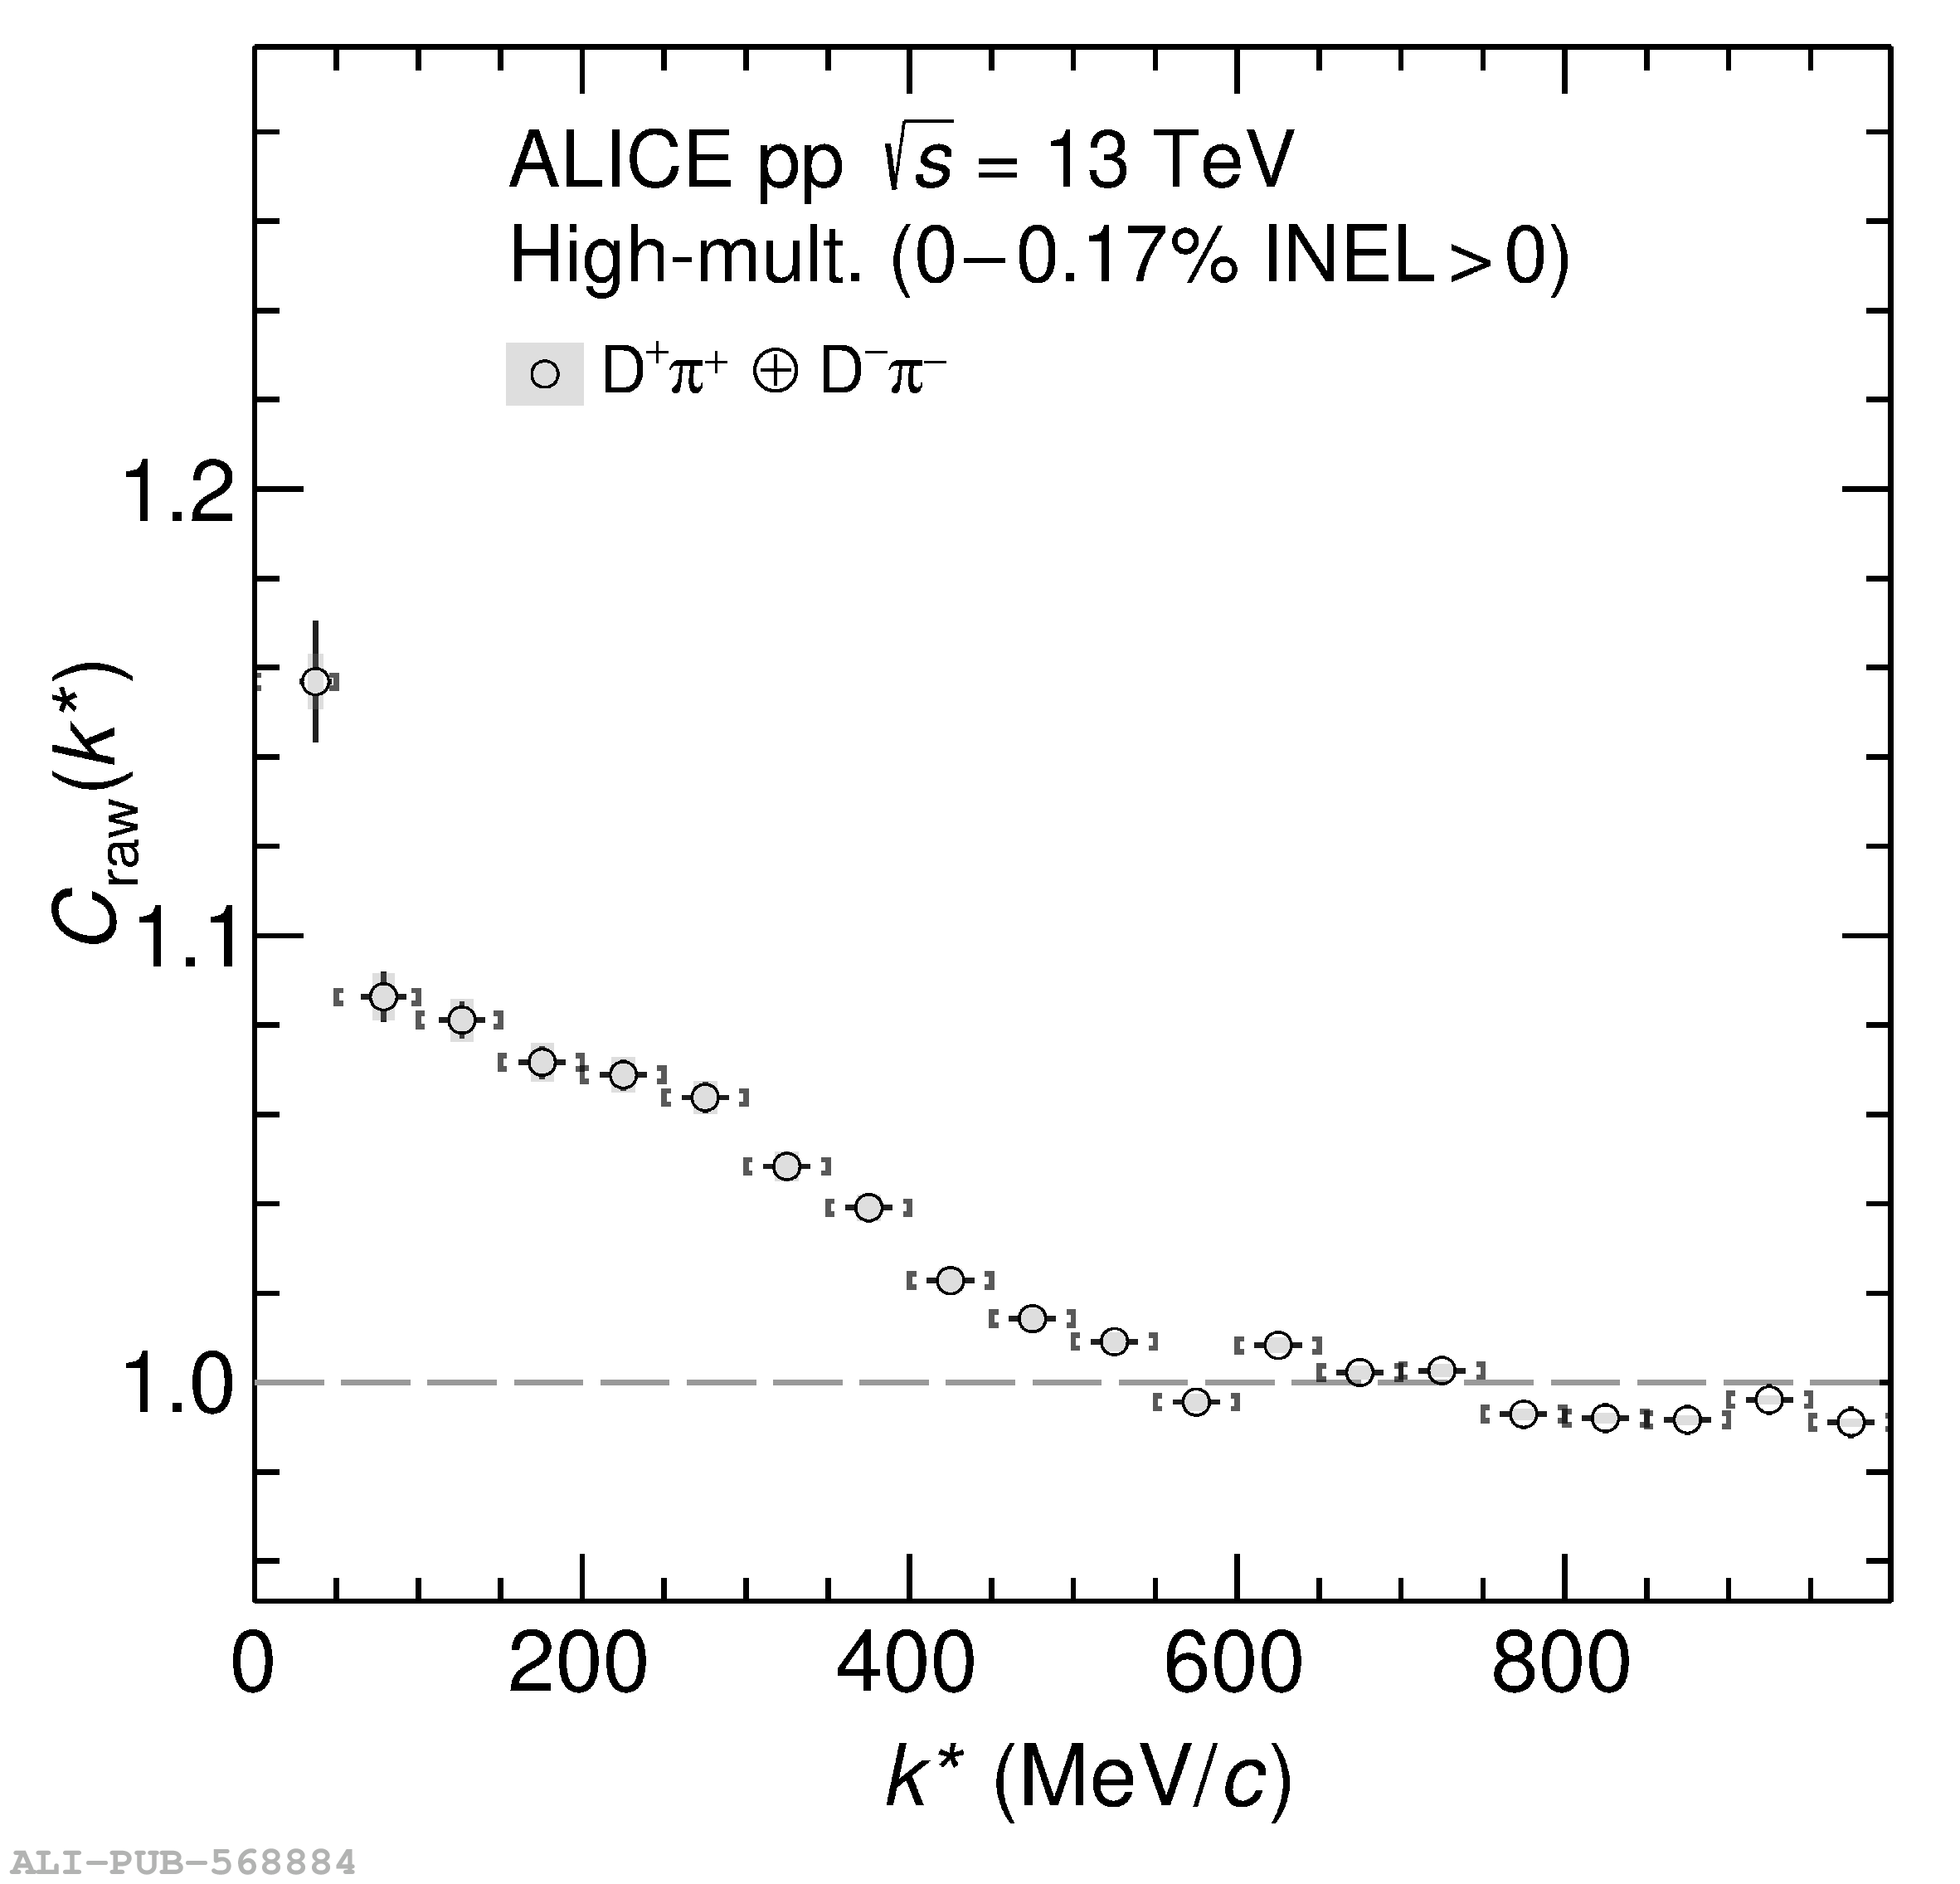 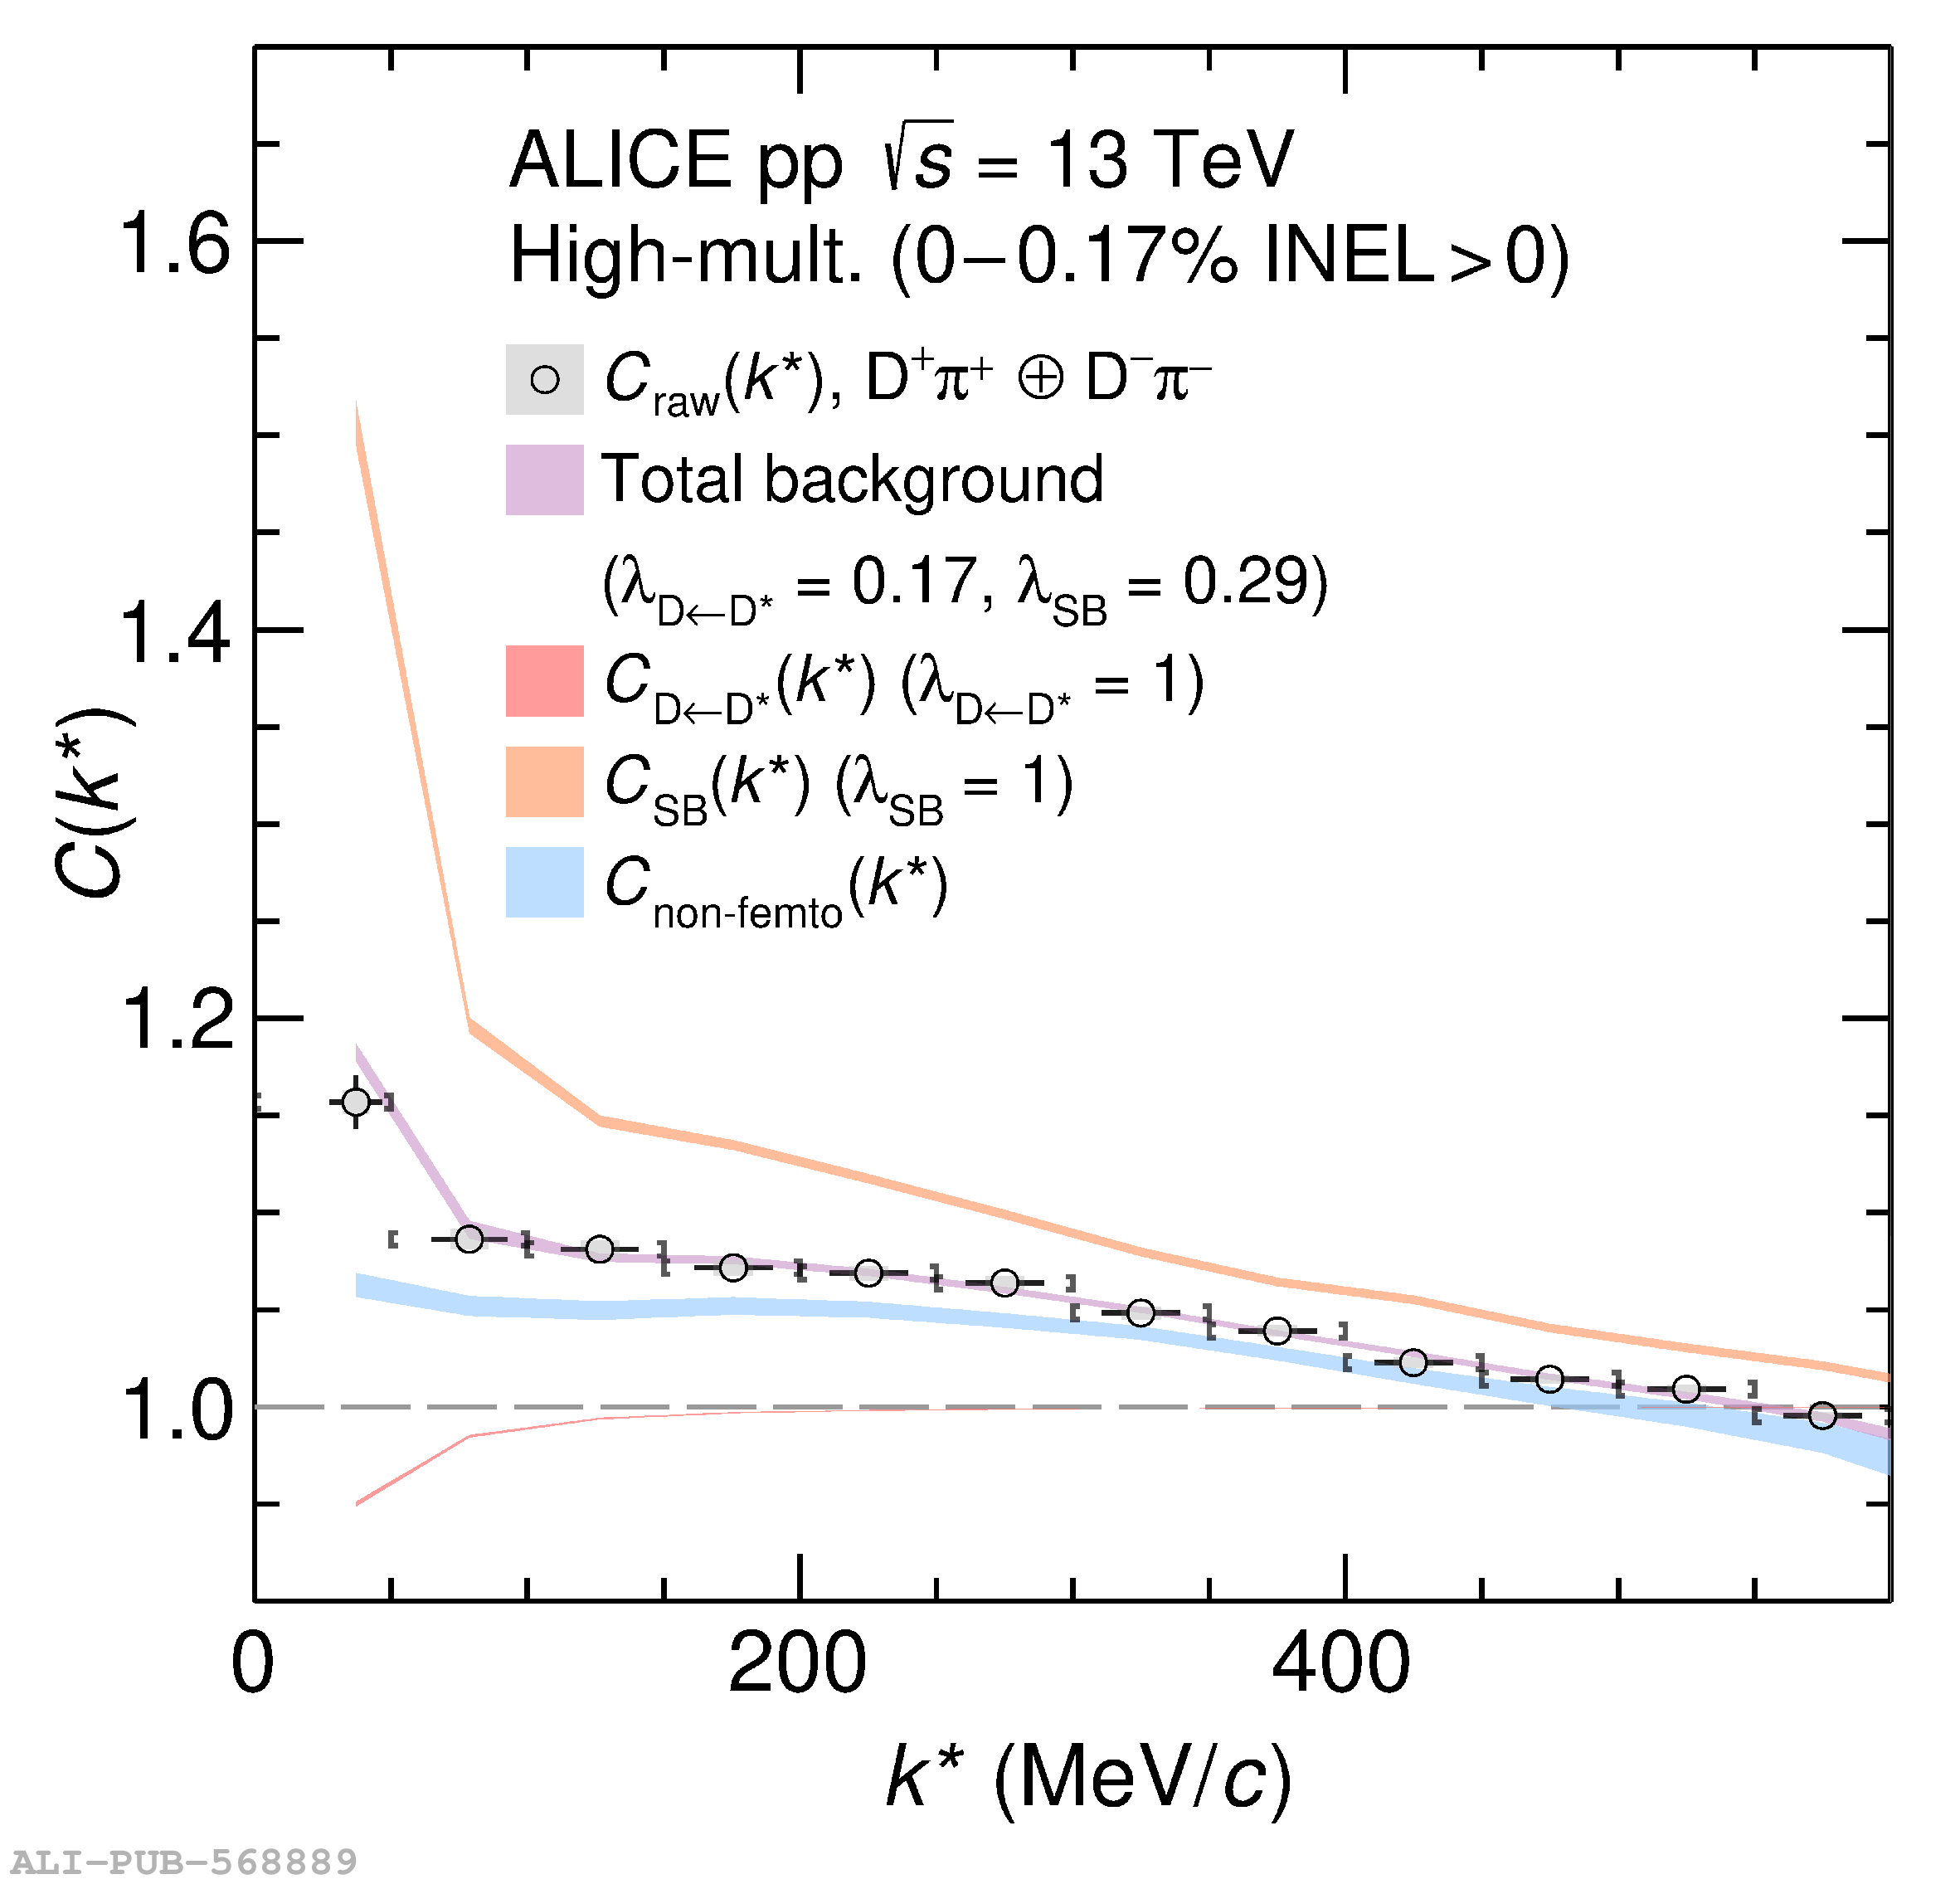 |