Left: beauty-quark production cross section per unit of rapidity at midrapidity as a function of the centre-of-mass energy measured in pp and ${\rm p\overline{p}}$ collisions by the ALICE and PHENIX Collaborations, and the CDF and UA1 Collaborations. The solid and dashed lines, accompanied by shaded bands, represent the central values and the associated uncertainties predicted by FONLL and NNLO calculations, respectively. Right: beauty-quark production cross section per unit of (pseudo)rapidity as a function of (pseudo)rapidity measured by the ALICE Collaboration (LHCb Collaboration ). The solid and dashed lines, accompanied by a shaded band, represent the central values and the associated uncertainties predicted by FONLL as a function of $y$ and $\eta$, respectively The vertical bars and boxes report the statistical and systematic uncertainties, respectively. | 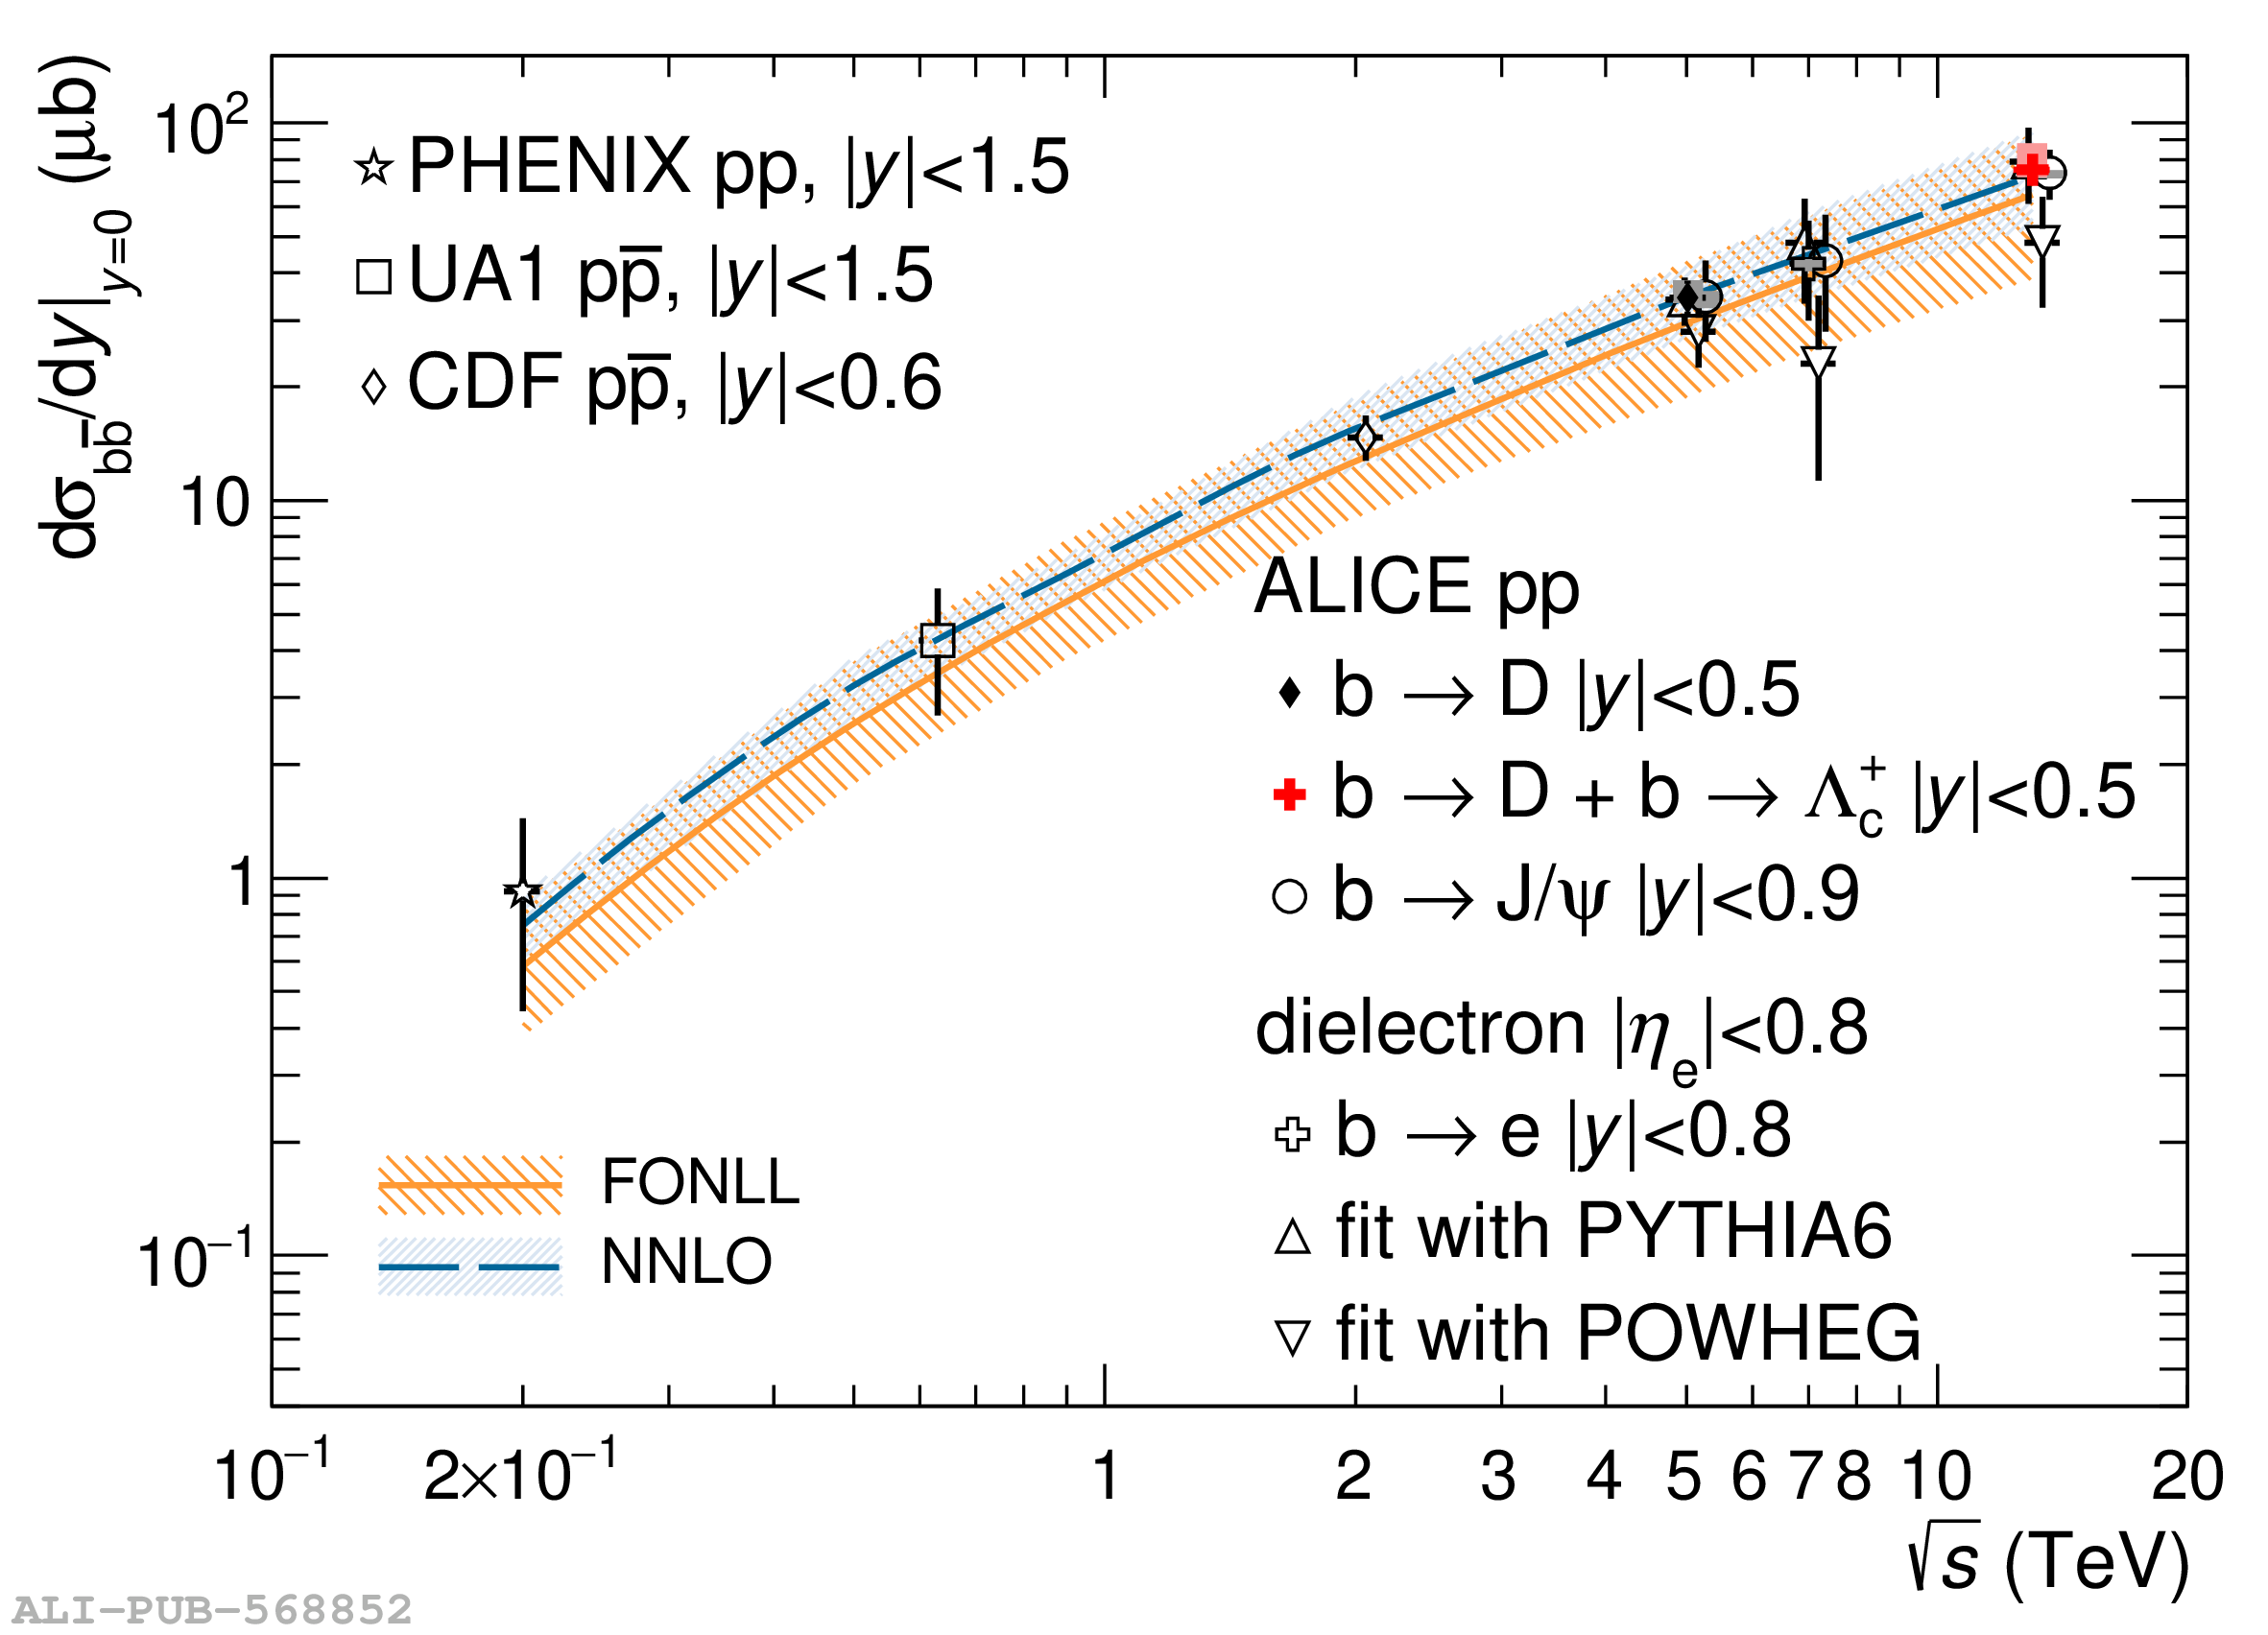 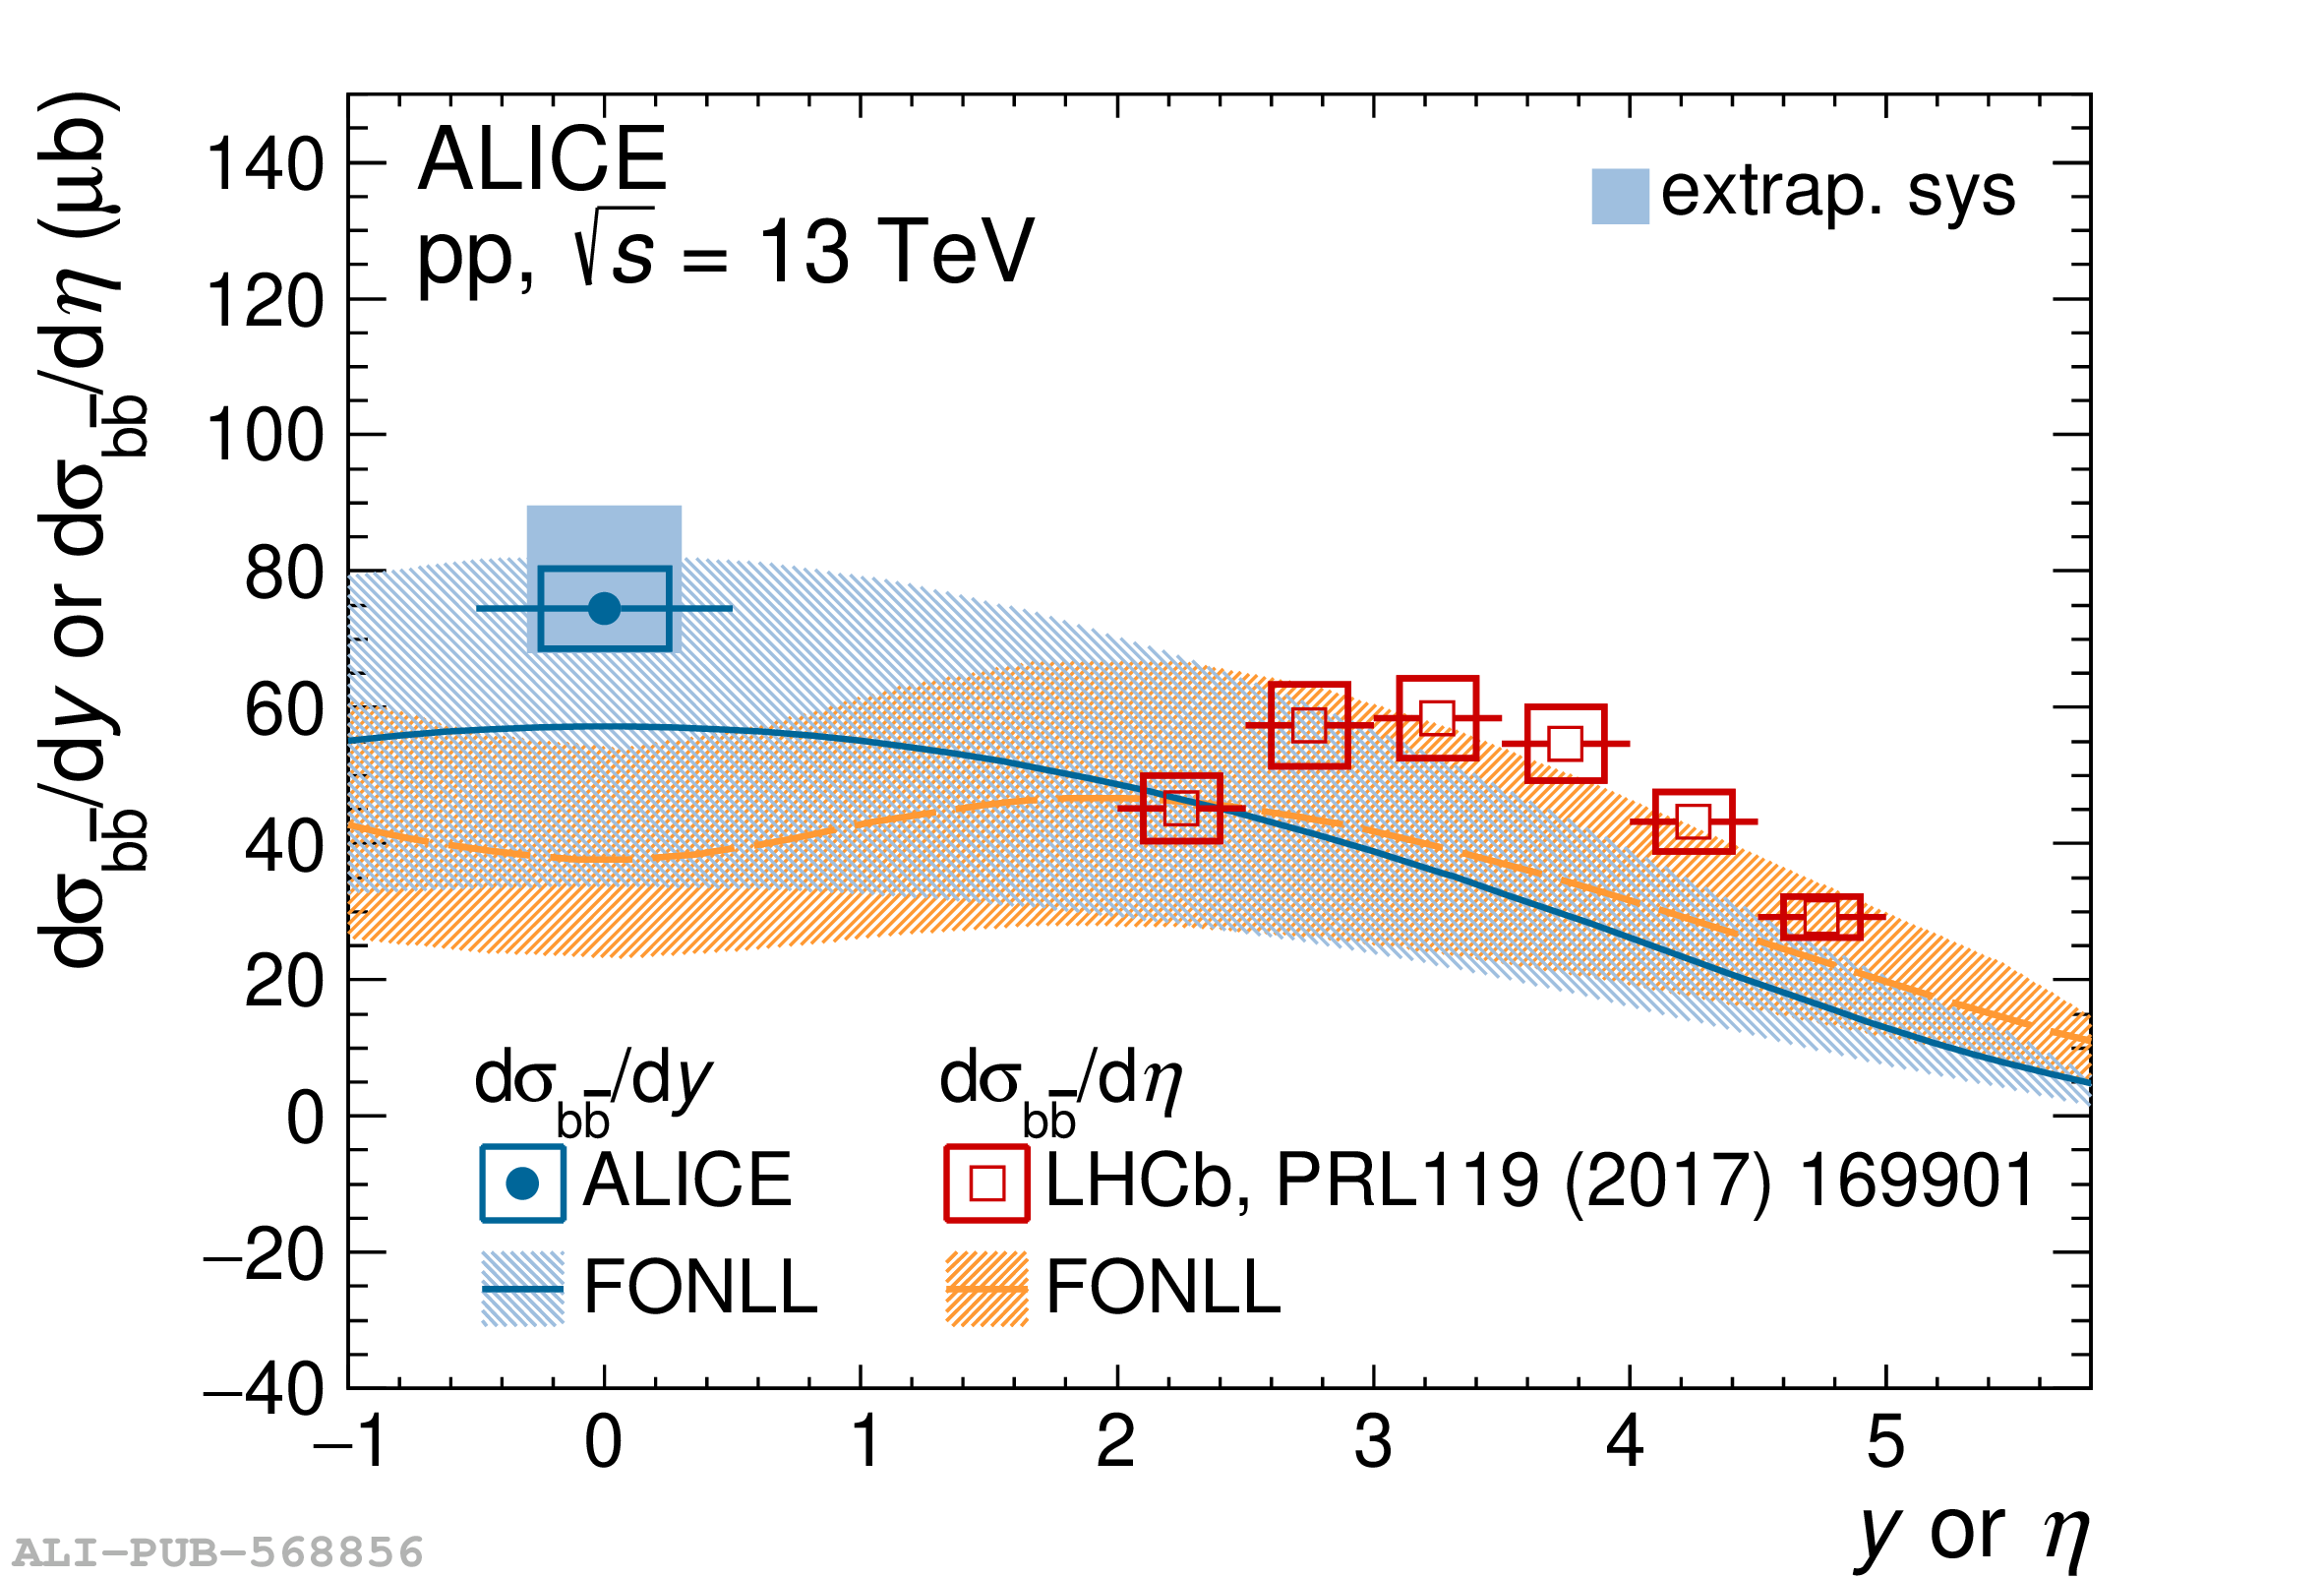 |