The $p_{\rm T}$-differential production cross sections of non-prompt ${\rm D^0}$, ${\rm D^+}$, and ${\rm D_s^+}$ mesons originating from beauty-hadron decays are measured in proton$-$proton collisions at a centre-of-mass energy $\sqrt{s}=13$ TeV. The measurements are performed at midrapidity, $|y| <~ 0.5$, with the data sample collected by ALICE from 2016 to 2018. The results are in agreement with predictions from several perturbative QCD calculations. The fragmentation fraction of beauty quarks to strange mesons divided by the one to non-strange mesons, $f_{\rm{s}}/(f_{\rm{u}} + f_{\rm{d}})$, is found to be $0.114 \pm 0.016~{\rm (stat.)} \pm 0.006~{\rm (syst.)} \pm 0.003~{\rm (BR)} \pm 0.003~{\rm (extrap.)}$. This value is compatible with previous measurements at lower centre-of-mass energies and in different collision systems in agreement with the assumption of universality of fragmentation functions. In addition, the dependence of the non-prompt D meson production on the centre-of-mass energy is investigated by comparing the results obtained at $\sqrt{s} = 5.02$ and 13 TeV, showing a hardening of the non-prompt D-meson $p_{\rm T}$-differential production cross section at higher $\sqrt{s}$. Finally, the ${\rm b\overline{b}}$ production cross section per unit of rapidity at midrapidity is calculated from the non-prompt ${\rm D^0}$, ${\rm D^+}$, ${\rm D_s^+}$, and $\Lambda_{\rm c}^+$ hadron measurements, obtaining ${\rm d}\sigma/{\rm d}y = 75.2\pm 3.2~(\mathrm{stat.}) \pm 5.2~(\mathrm{syst.})^{+12.3}_{-3.2} ~(\mathrm{extrap.})\text{ } \rm \mu b \;.$
JHEP 10 (2024) 110
HEP Data
e-Print: arXiv:2402.16417 | PDF | inSPIRE
CERN-EP-2024-055
Figure group
Figure 1
Invariant-mass distributions of non-prompt enhanced $\Dzero$- (top-left), $\Dplus$- (top-right), and $\Ds$-meson (bottom) candidates, and their charge conjugates in $1 < \pt < 2$ GeV/$c$, $1 < \pt < 2$ GeV/$c$, and $2 < \pt < 4$ GeV/$c$, respectively. For the $\Ds$ meson, the left-side peak emerges due to the contribution of the $\Dplus$ meson decaying in the same channel as the $\Ds$ meson The blue solid line shows the total fit function and the red dashed line the combinatorial-background contribution. The values of the mean ($\mu$), width ($\sigma$), and raw yield ($S$) of the signal peak are reported together with their statistical uncertainties resulting from the fit. The width is fixed to the one obtained from the prompt-enhanced sample The fraction of non-prompt candidates in the measured raw yield is reported with its statistical and systematic uncertainties. | 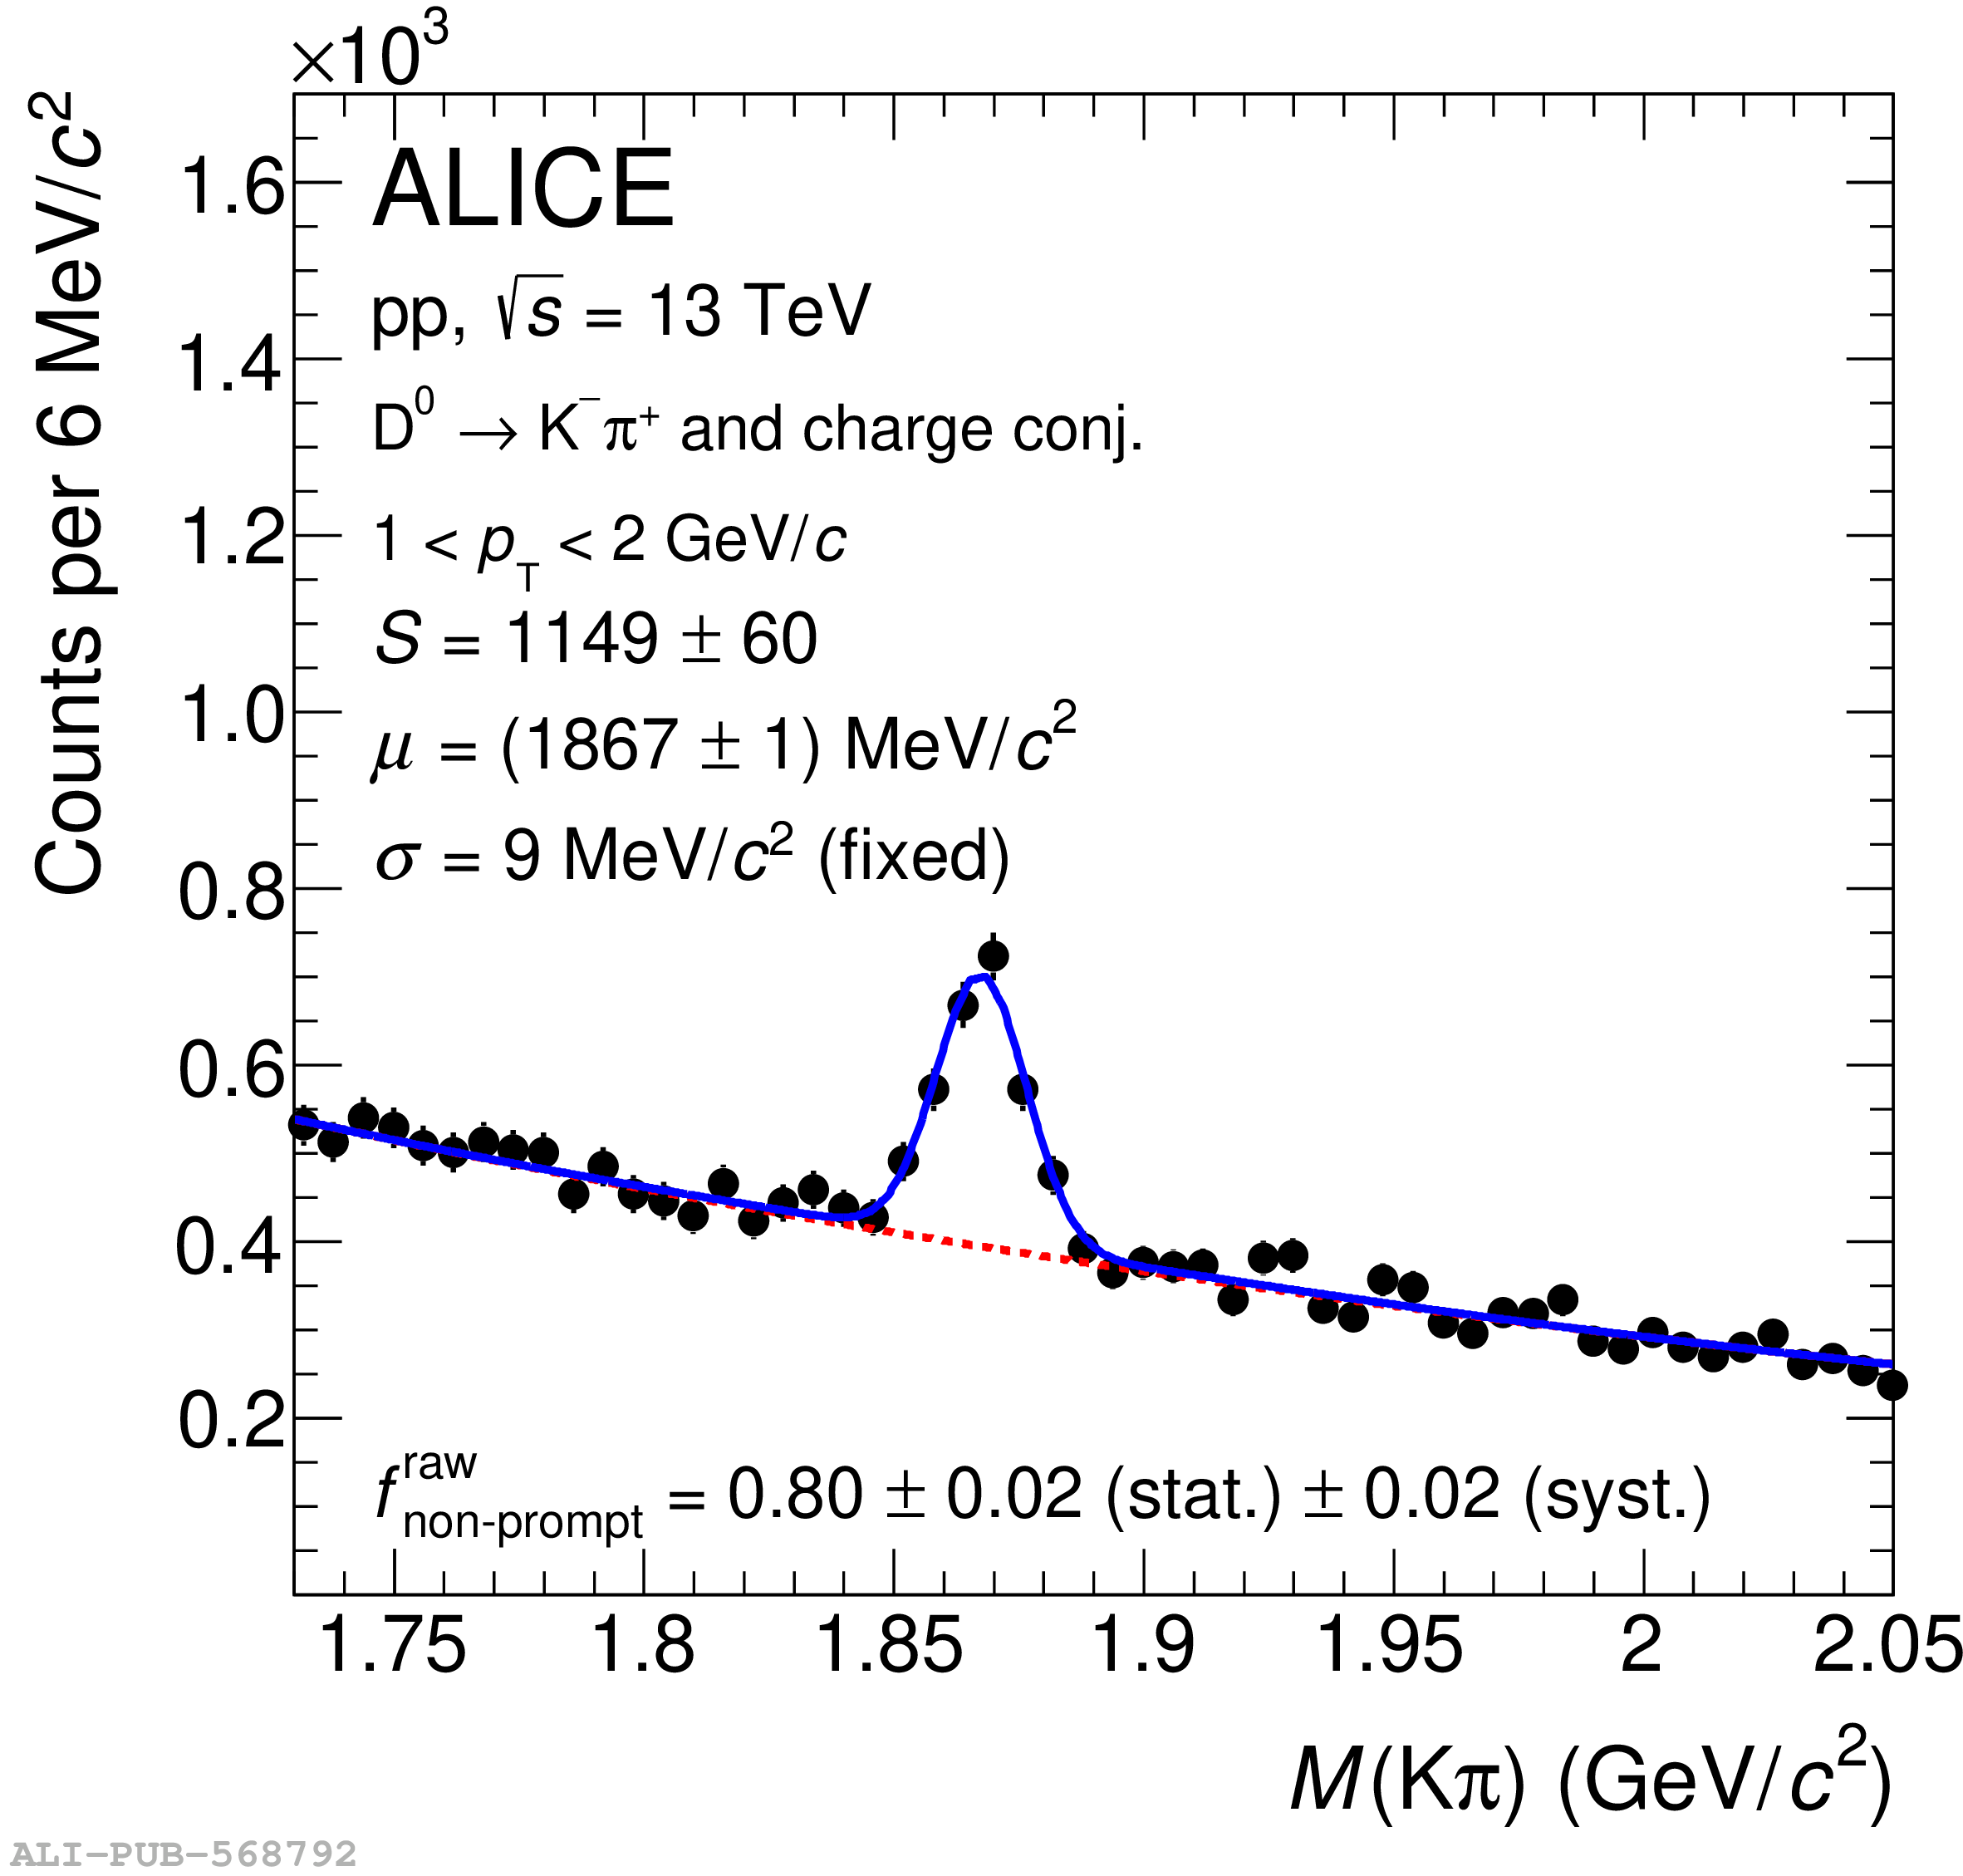 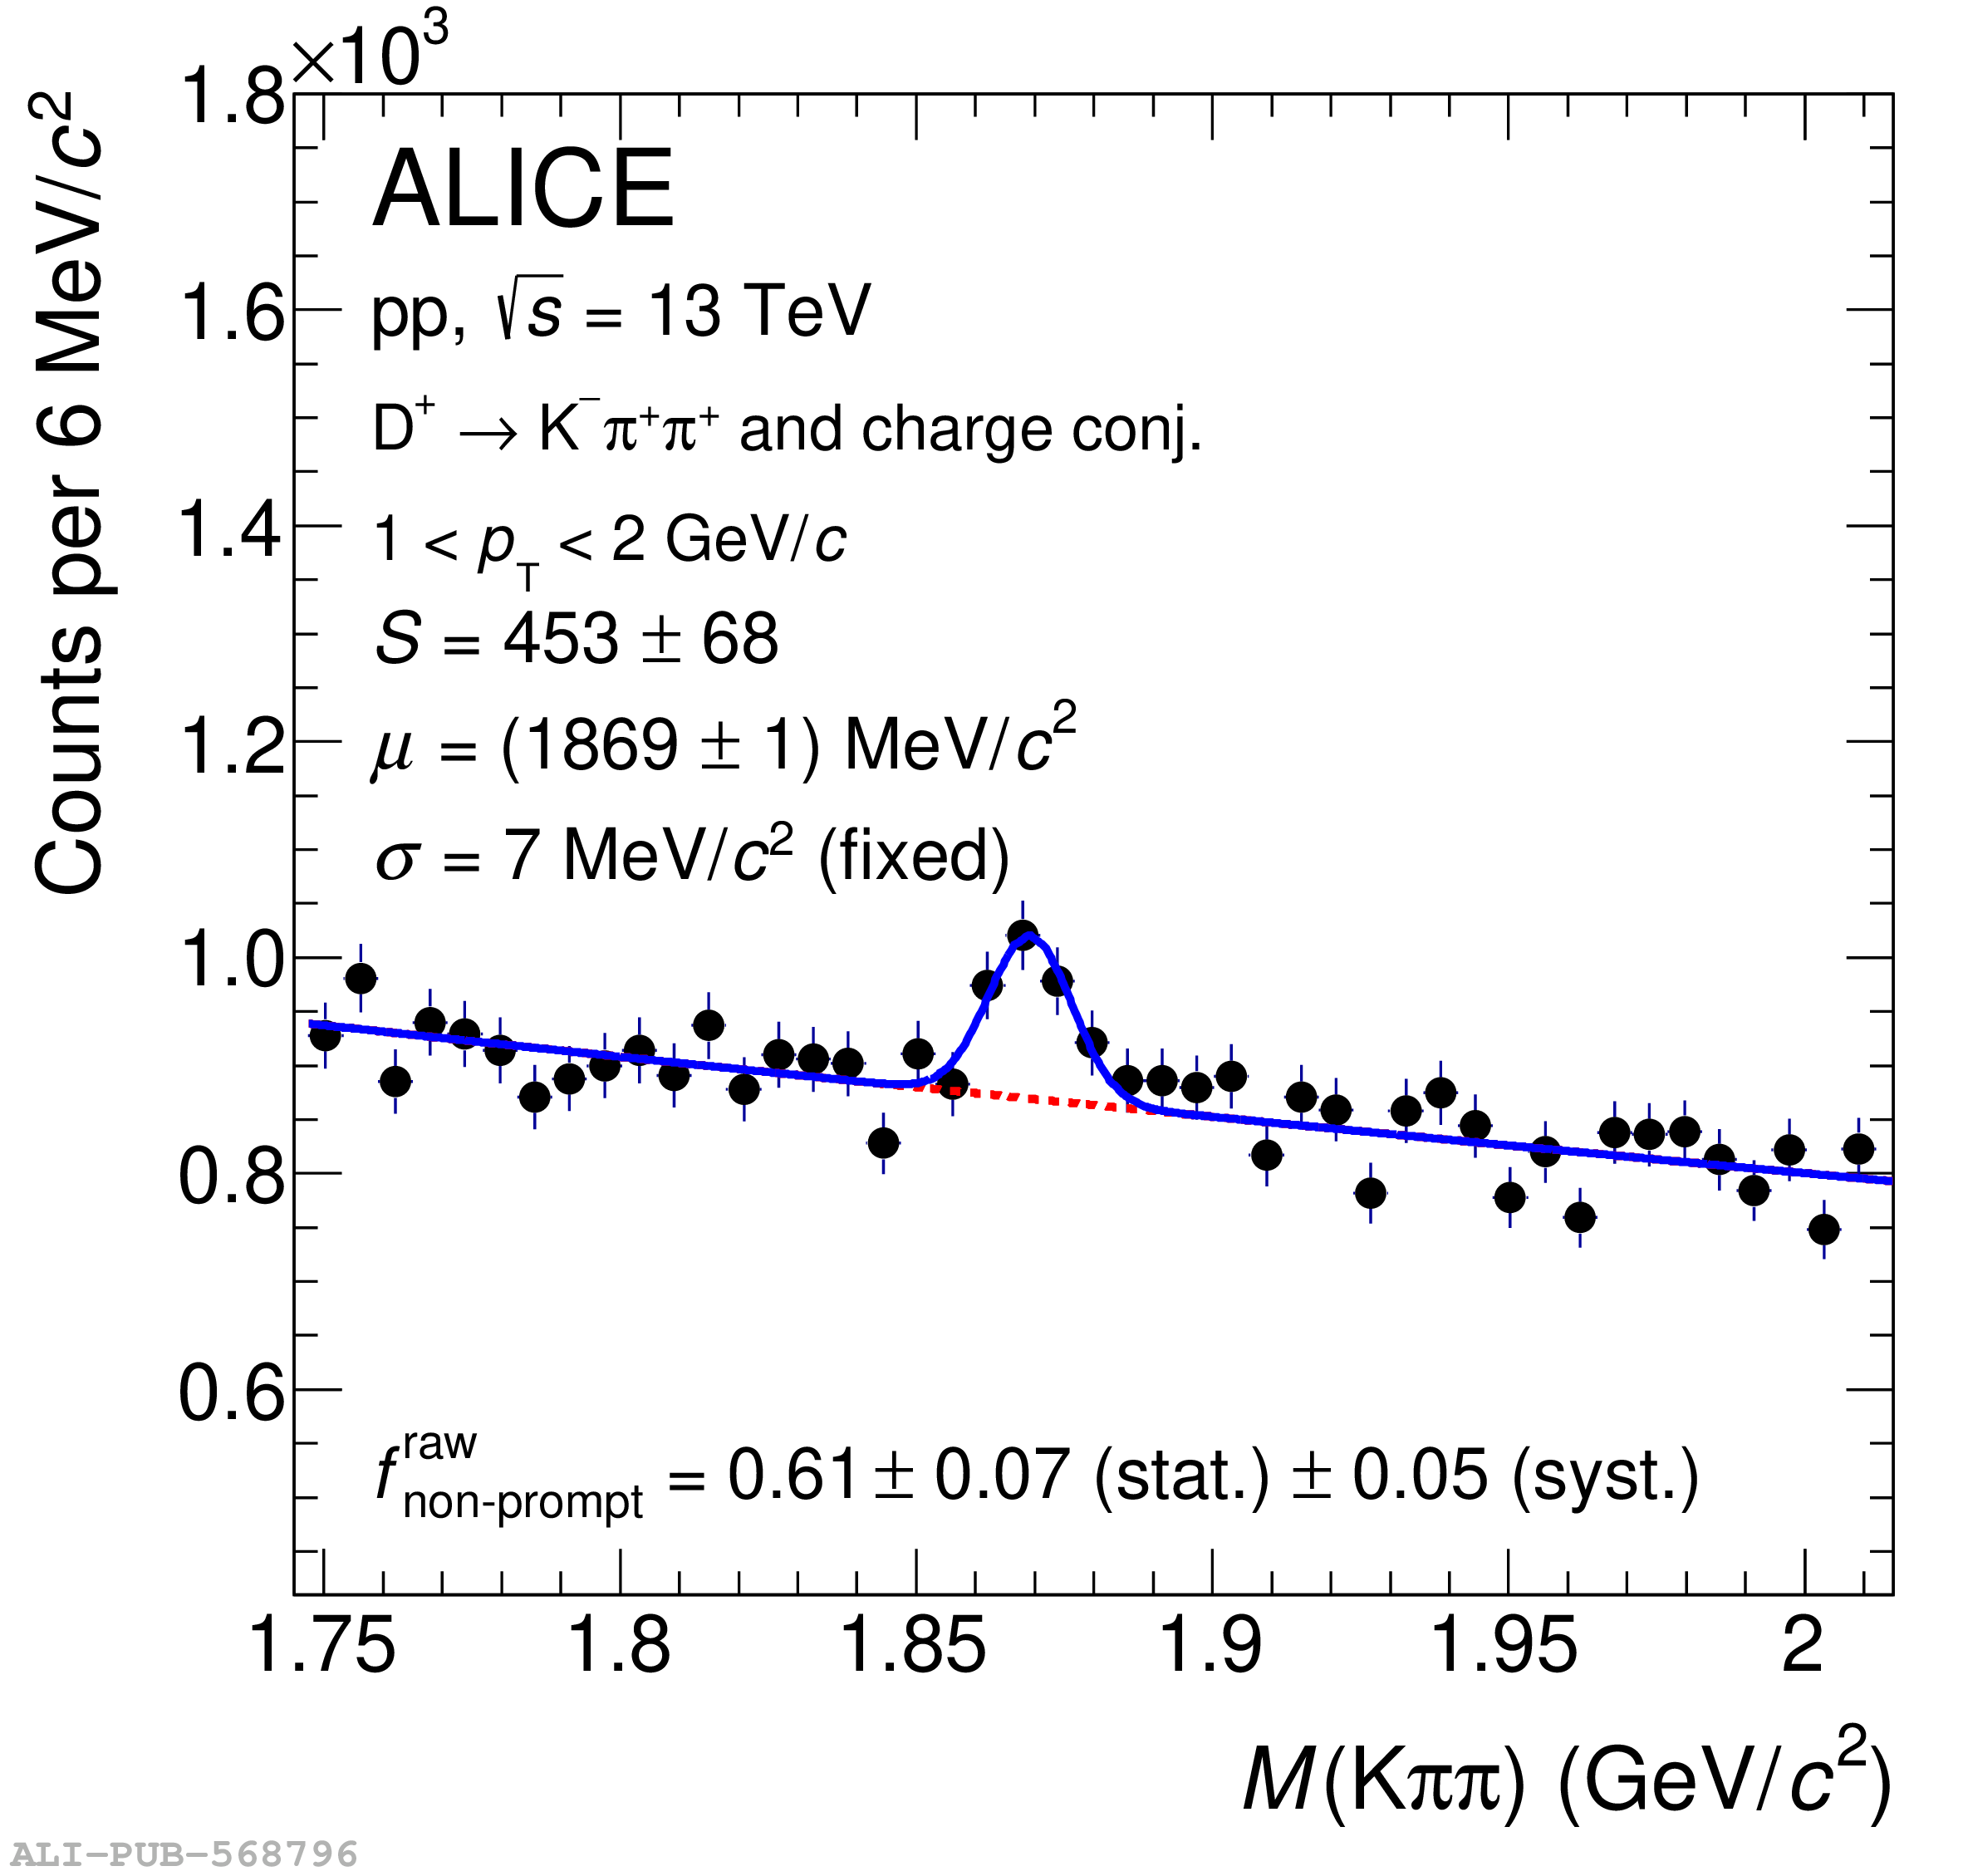 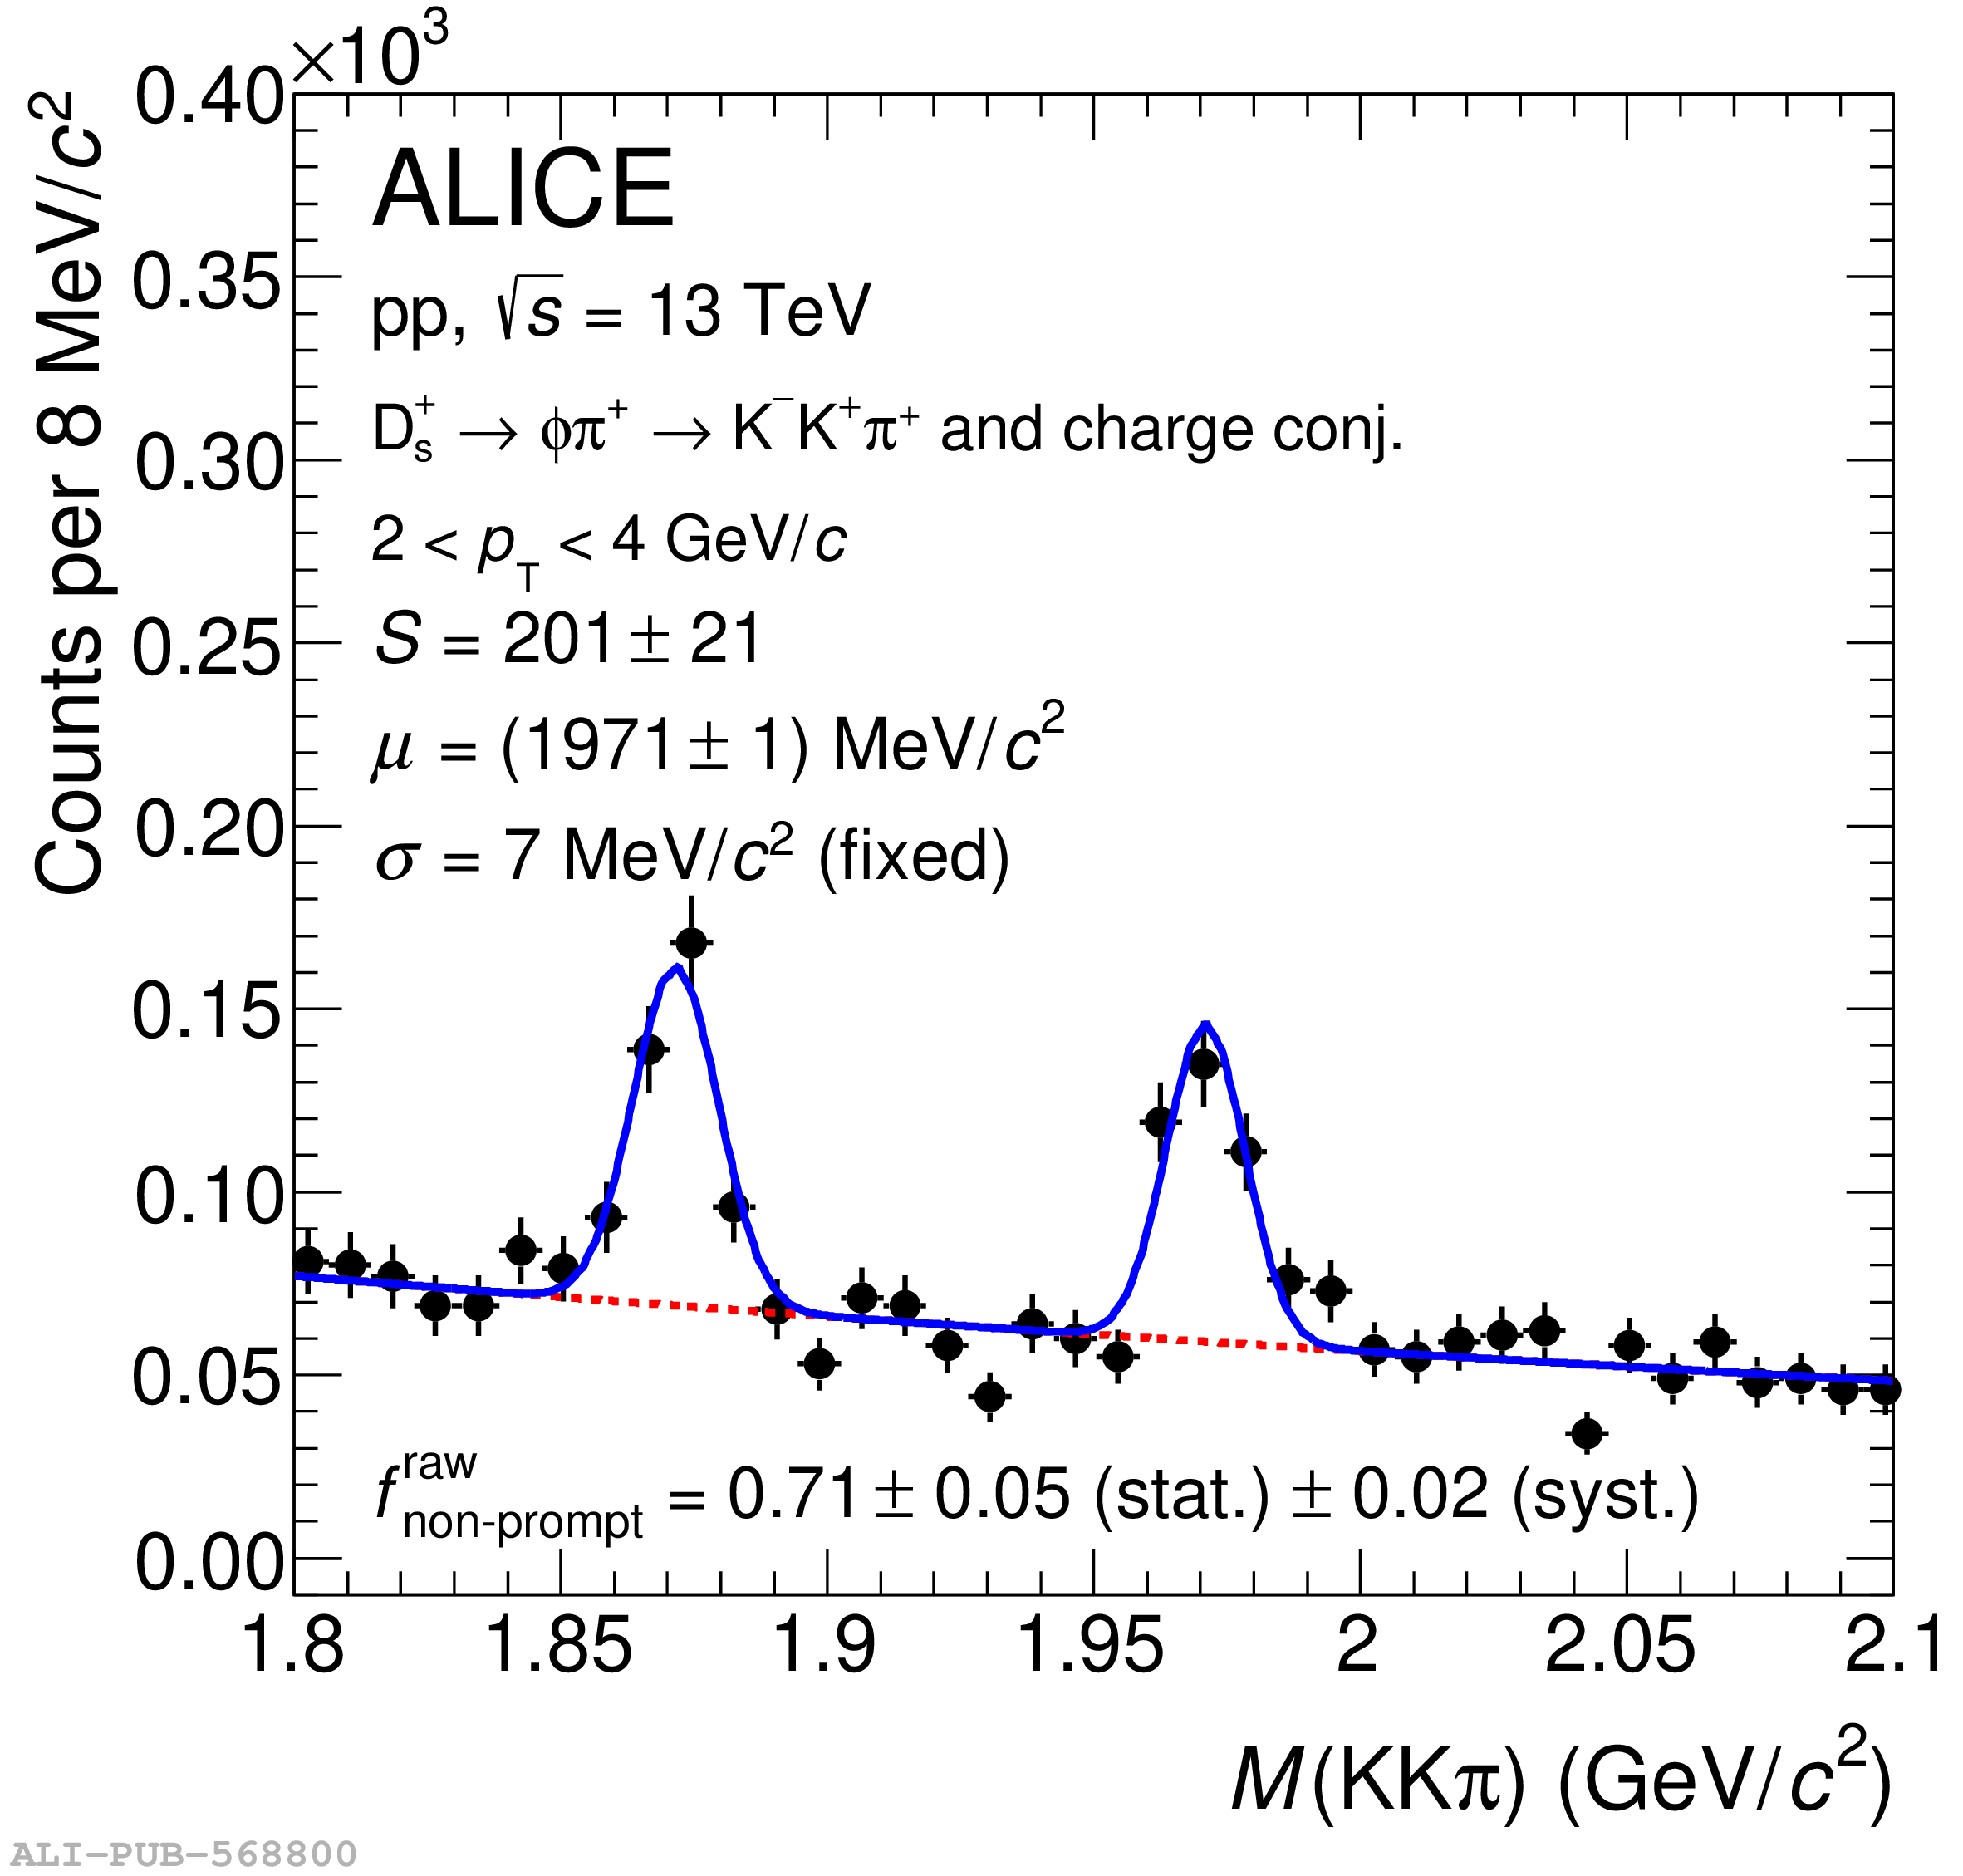 |
Figure 2
Left: $c_{\Delta y}({\rm Acc}\times \varepsilon)$ factors of the selection criteria of the analyses for prompt and non-prompt D mesons as a function of $\pt$. Right: raw fraction of non-prompt $\Dzero$, $\Dplus$, and $\Ds$ mesons in the raw yield as a function of $\pt$. The vertical bars and boxes display the statistical and systematic uncertainties, respectively. | 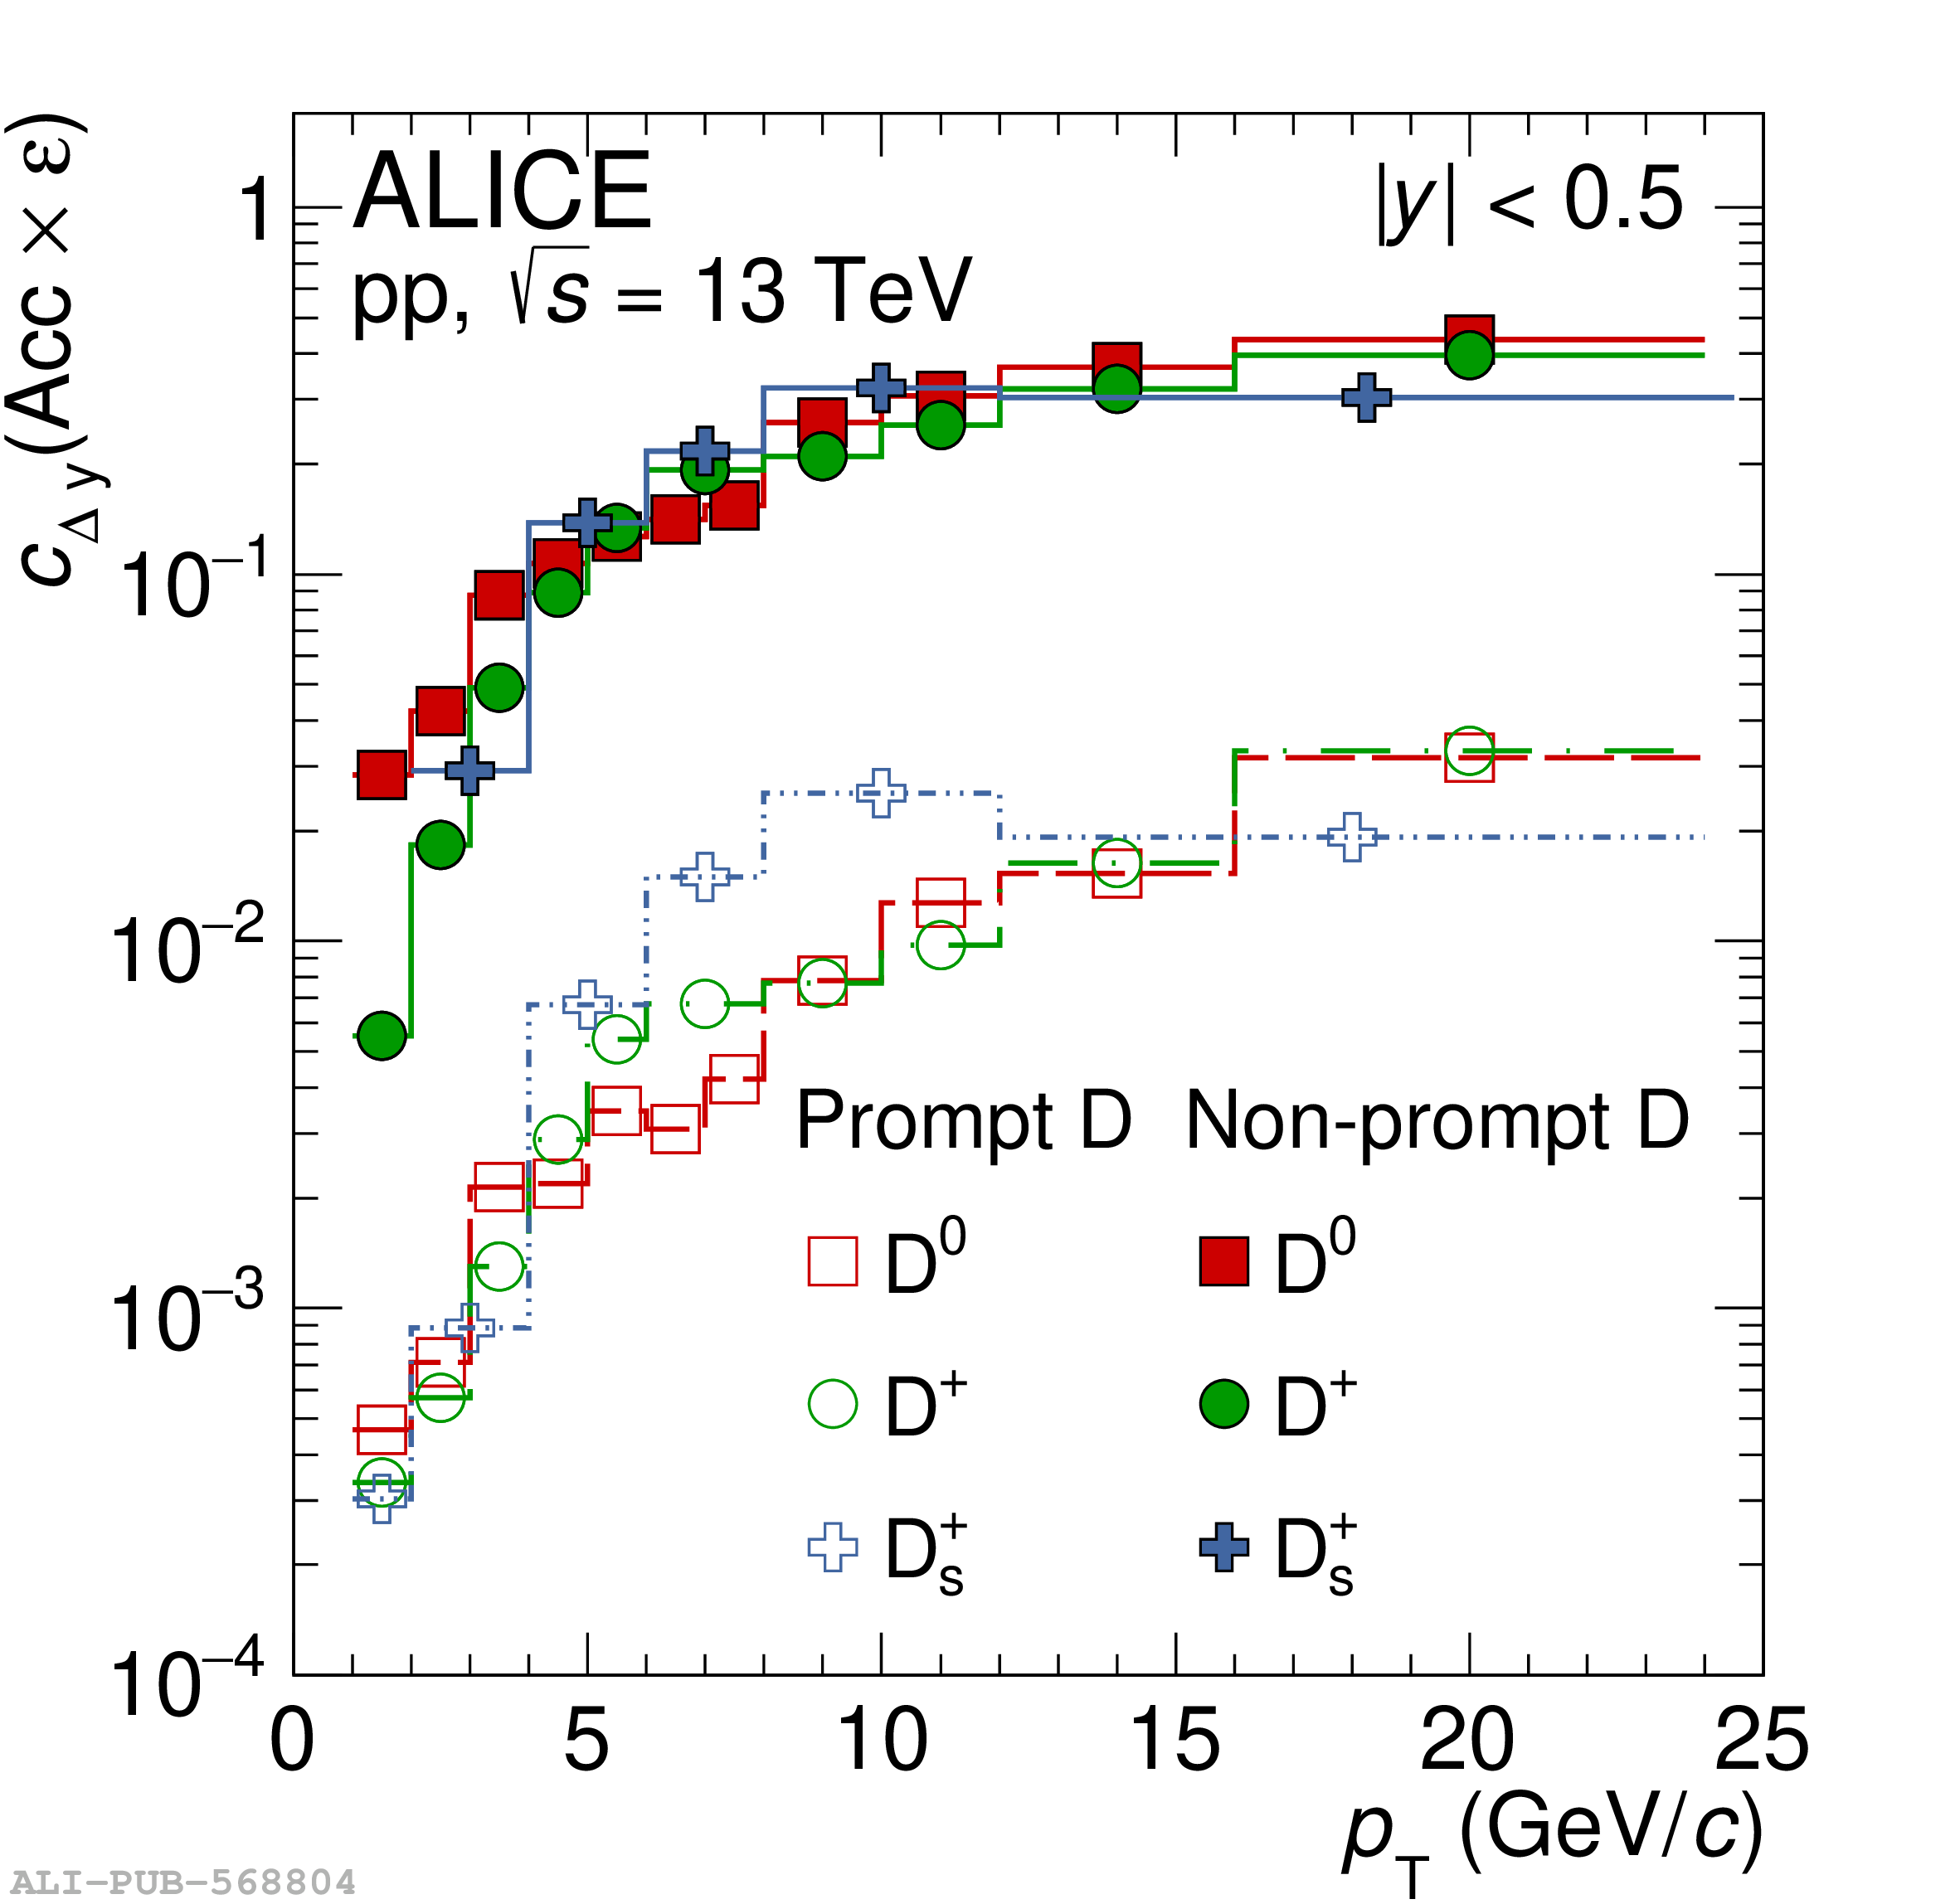 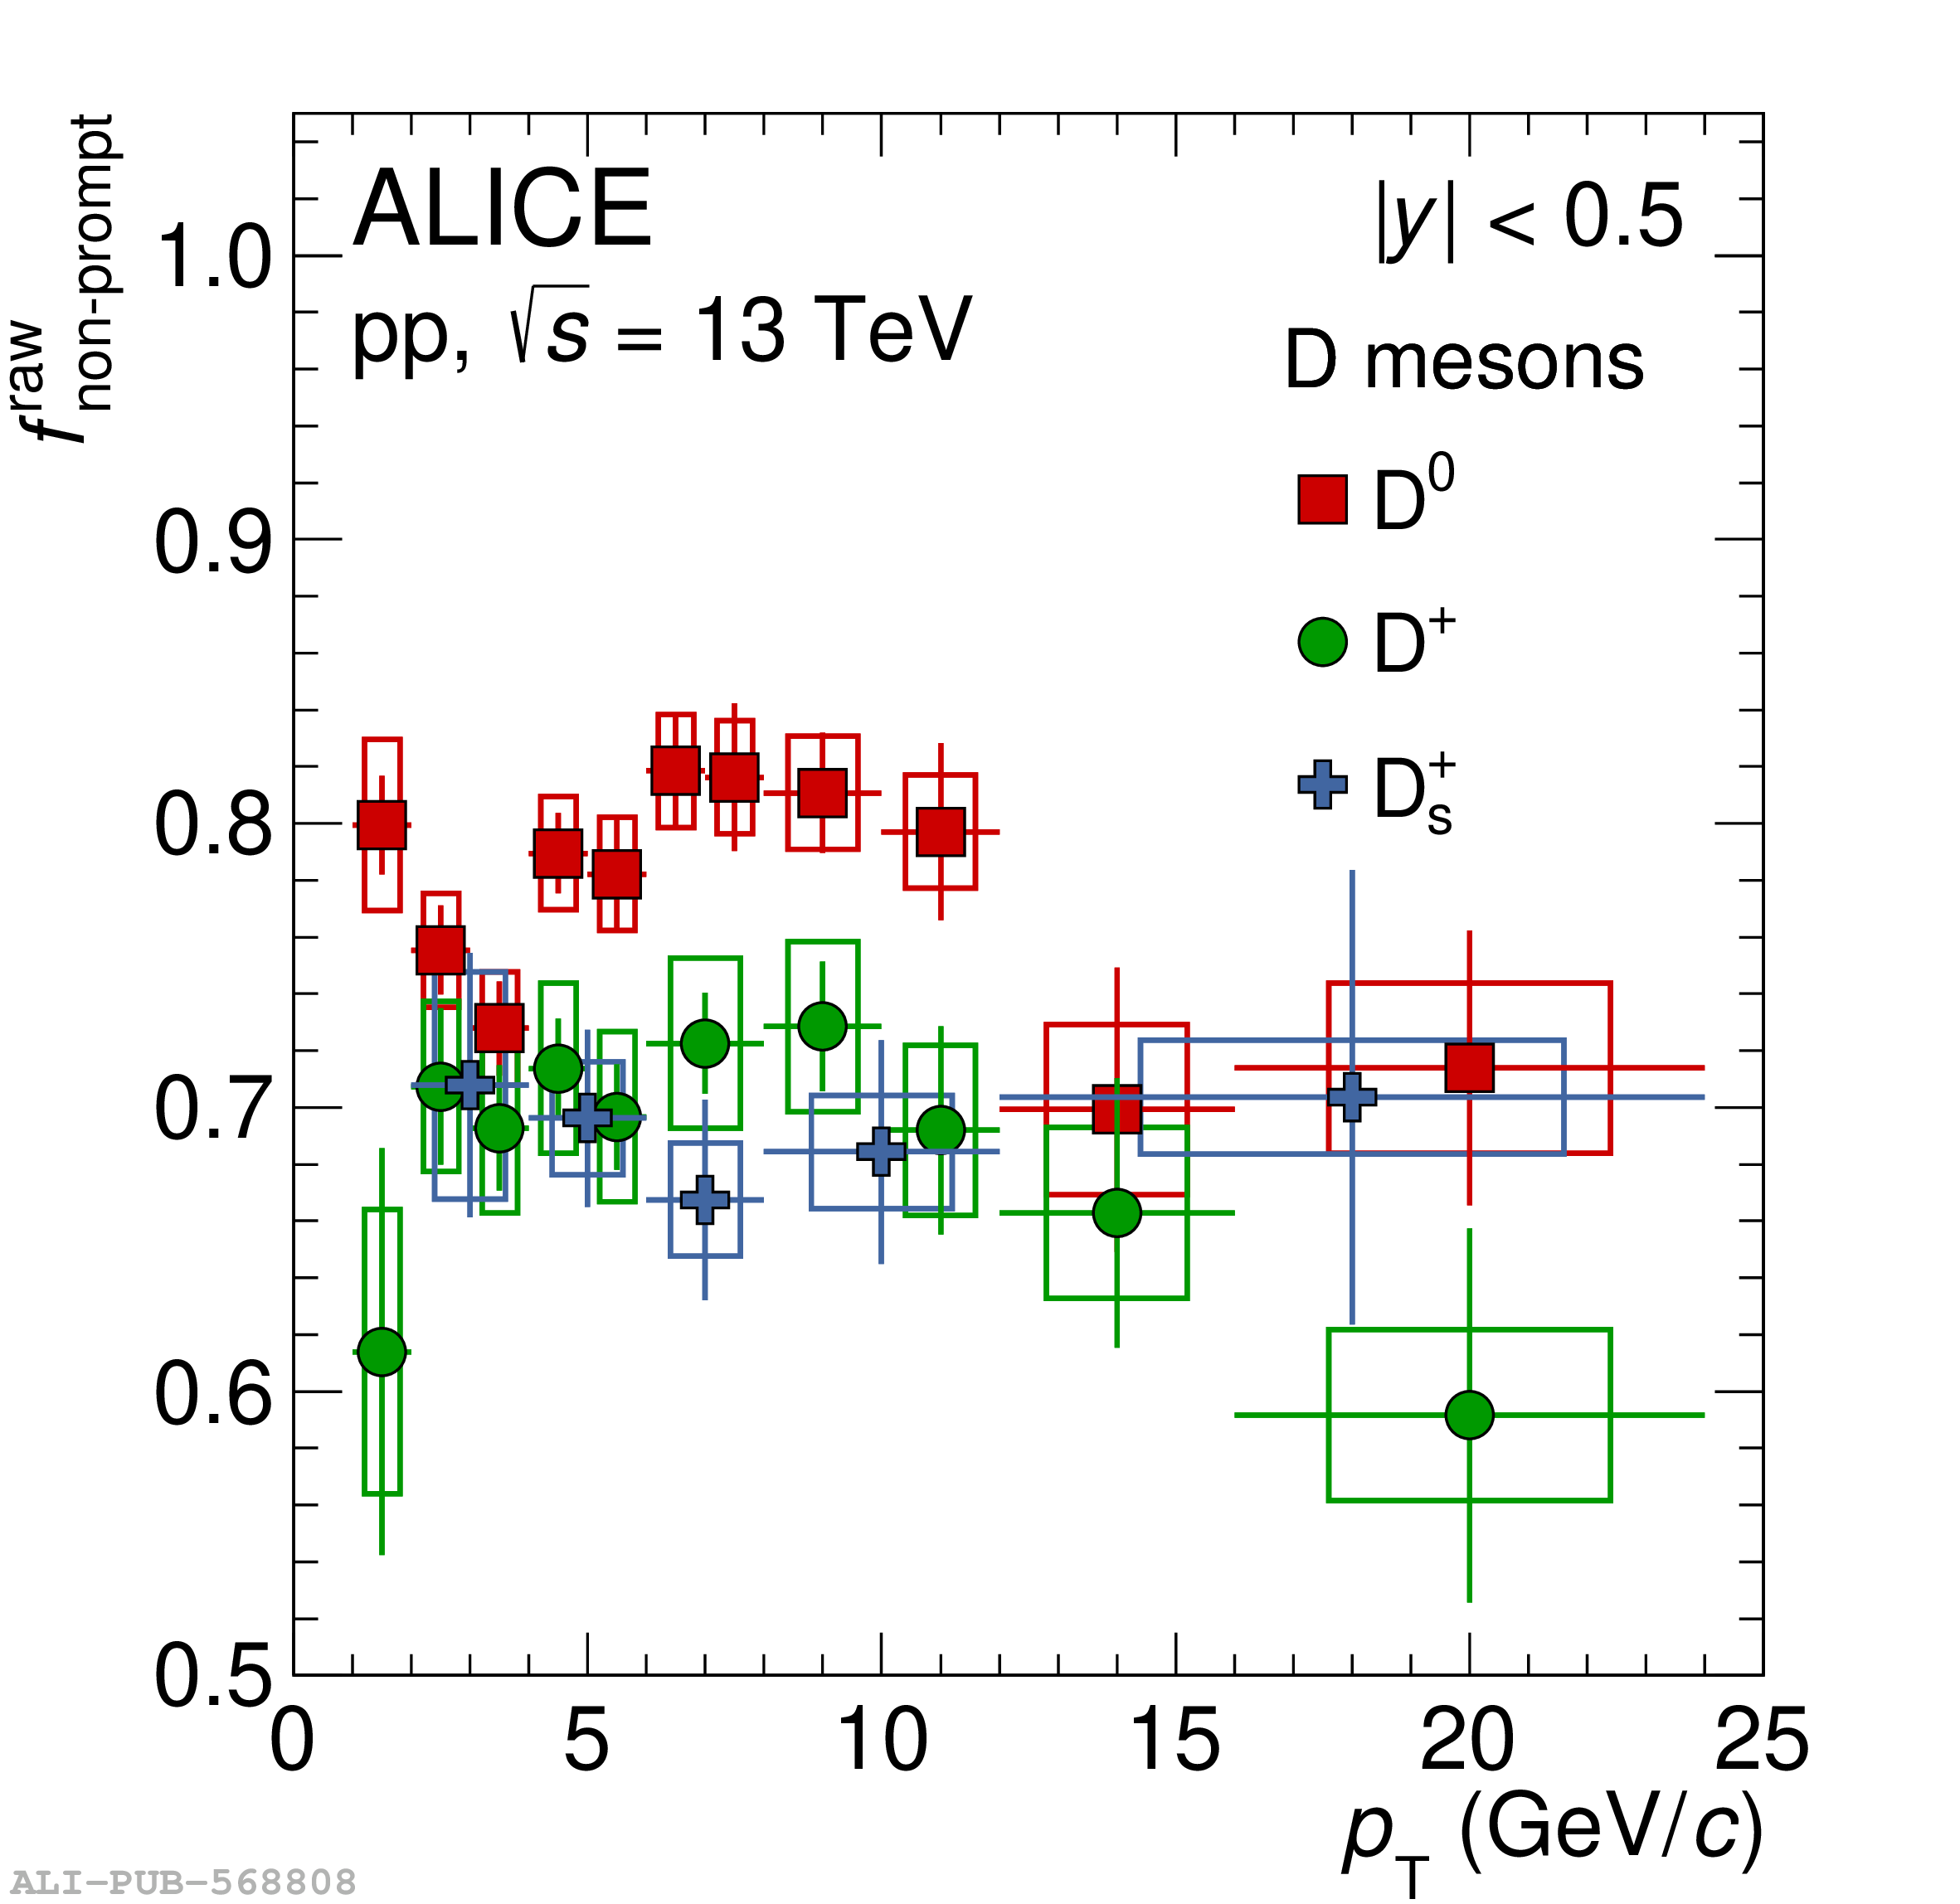 |
Figure 3
Left: $\pt$-differential production cross sections of prompt and non-prompt $\Dzero$, $\Dplus$, and $\Ds$ mesons at midrapidity, $|y|< 0.5$, in pp collisions at $\s=13$ TeV. Right: ratios between the production cross sections of non-prompt and prompt $\Dzero$ (top), $\Dplus$ (middle), and $\Ds$ (bottom) mesons at $\s = 5.02$ and $13$ TeV. The vertical bars and empty boxes represent the statistical and systematic uncertainties, respectively. | 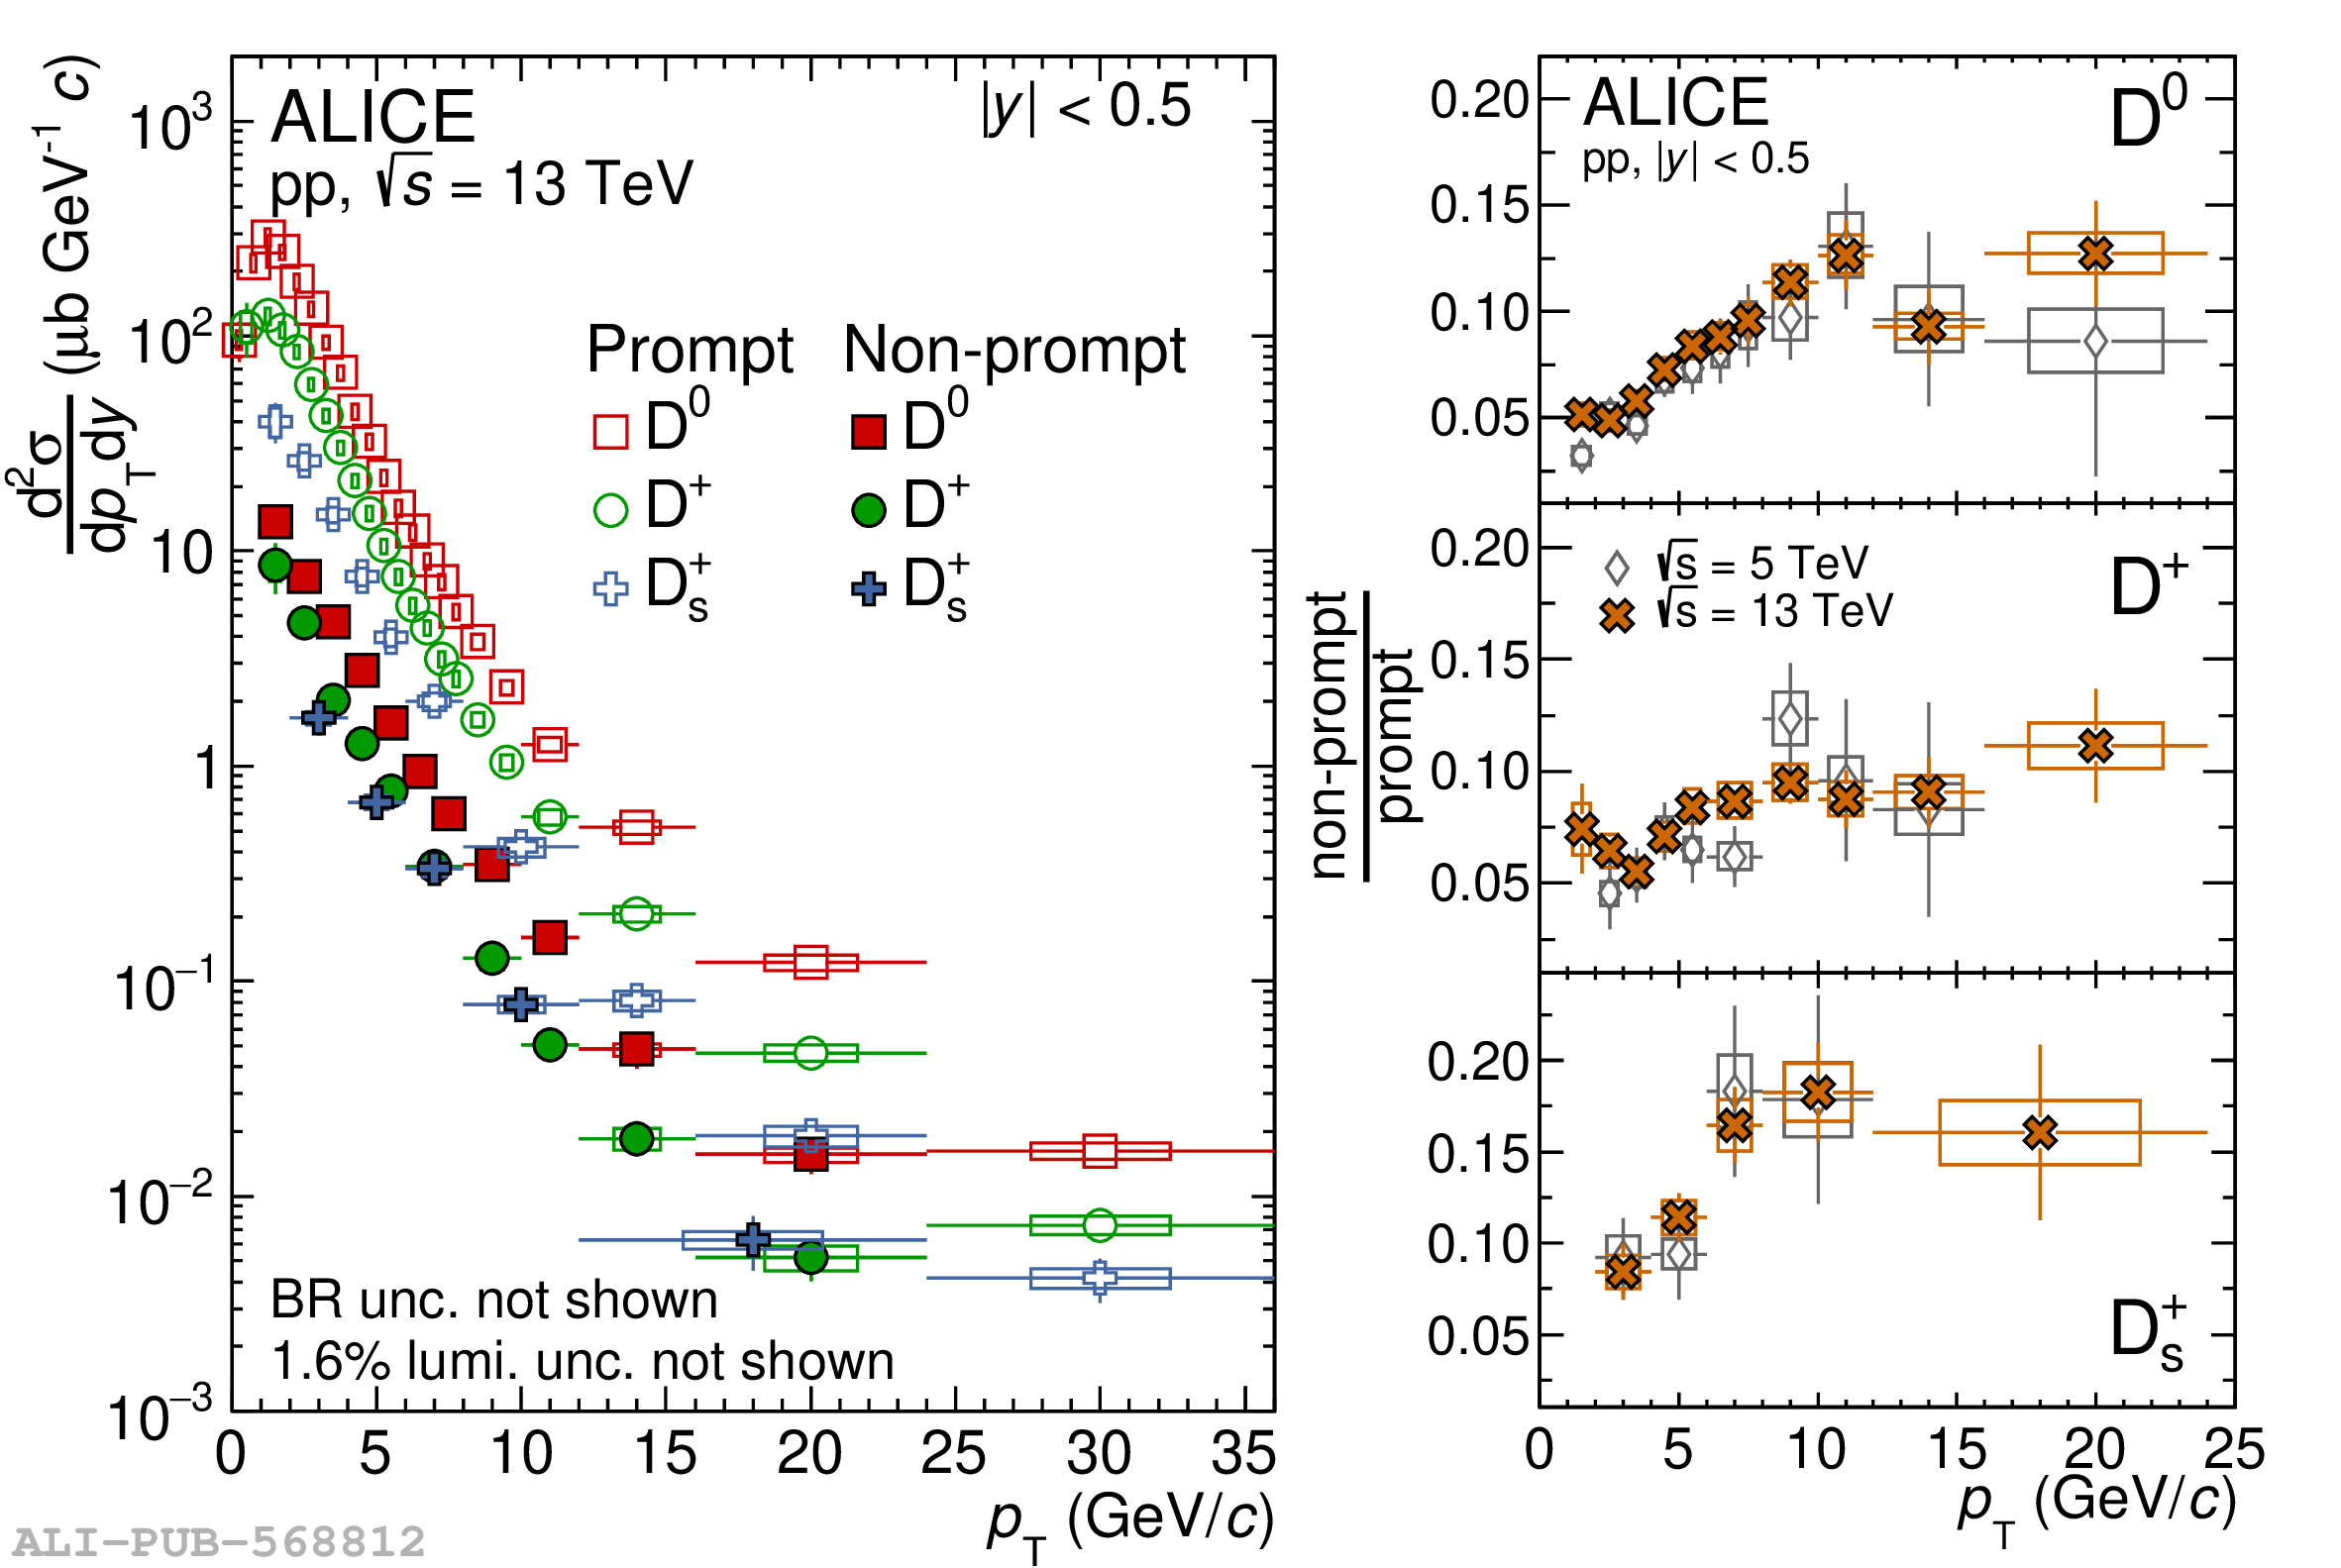 |
Figure 4
$\pt$-differential production cross sections of non-prompt $\Dzero$ (top-left), $\Dplus$ (top-right), and $\Ds$ (bottom) mesons at midrapidity, $|y|< 0.5$, in pp collisions at $\s=13$ TeV compared with the predictions from FONLL + PYTHIA 8 , GM-VFNS , and TAMU + PYTHIA 8 calculations. The lower panels report the data-to-model ratios. The vertical bars and empty boxes represent the statistical and systematic uncertainties, respectively. | 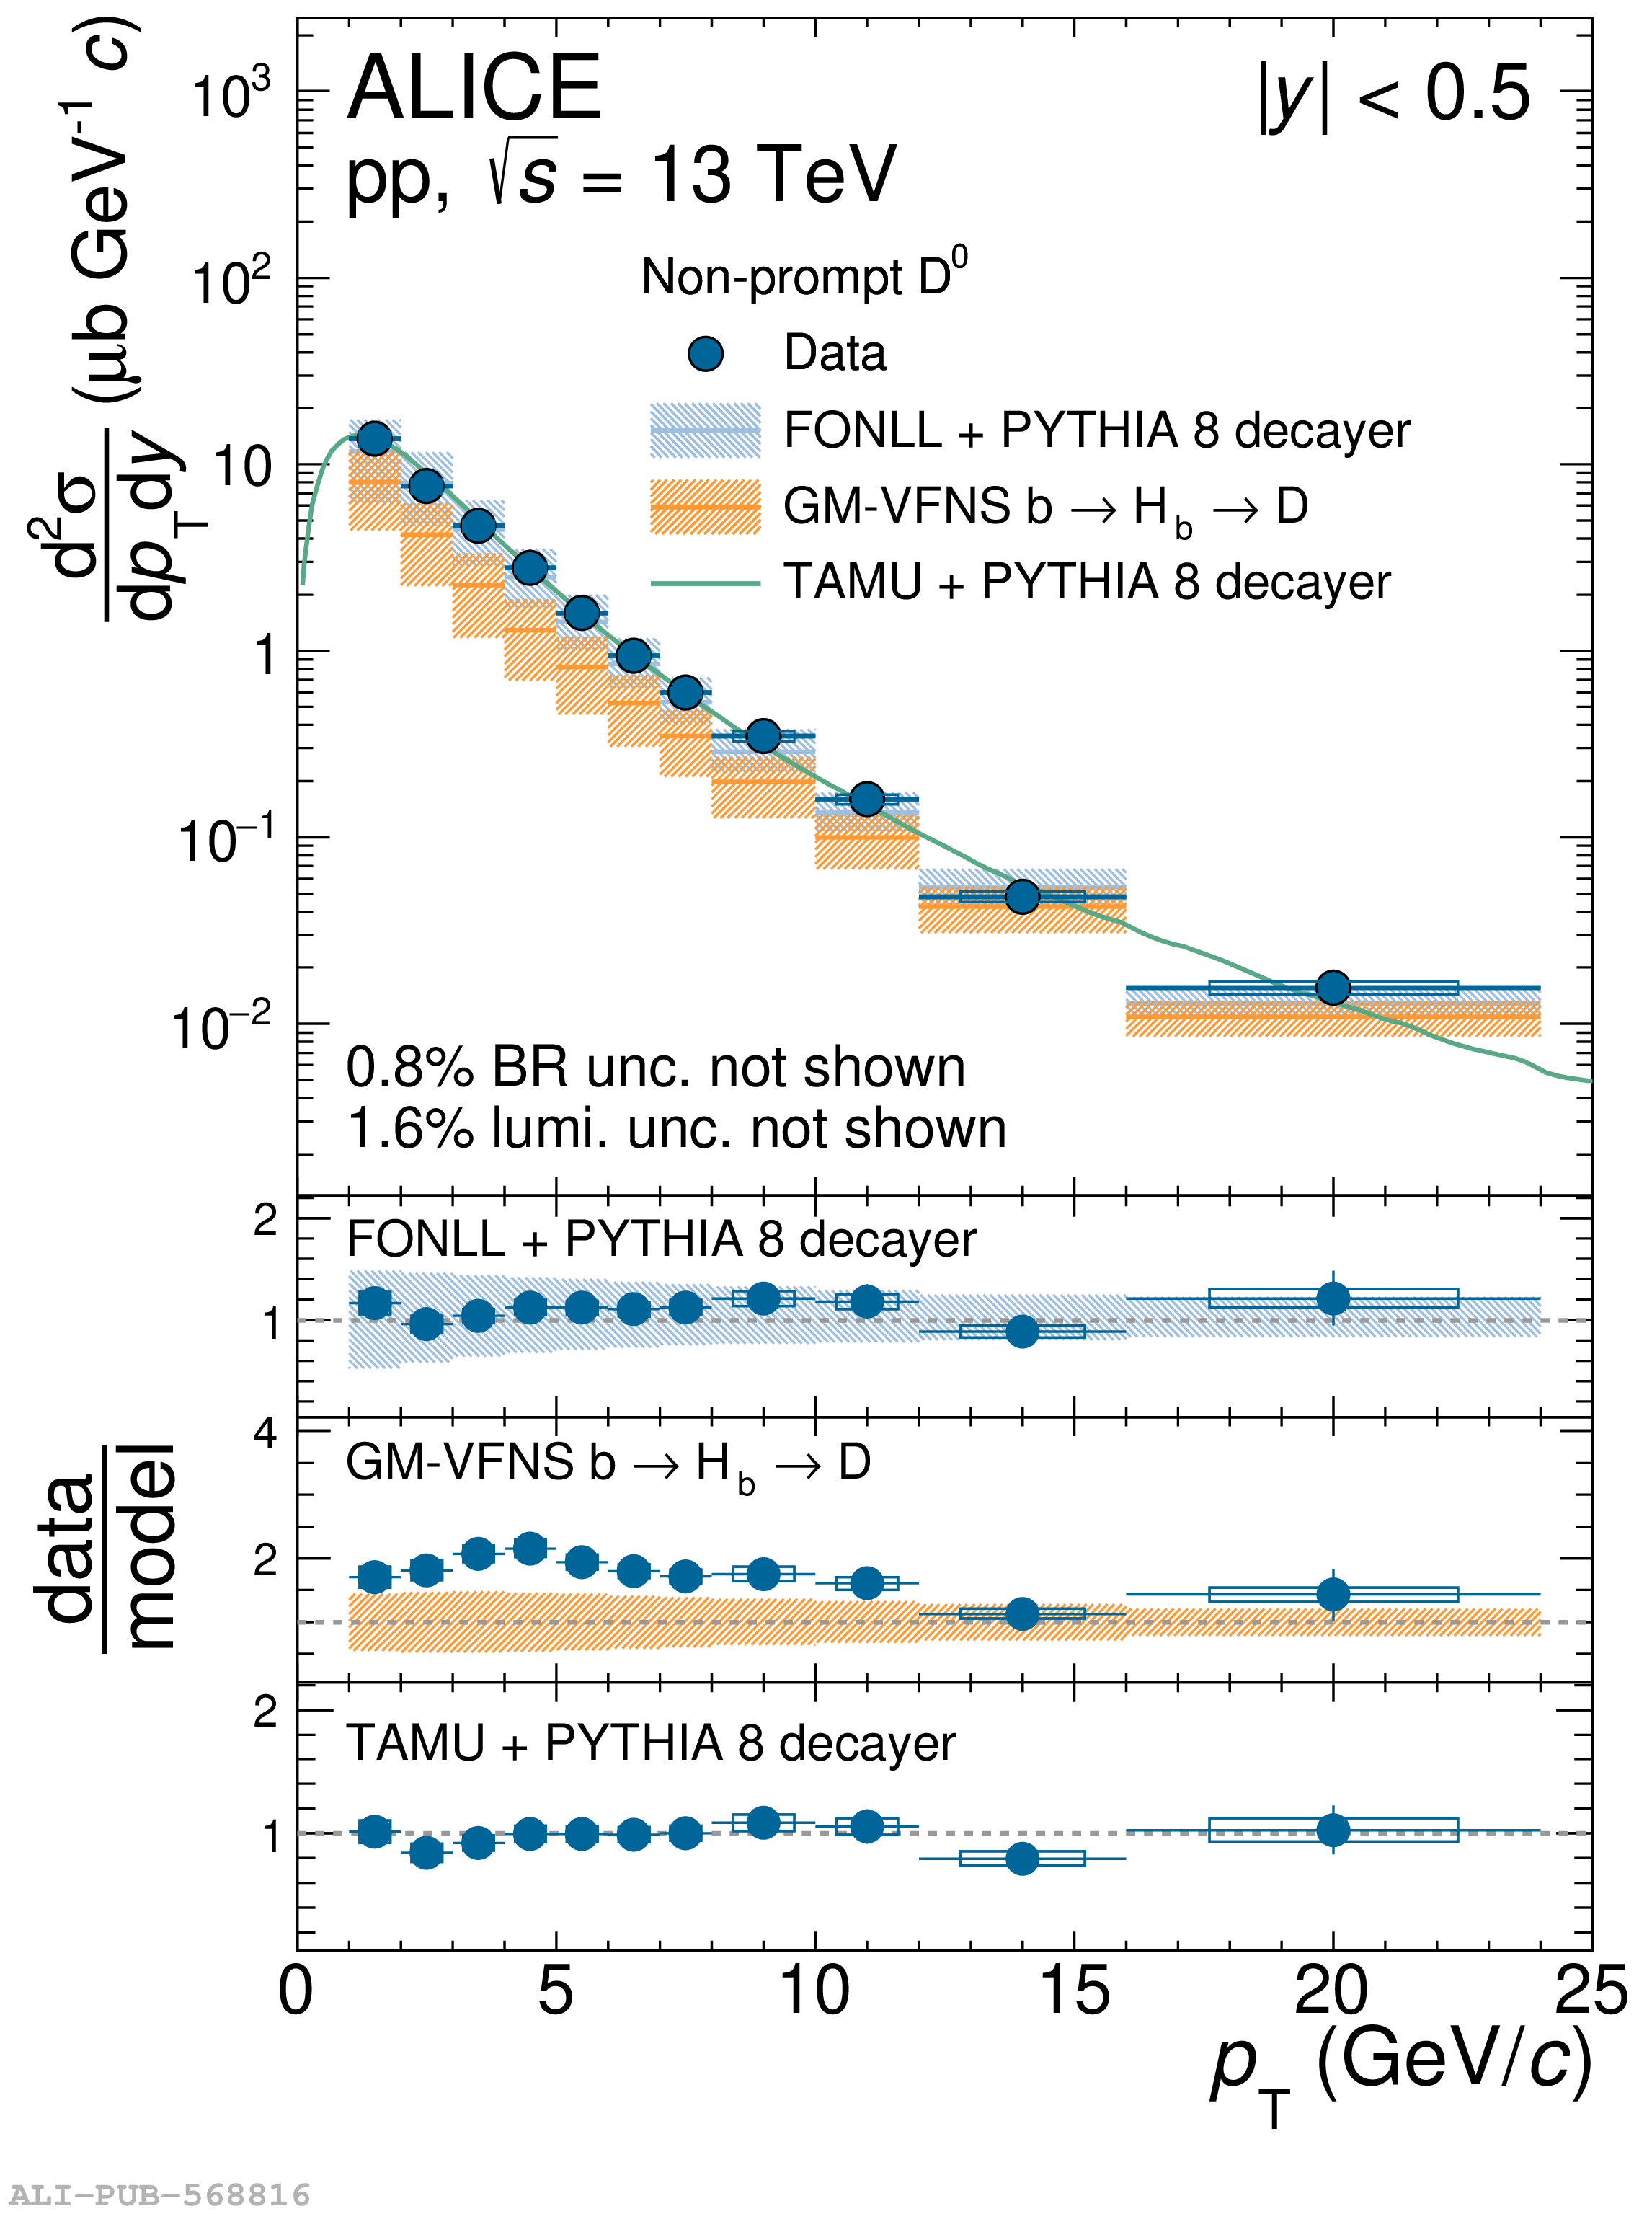 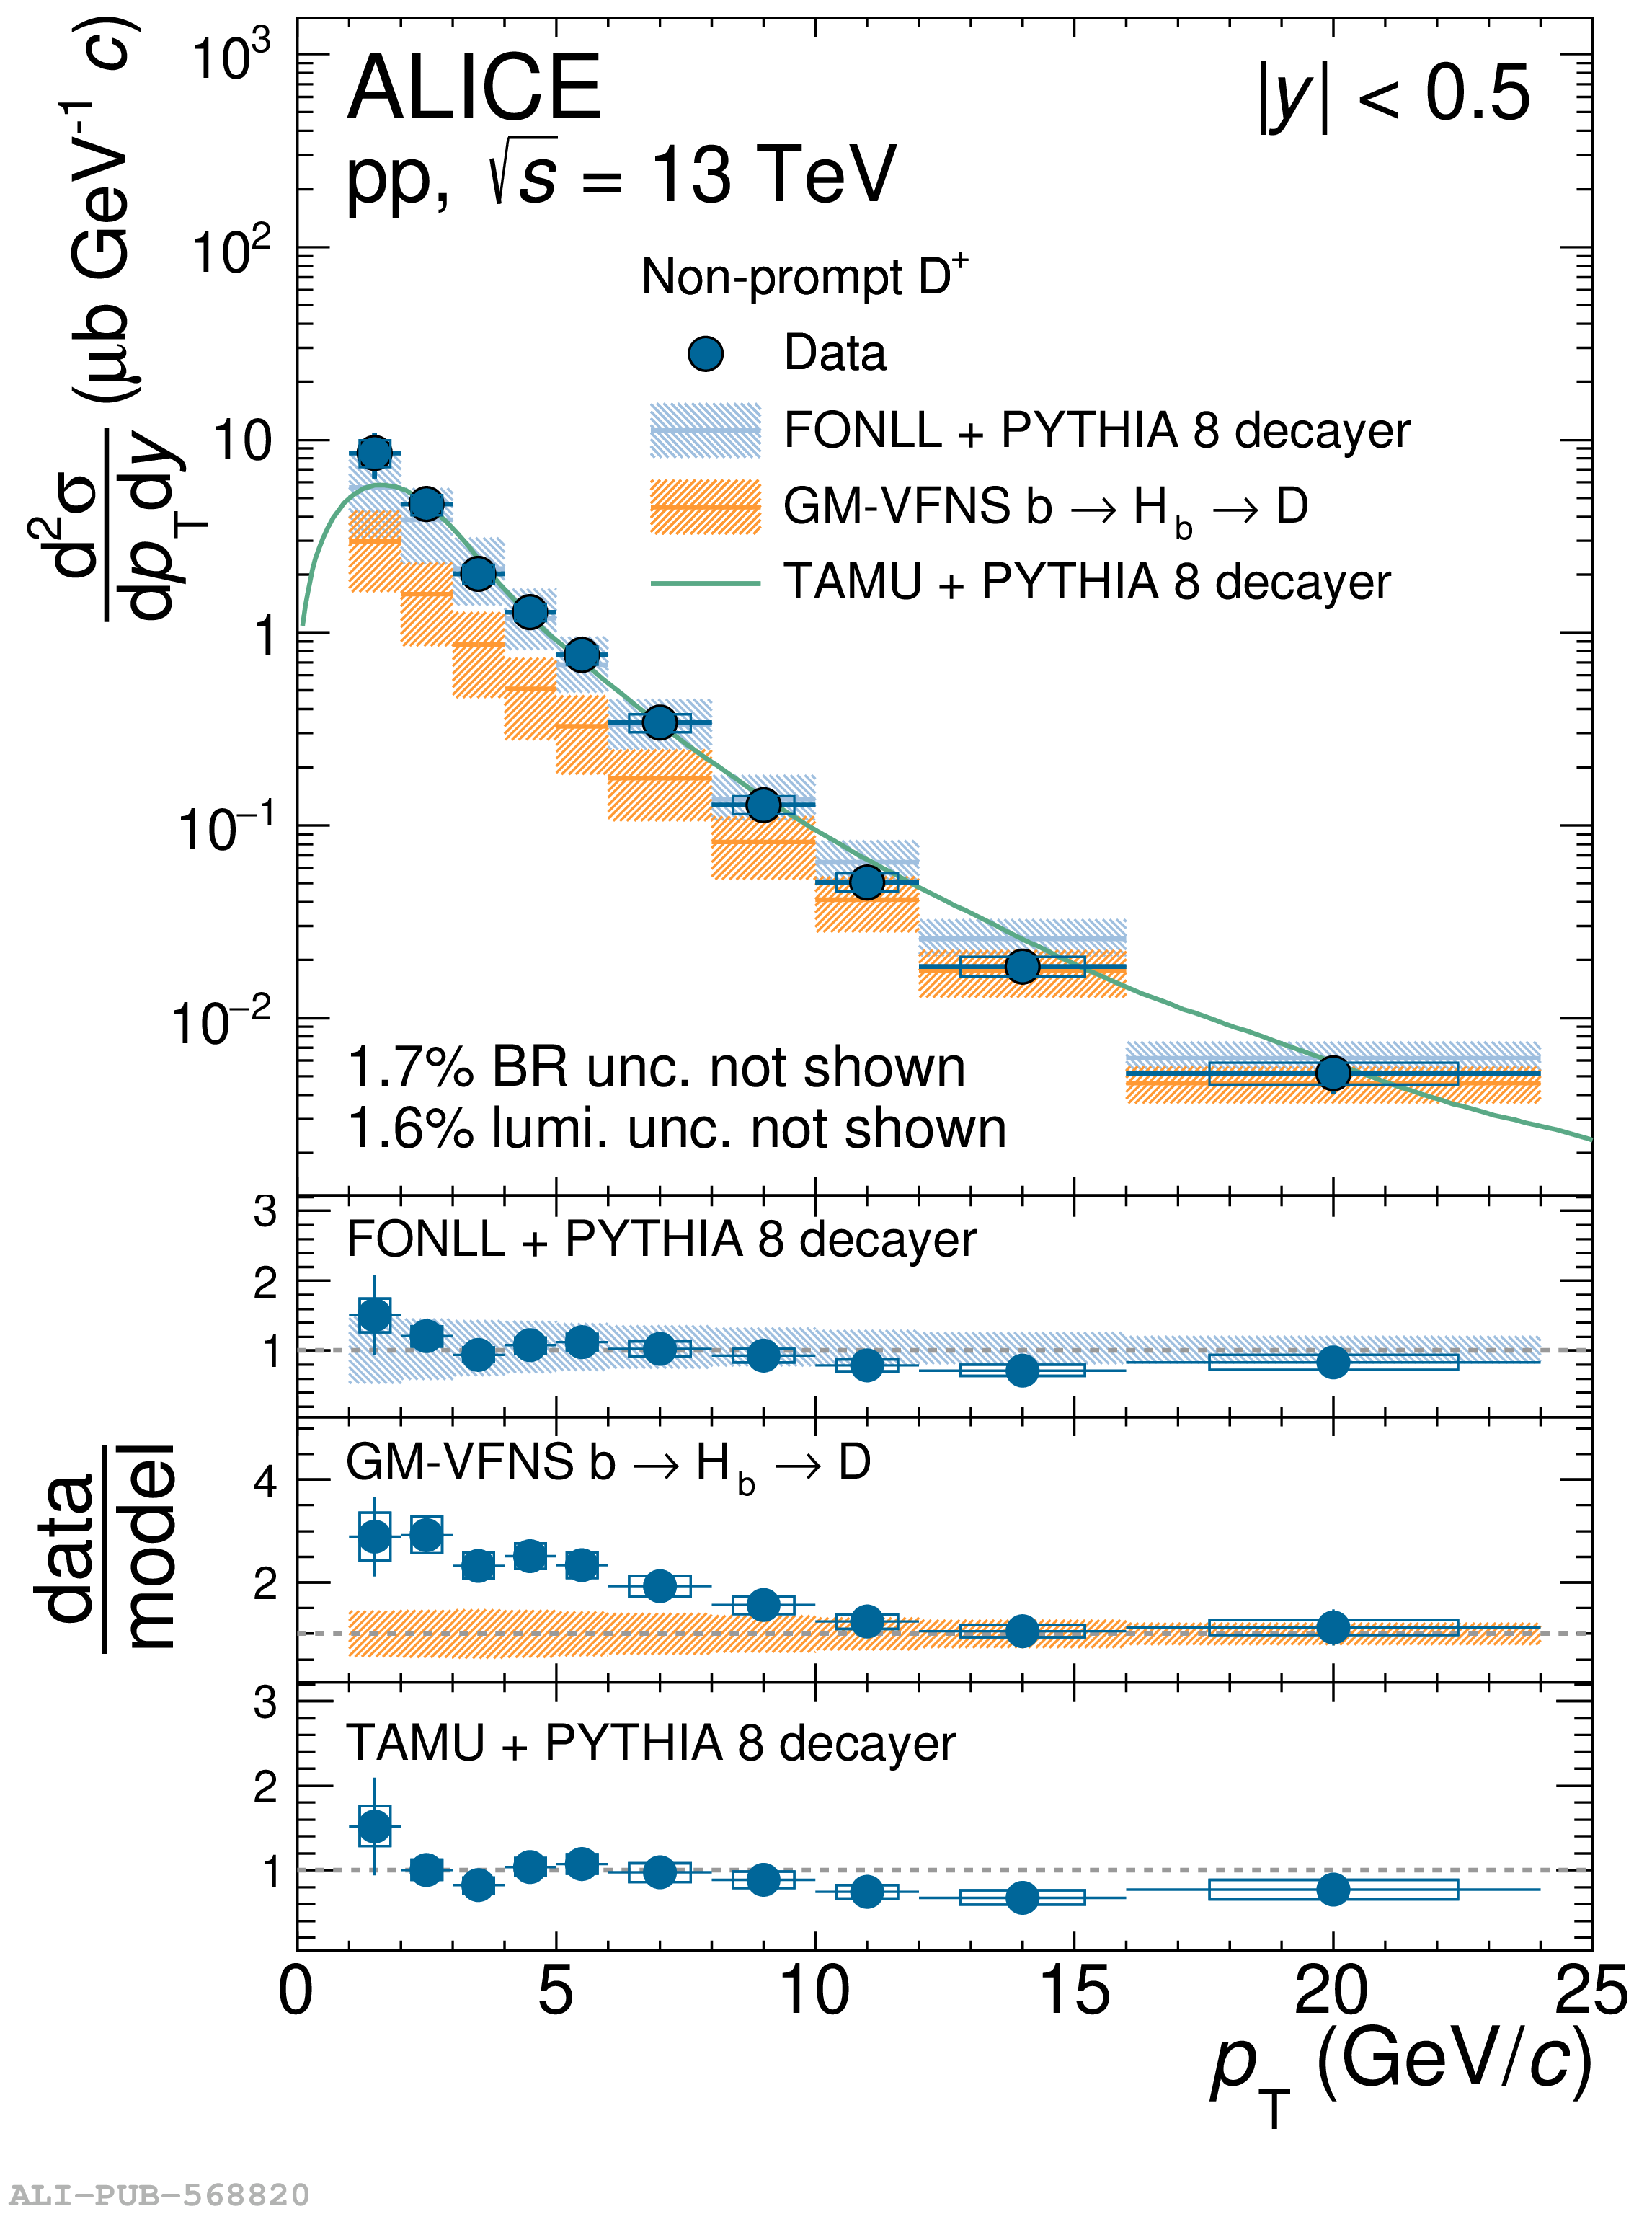 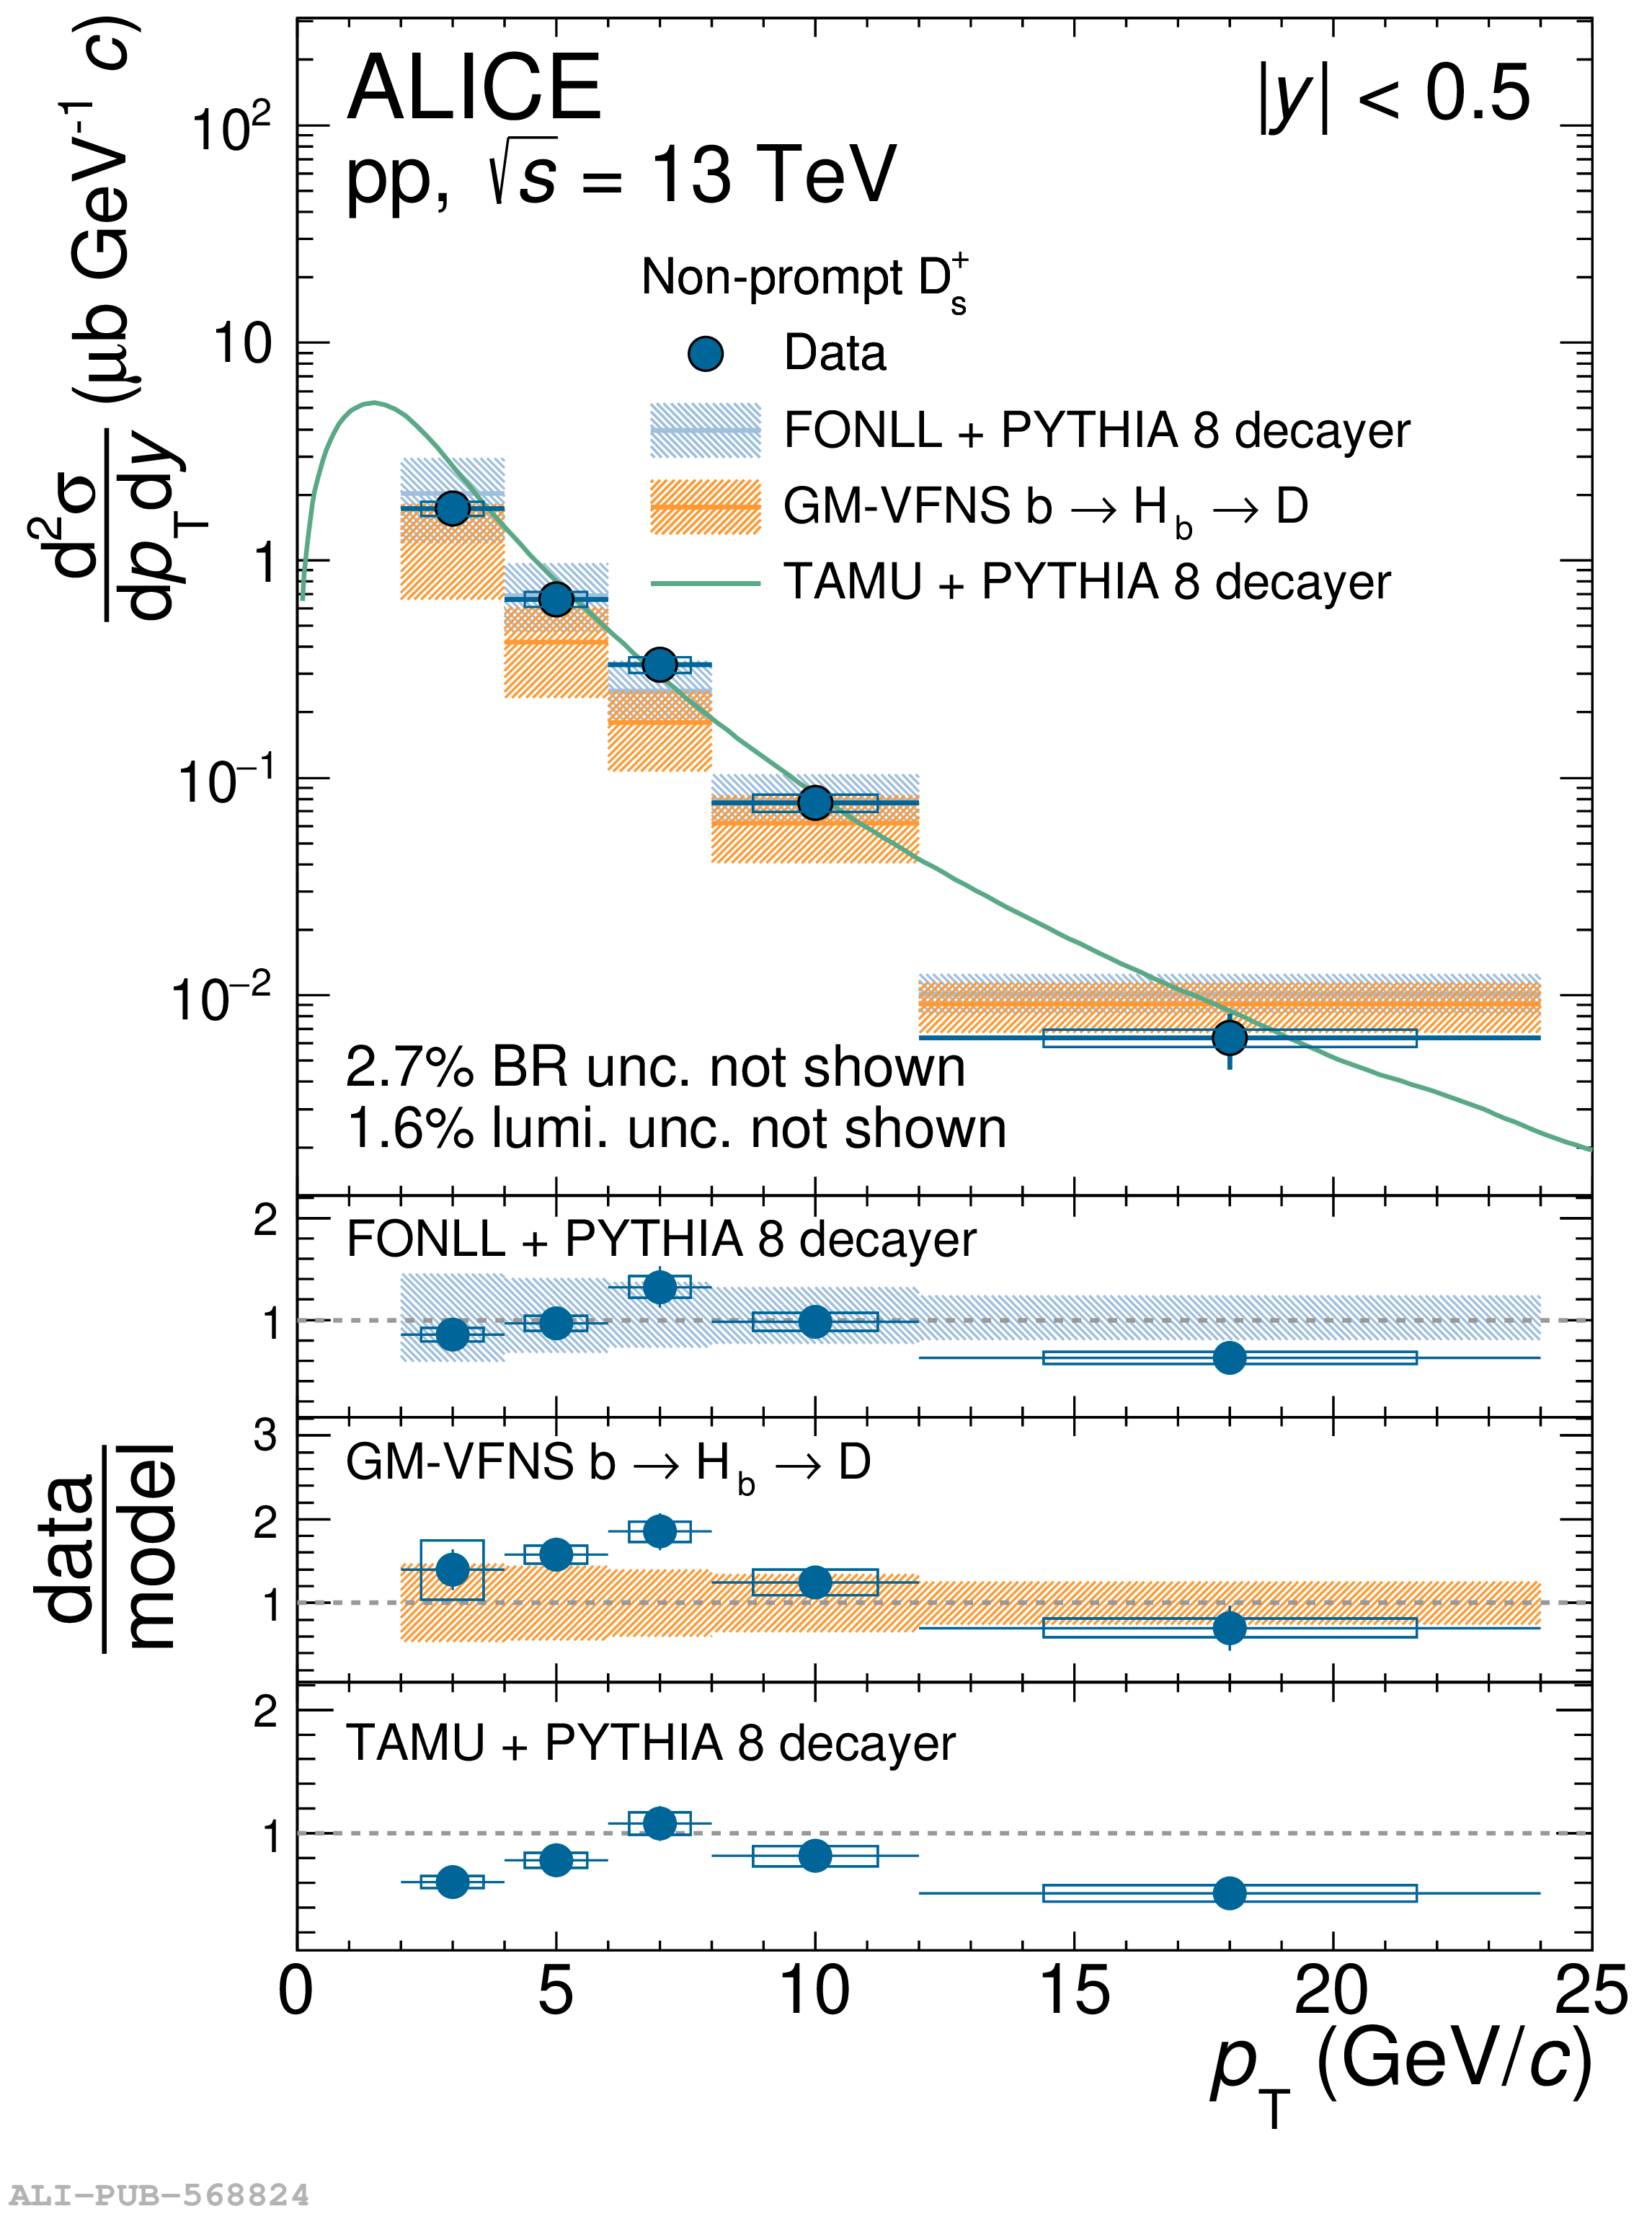 |
Figure 5
Top: ratios of prompt and non-prompt D-meson production cross sections as a function of $\pt$ in pp collisions at $\s = 5.02$ and 13 TeV. Bottom: ratios of prompt and non-prompt D-meson production cross sections as a function of $\pt$ in pp collisions at $\s = 13$ TeV compared with FONLL+PYTHIA 8 predictions The vertical bars and empty boxes report the statistical and systematic uncertainties, respectively. | 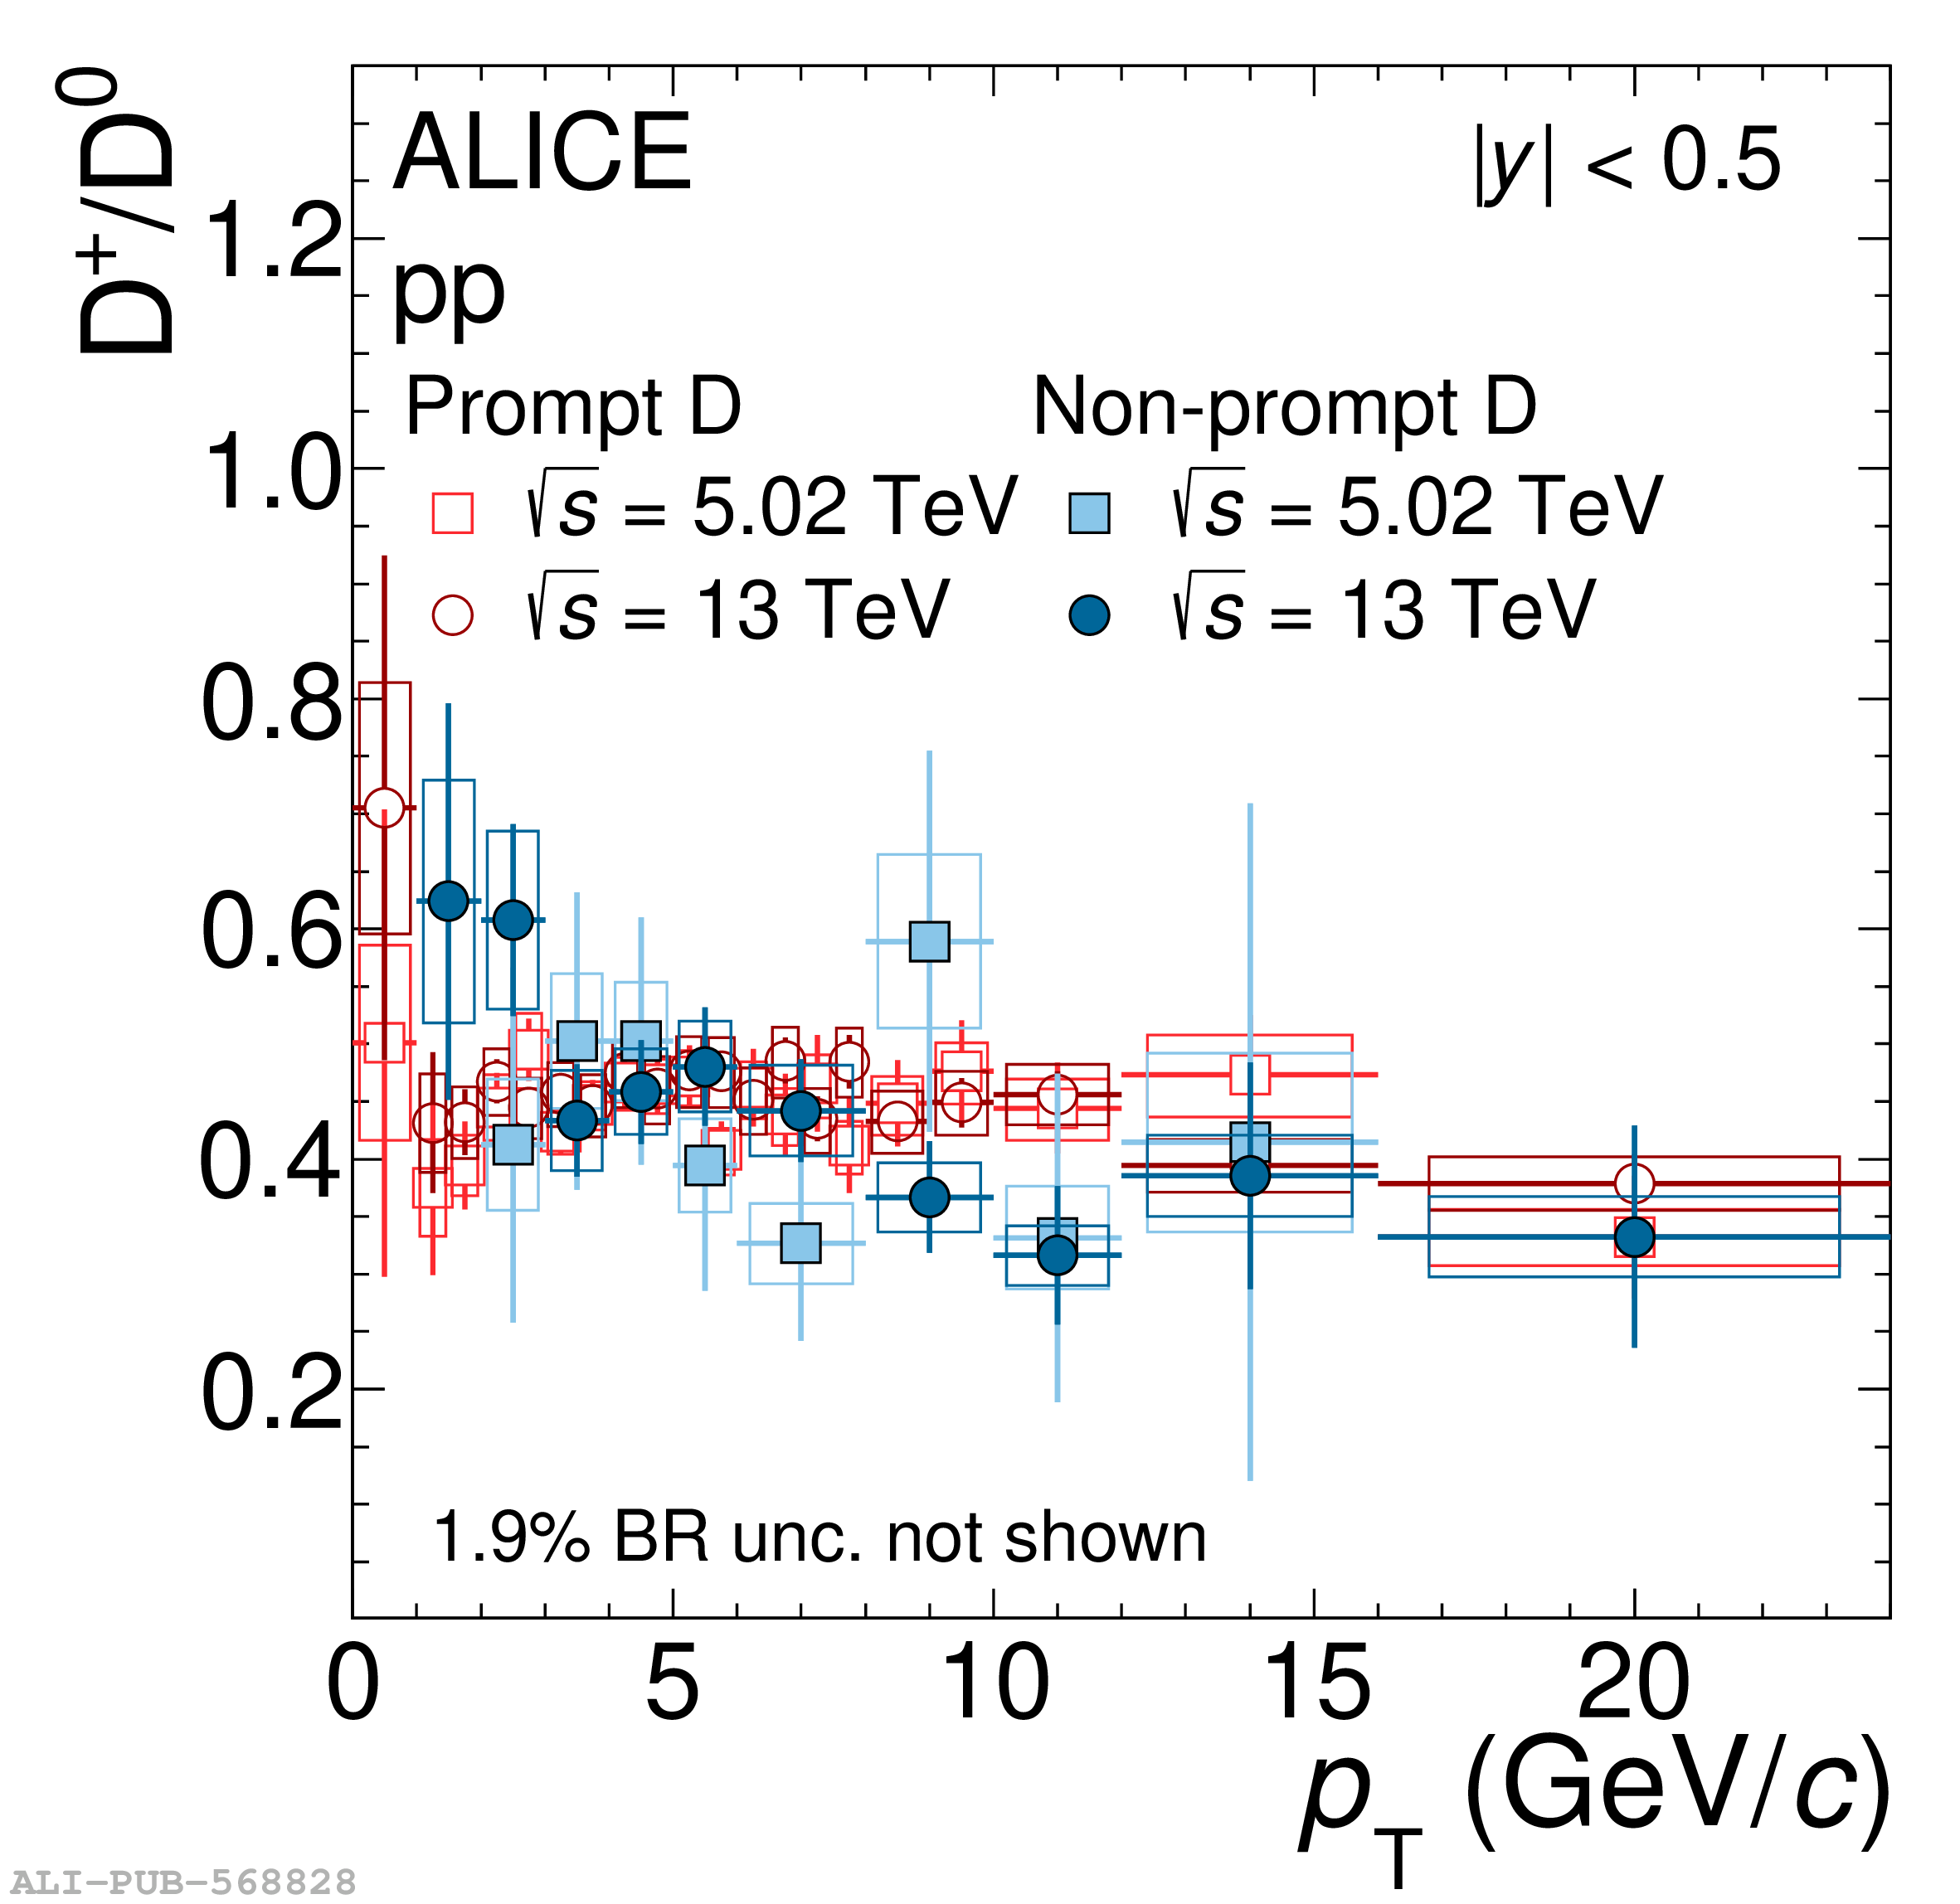 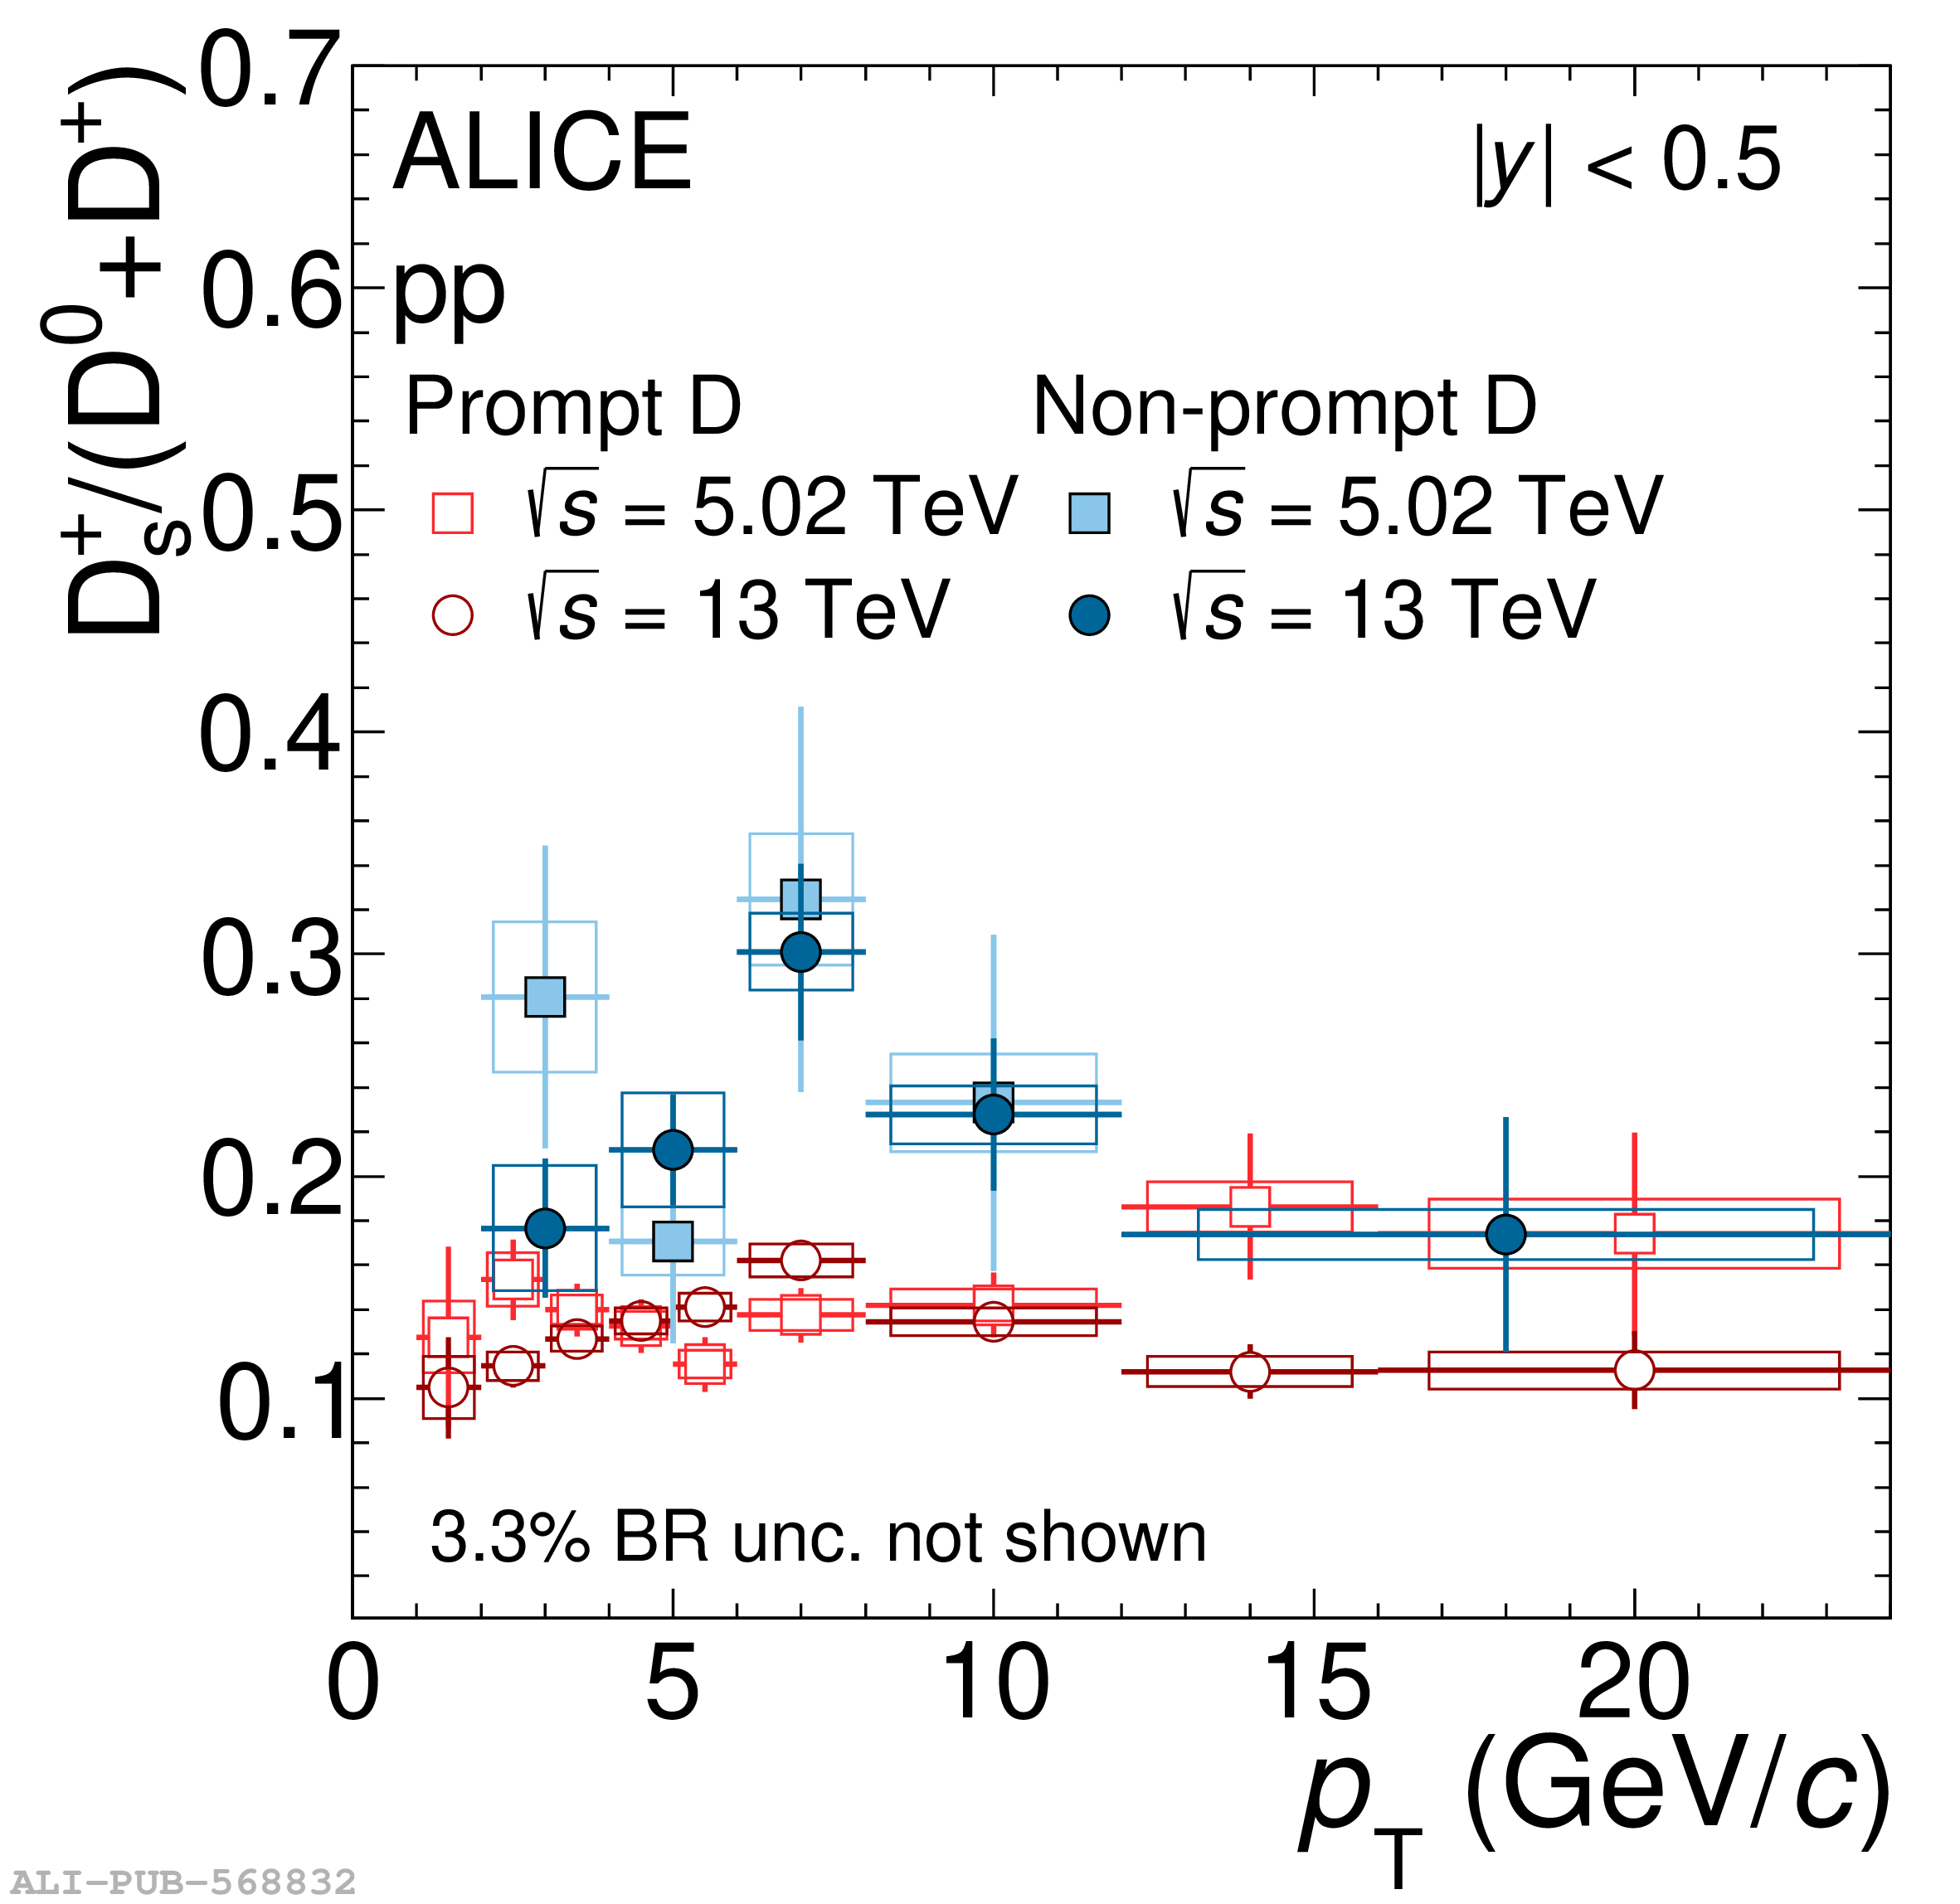 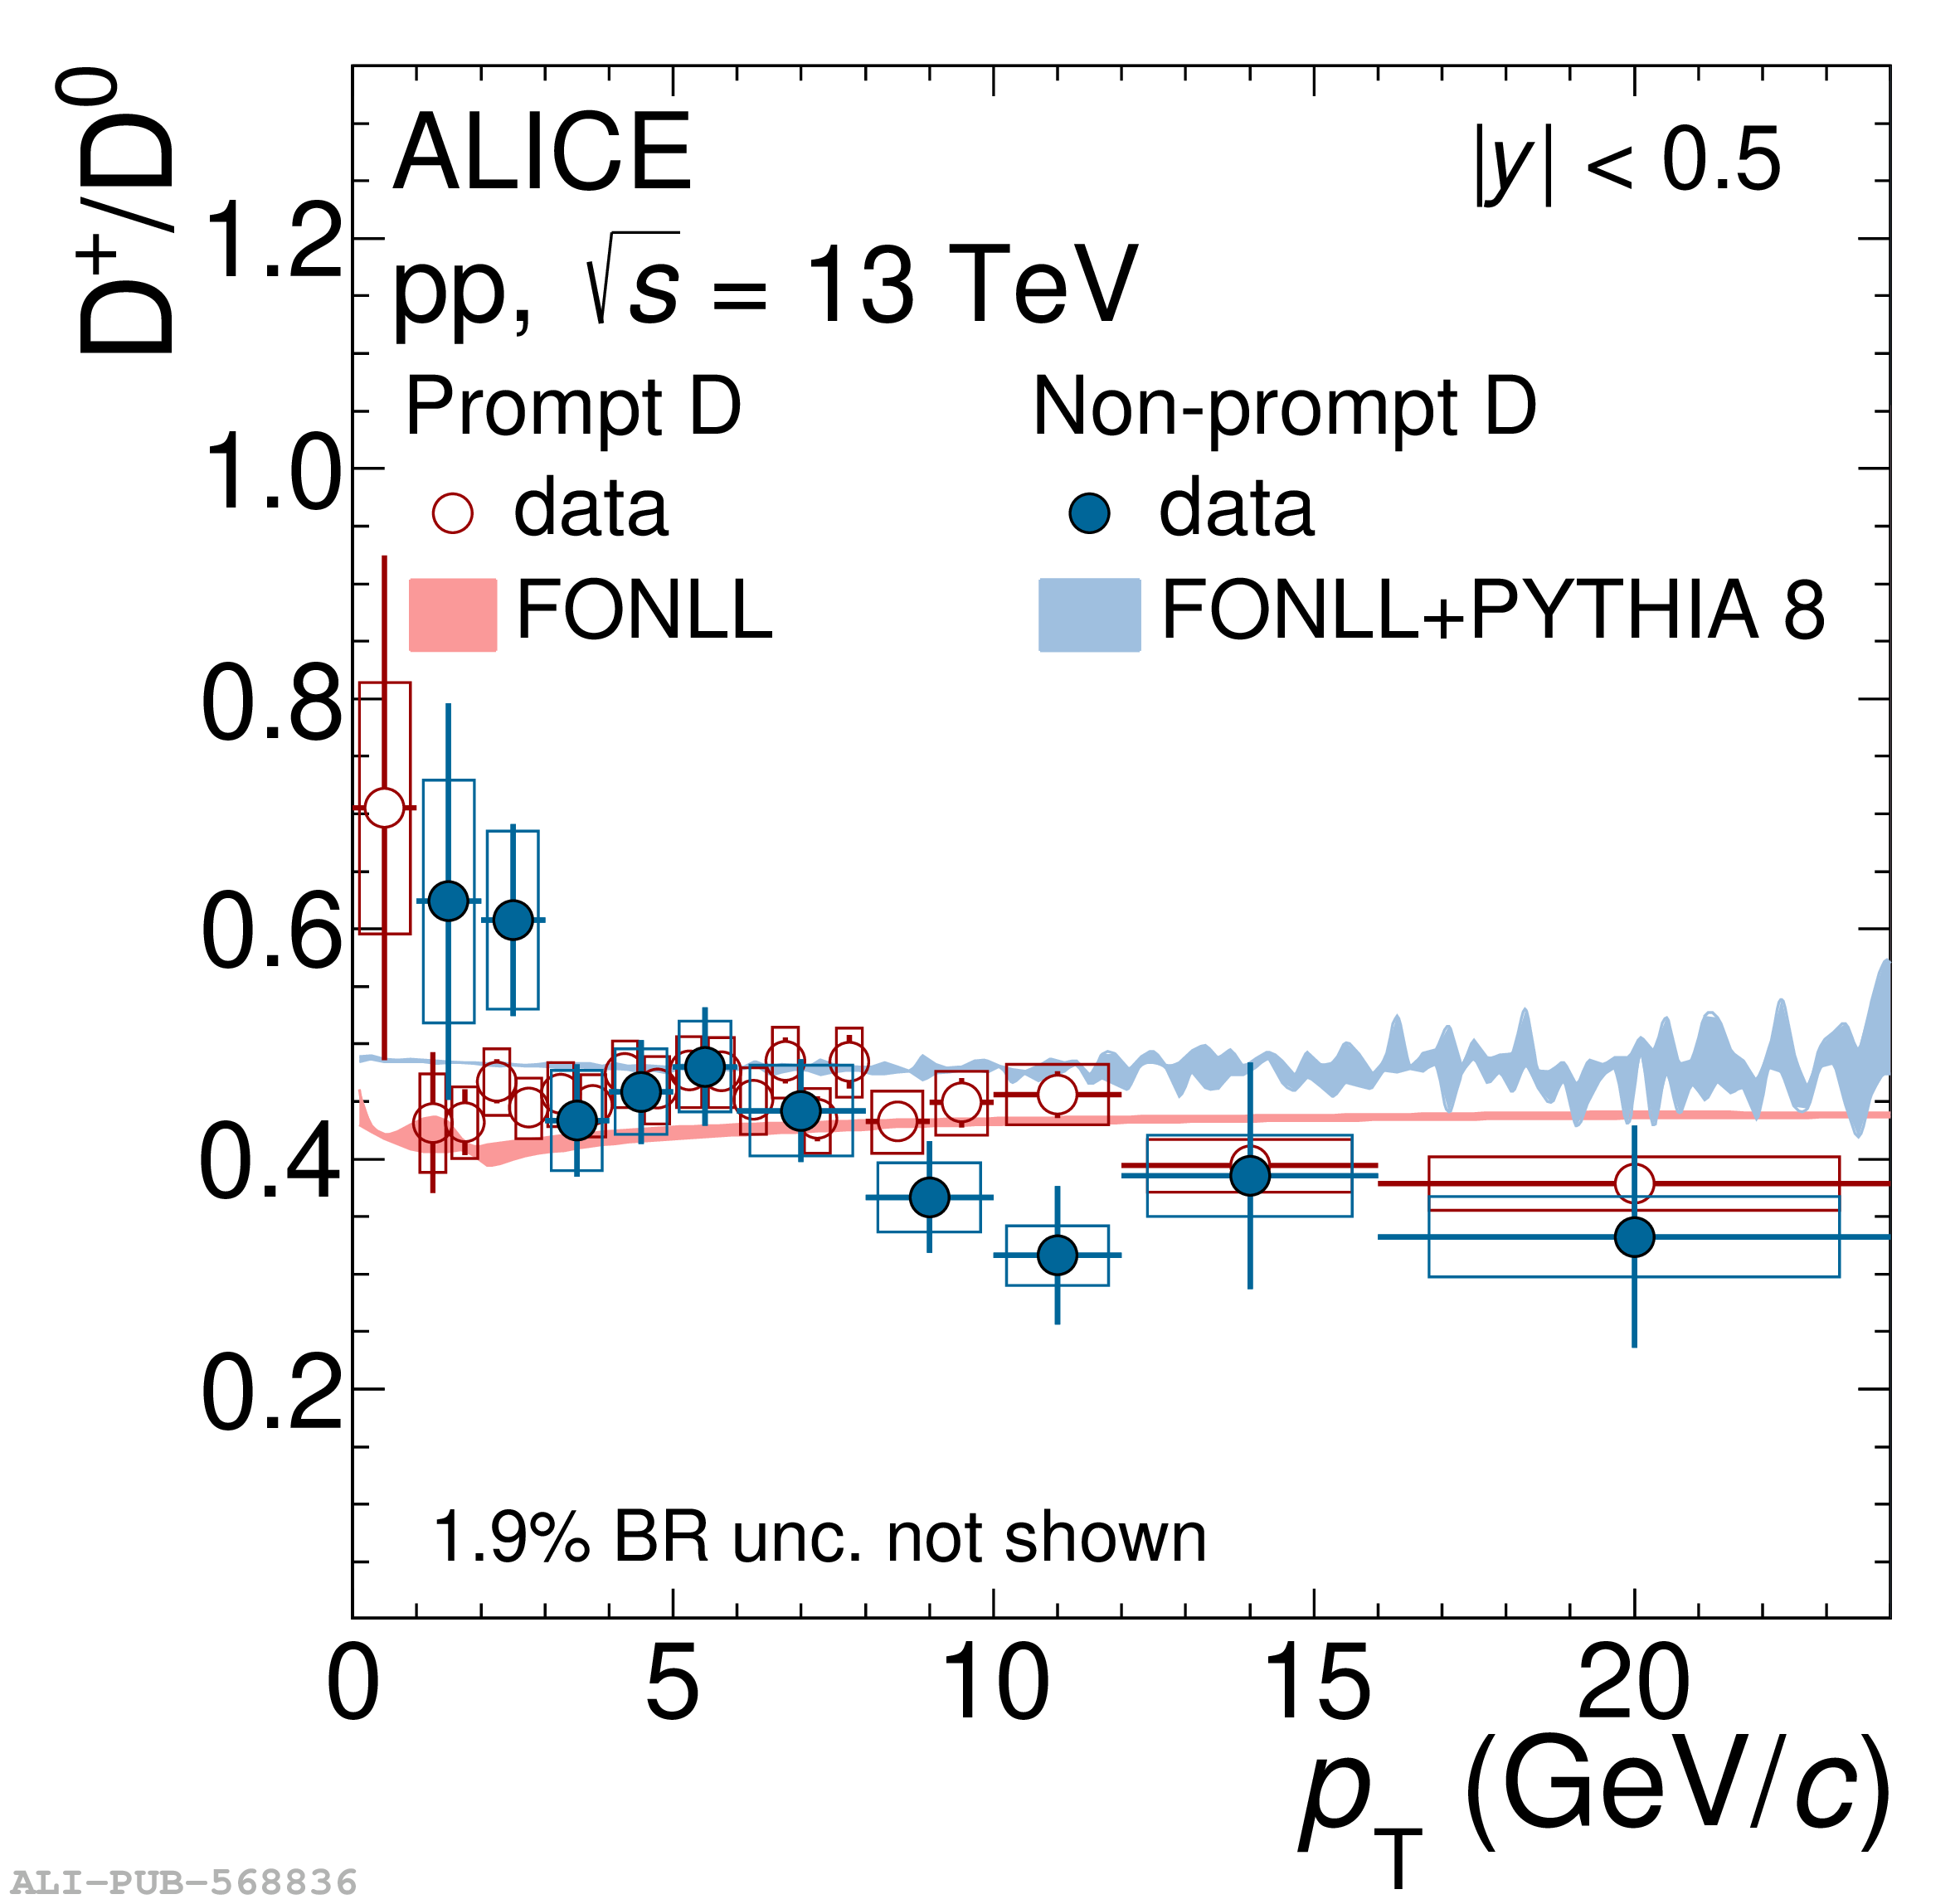 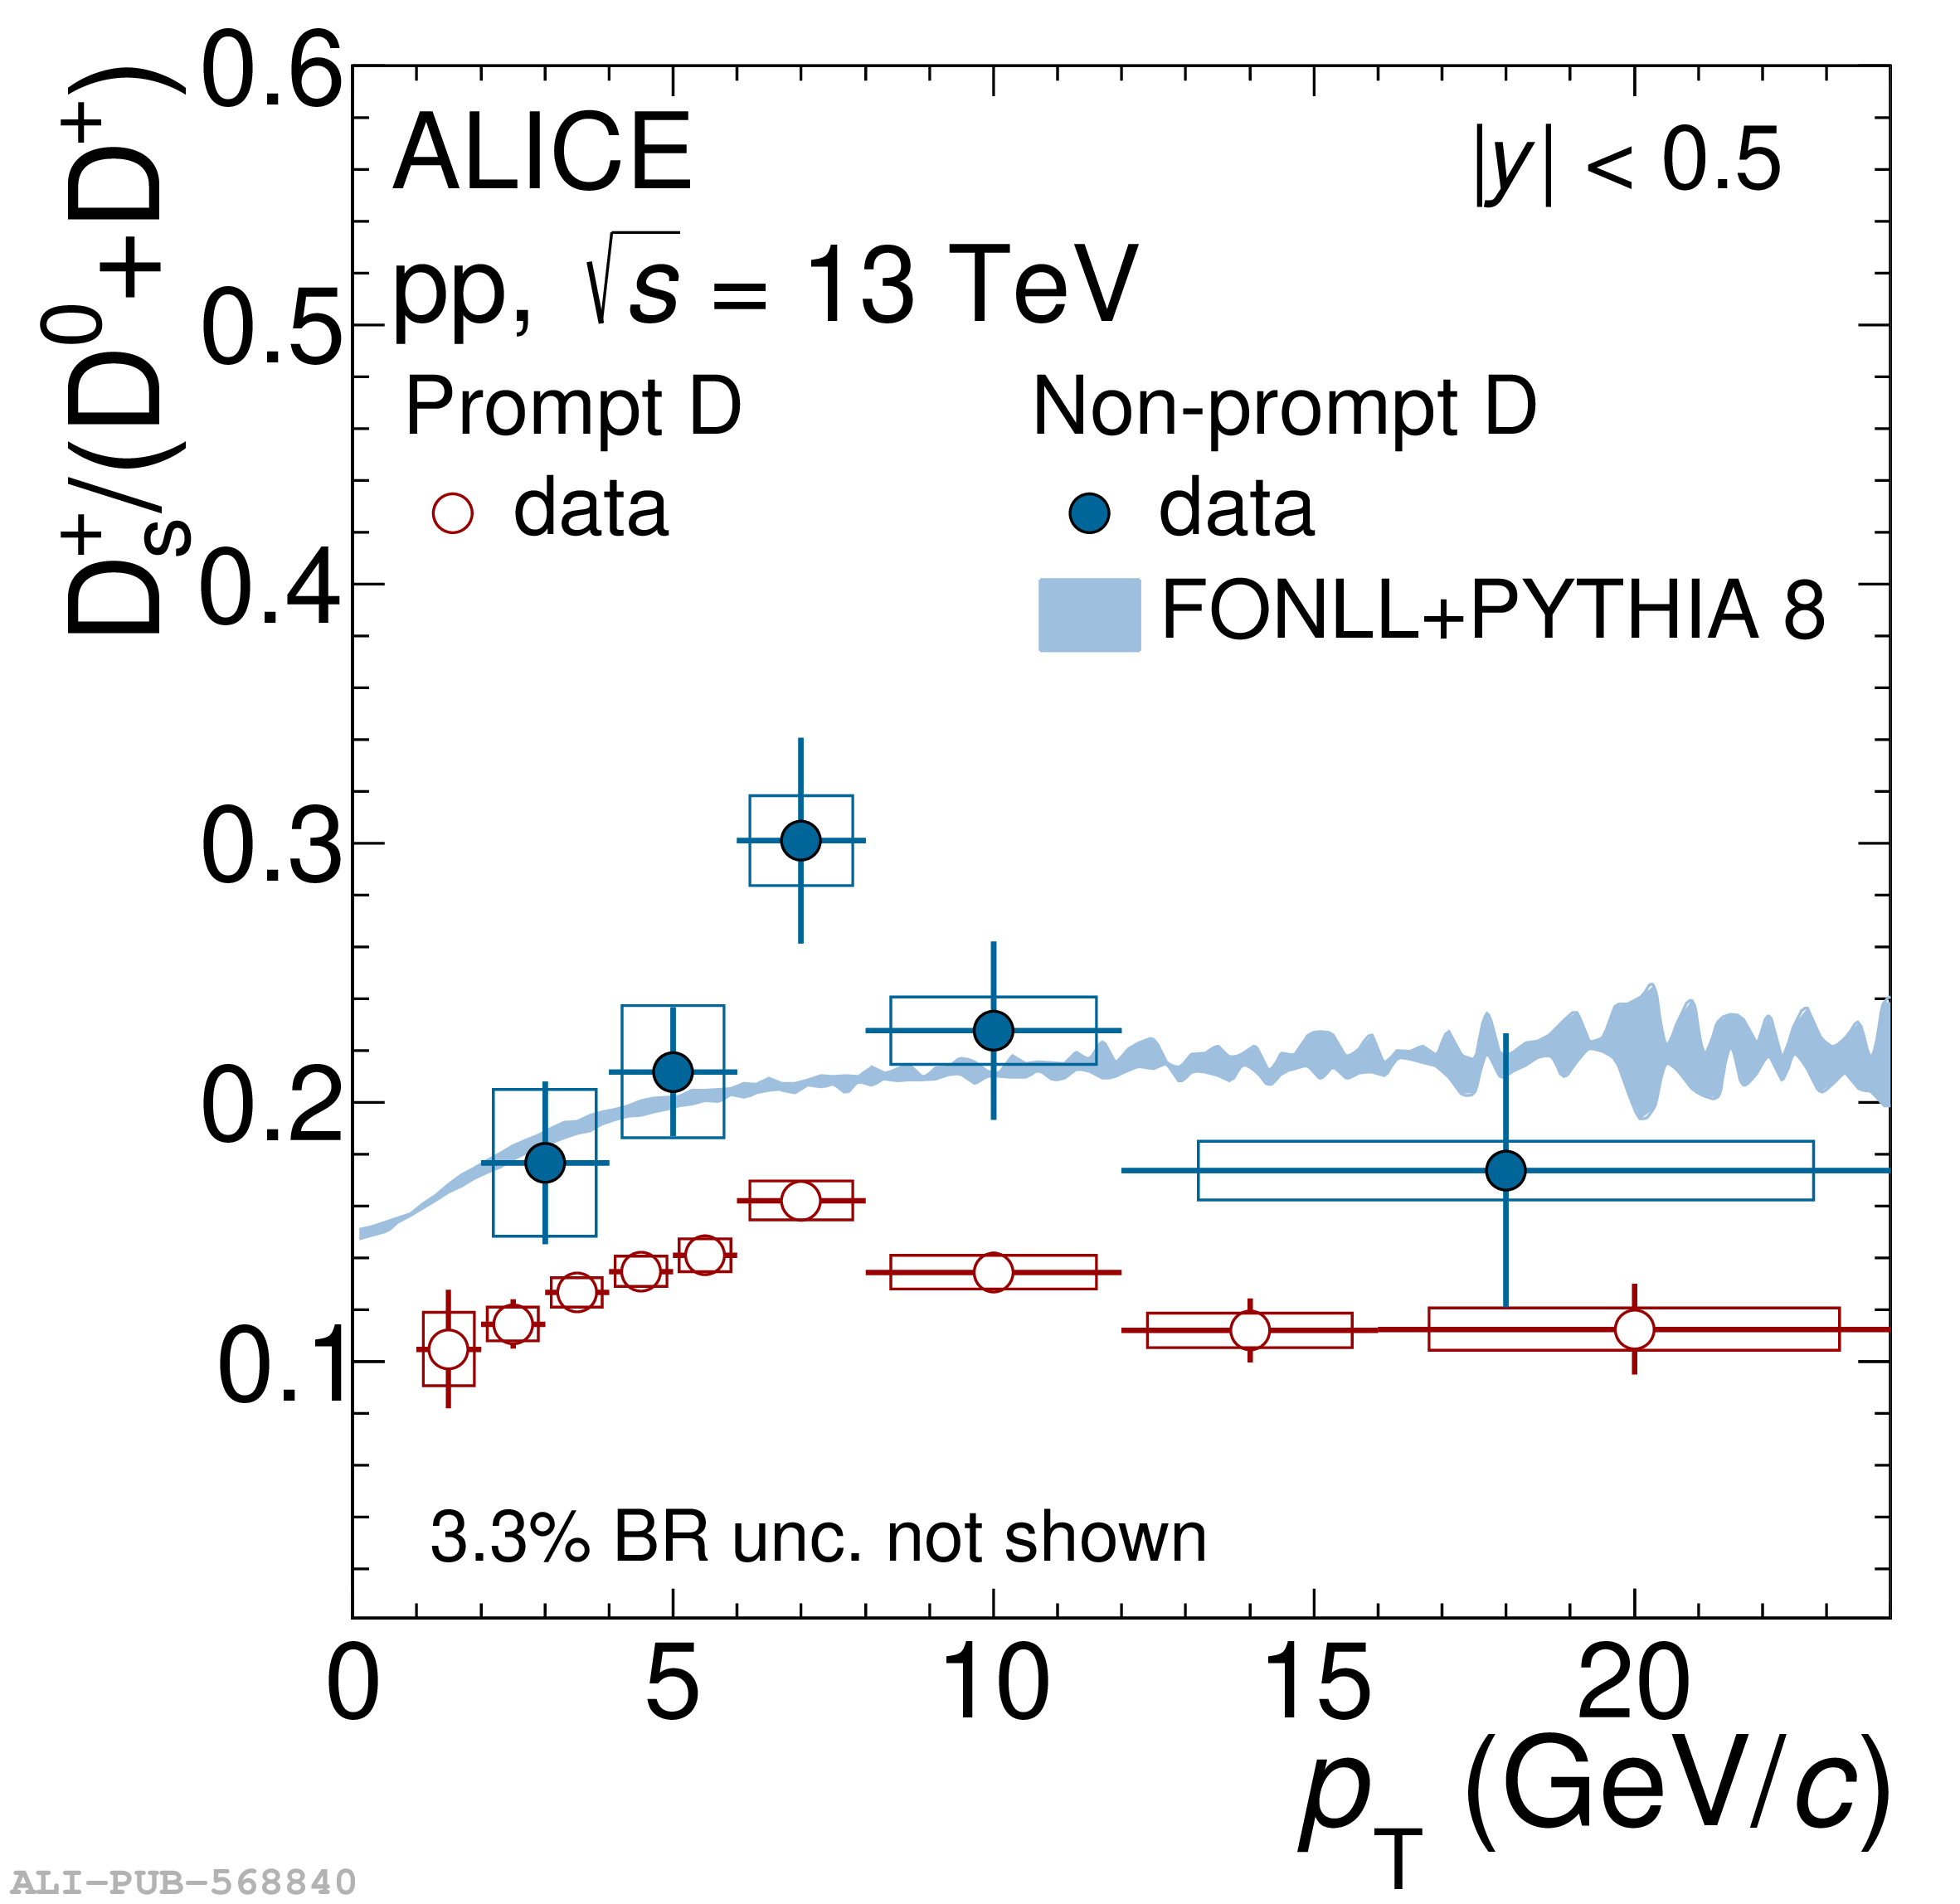 |
Figure 6
Beauty-quark fragmentation-fraction ratio $f_{\rm s}/(f_{\rm u} + f_{\rm d})$ calculated from non-prompt D-meson measurements in pp collisions at $\s=13$ TeV comparedwith previous measurements from CDF , ALICE , ATLAS , CMS and LHCb , with the average of LEP measurements , and with the results of PYTHIA 8.243 simulations with Monash-13 tune . | 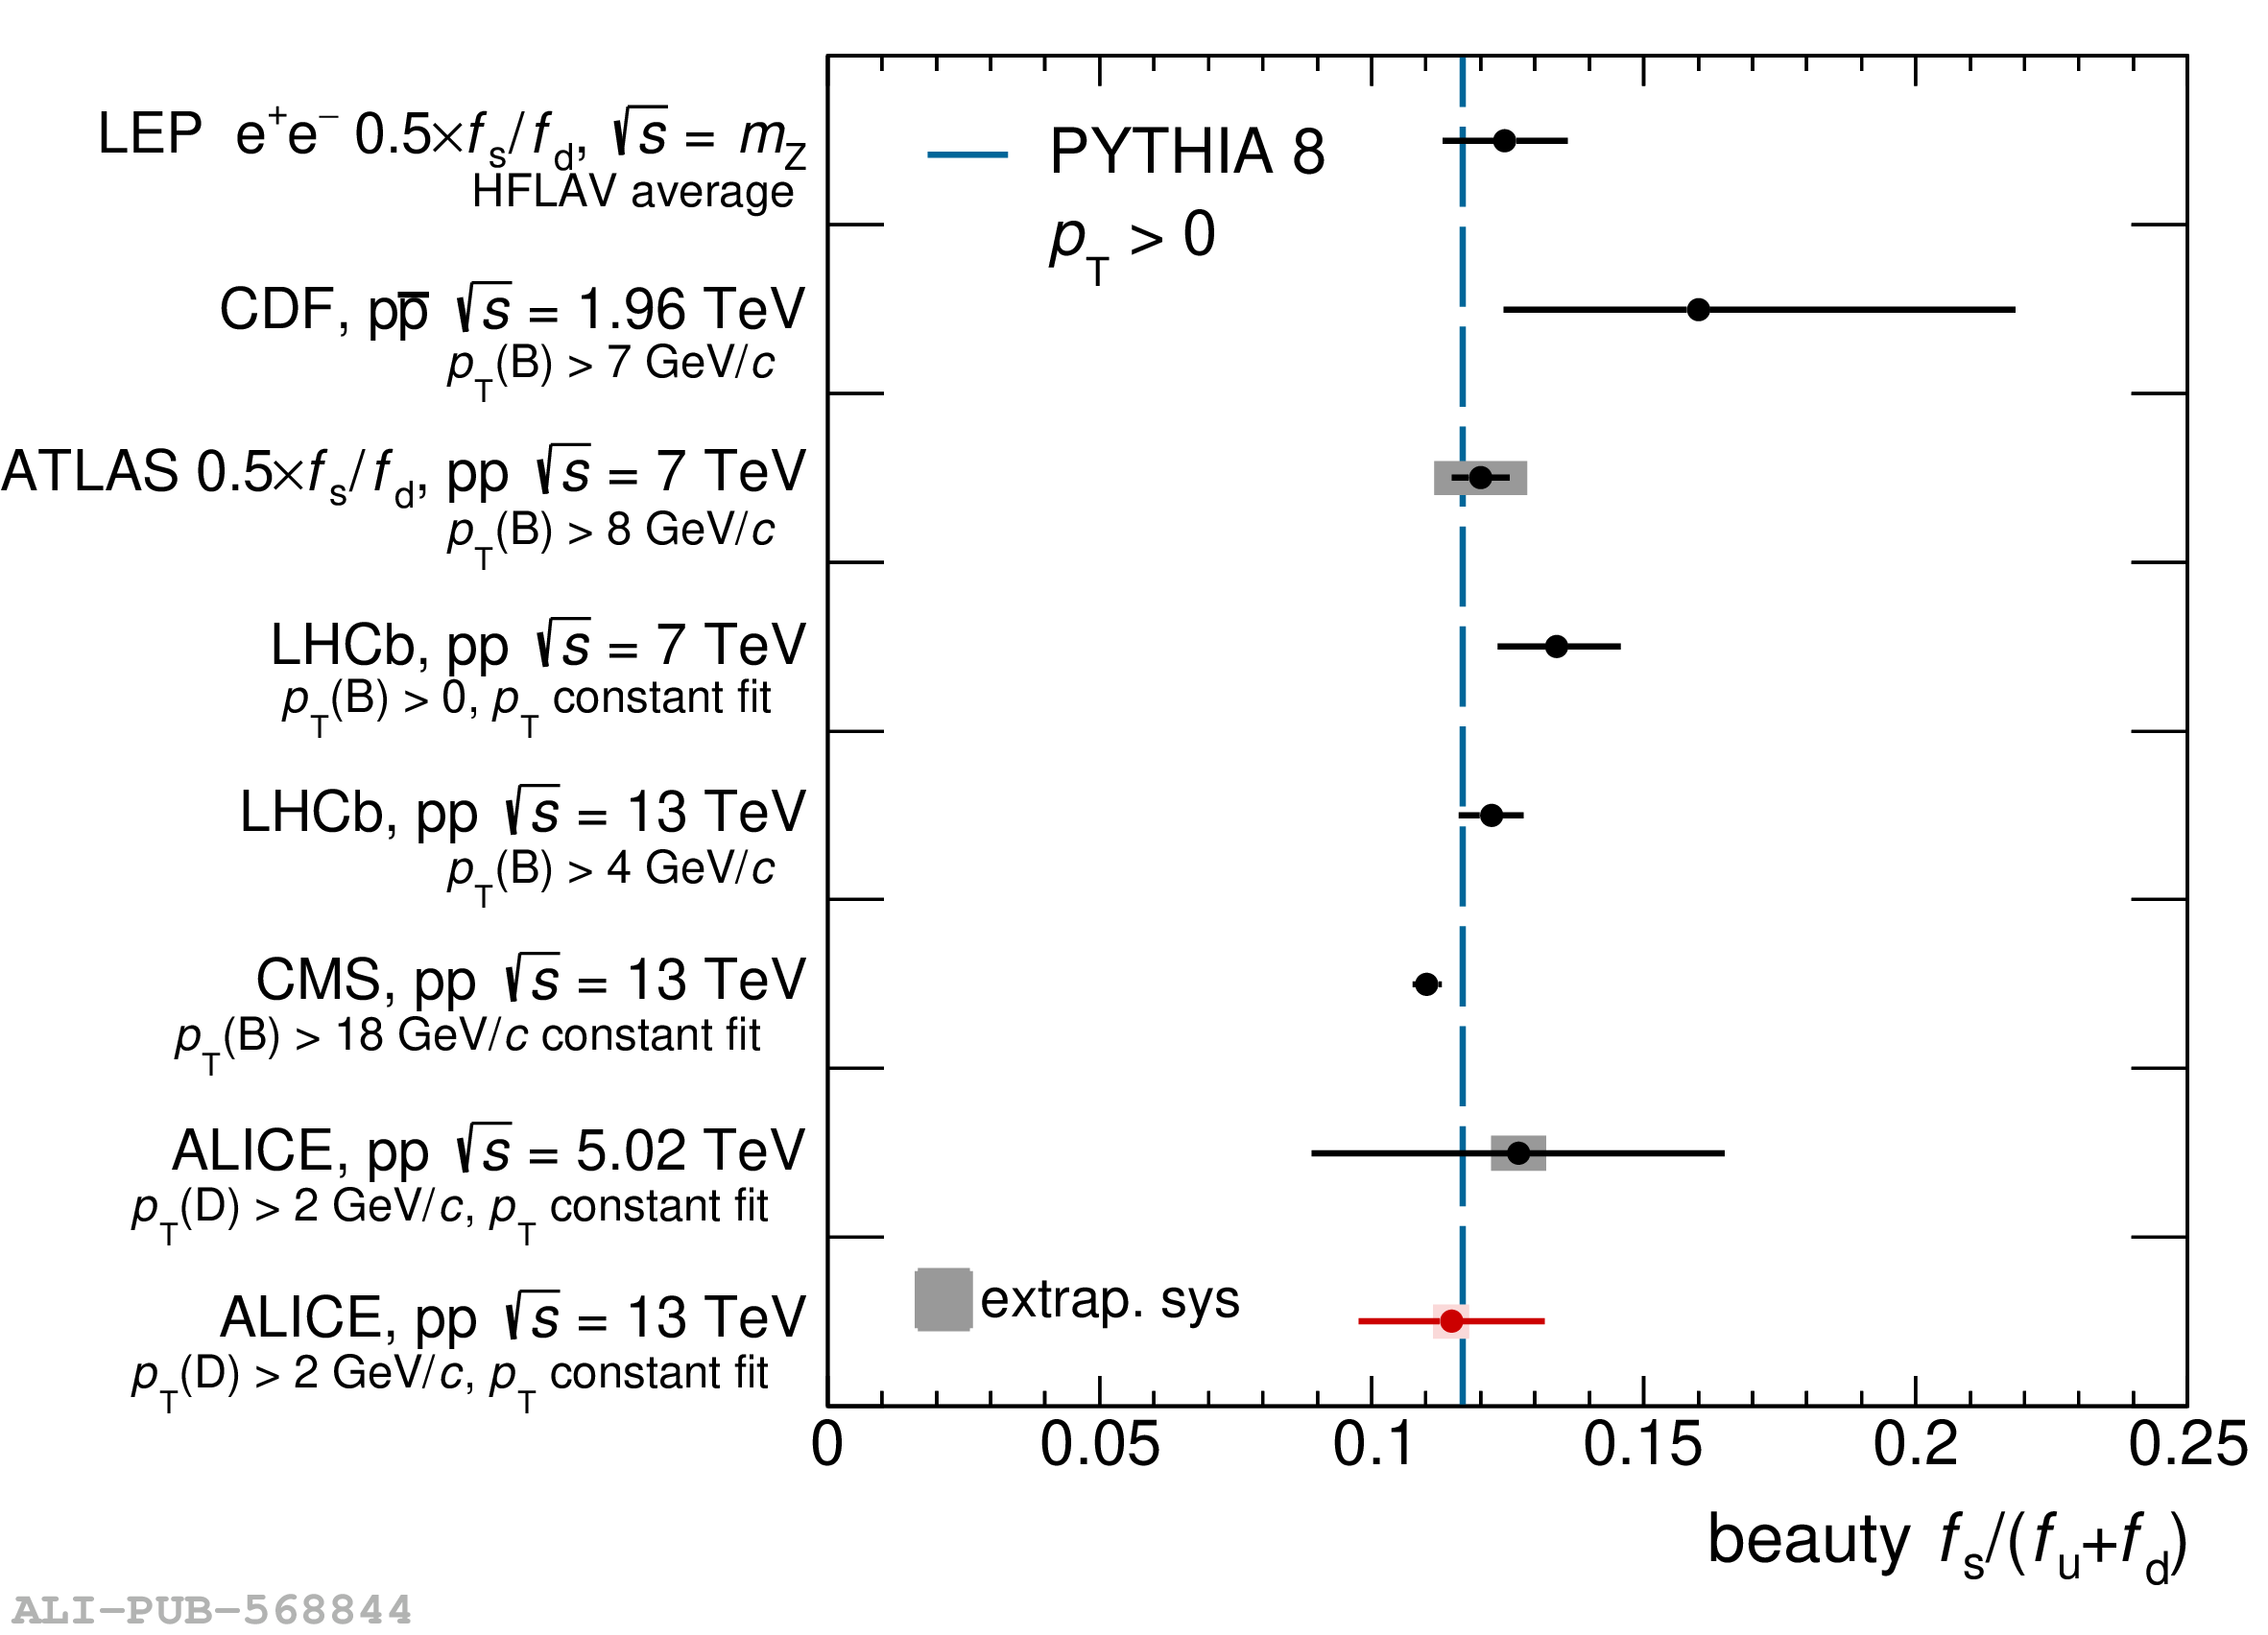 |
Figure 7
Ratios of non-prompt D-meson production cross sections at $\s = 13$ and $5.02$ TeV as a function of $\pt$. Left: comparison of measurements for $\Dzero$, $\Dplus$, and $\Ds$ mesons. Right: comparison of $\Dzero$ results with FONLL+PYTHIA 8 calculations. The vertical bars and empty boxes report the statistical and systematic uncertainties, respectively. | 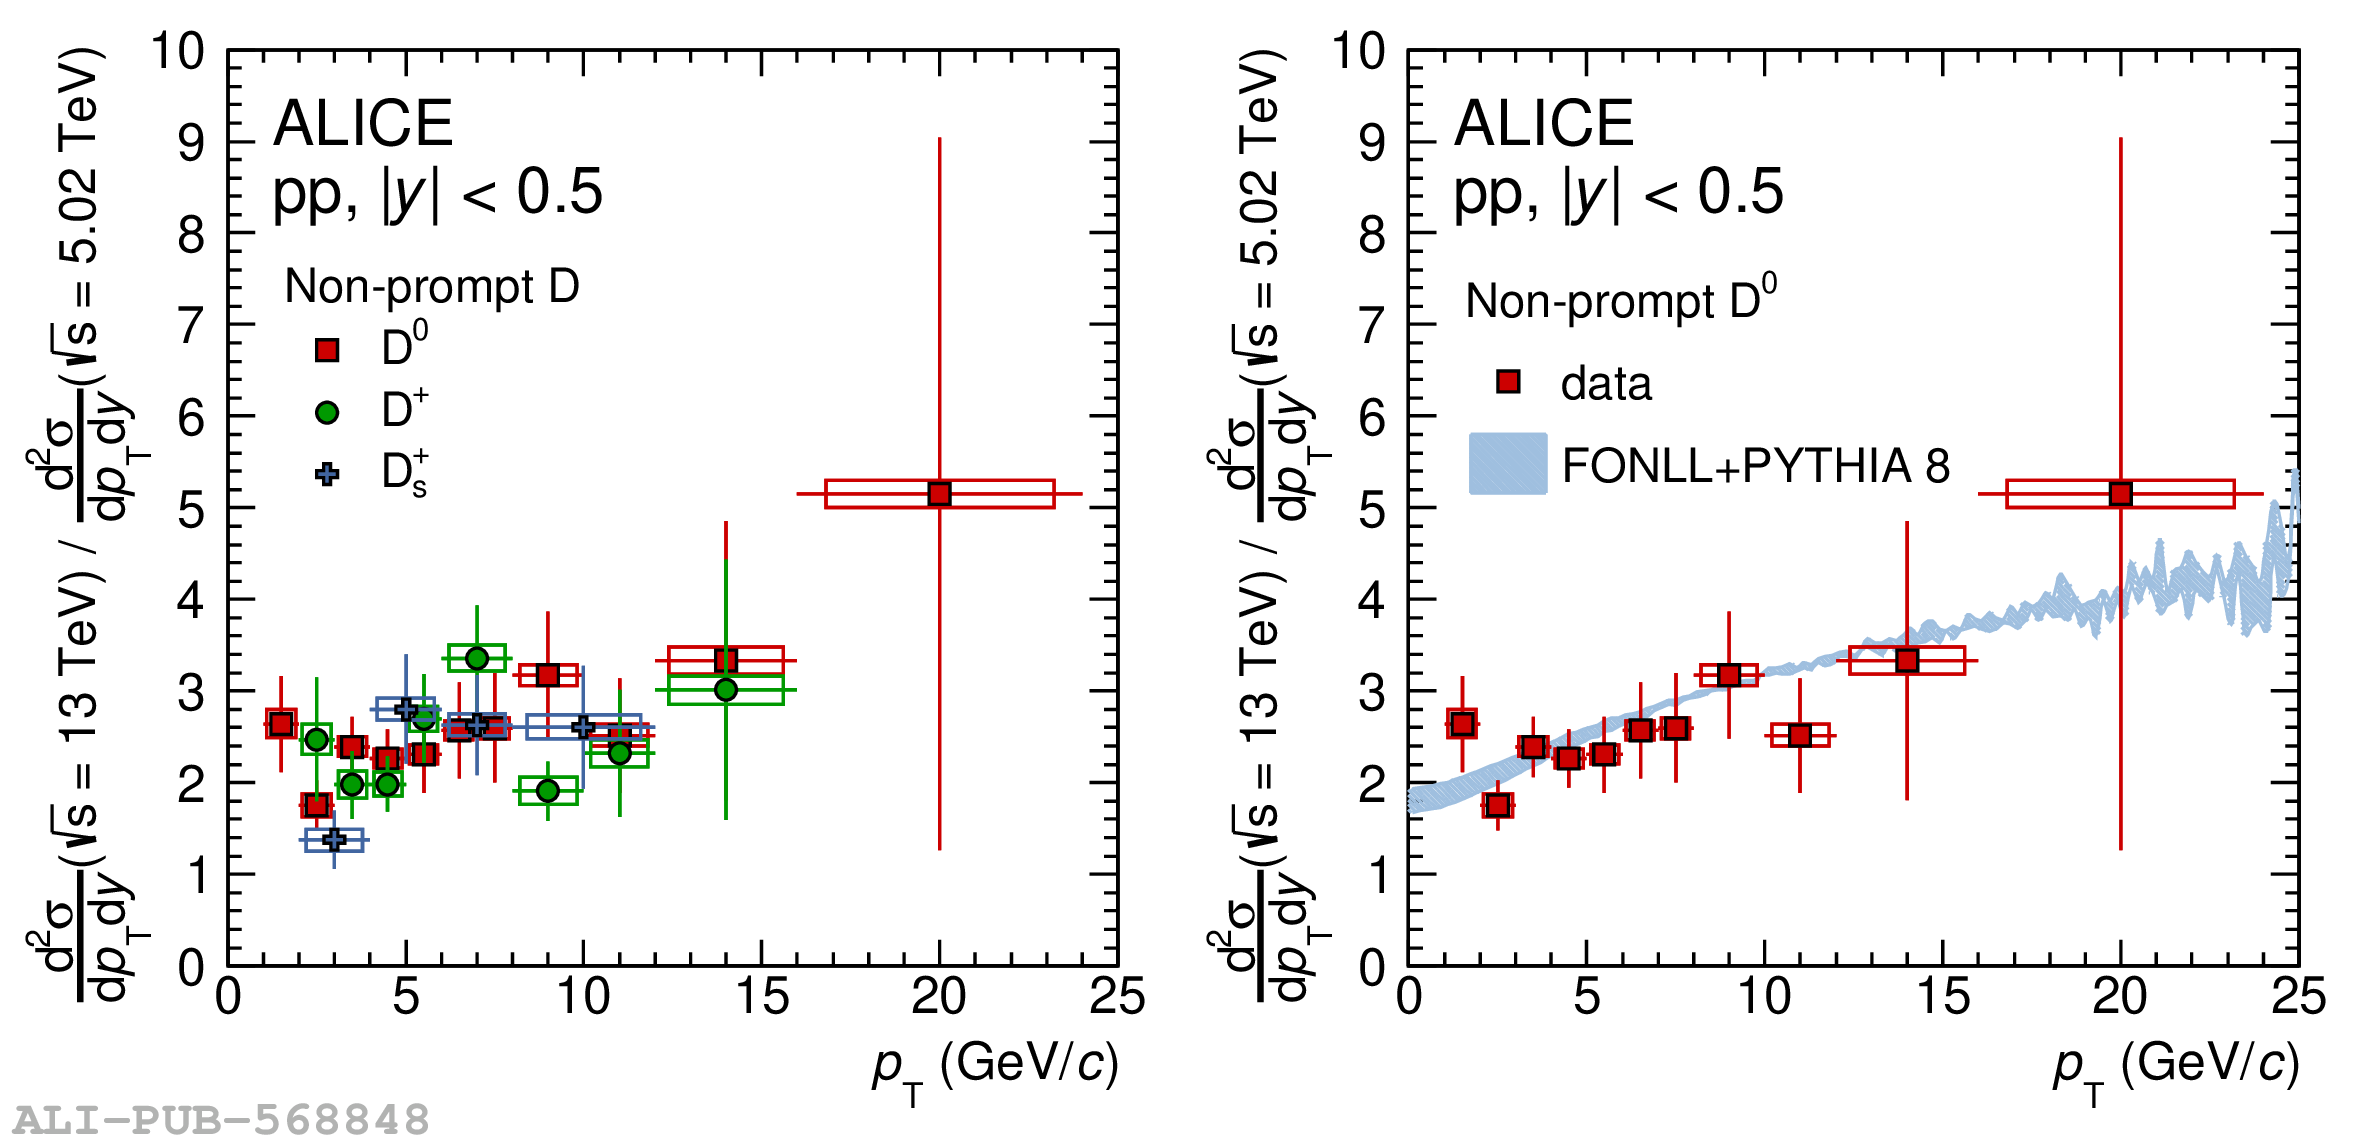 |
Figure 8
Left: beauty-quark production cross section per unit of rapidity at midrapidity as a function of the centre-of-mass energy measured in pp and ${\rm p\overline{p}}$ collisions by the ALICE and PHENIX Collaborations, and the CDF and UA1 Collaborations. The solid and dashed lines, accompanied by shaded bands, represent the central values and the associated uncertainties predicted by FONLL and NNLO calculations, respectively. Right: beauty-quark production cross section per unit of (pseudo)rapidity as a function of (pseudo)rapidity measured by the ALICE Collaboration (LHCb Collaboration ). The solid and dashed lines, accompanied by a shaded band, represent the central values and the associated uncertainties predicted by FONLL as a function of $y$ and $\eta$, respectively The vertical bars and boxes report the statistical and systematic uncertainties, respectively. | 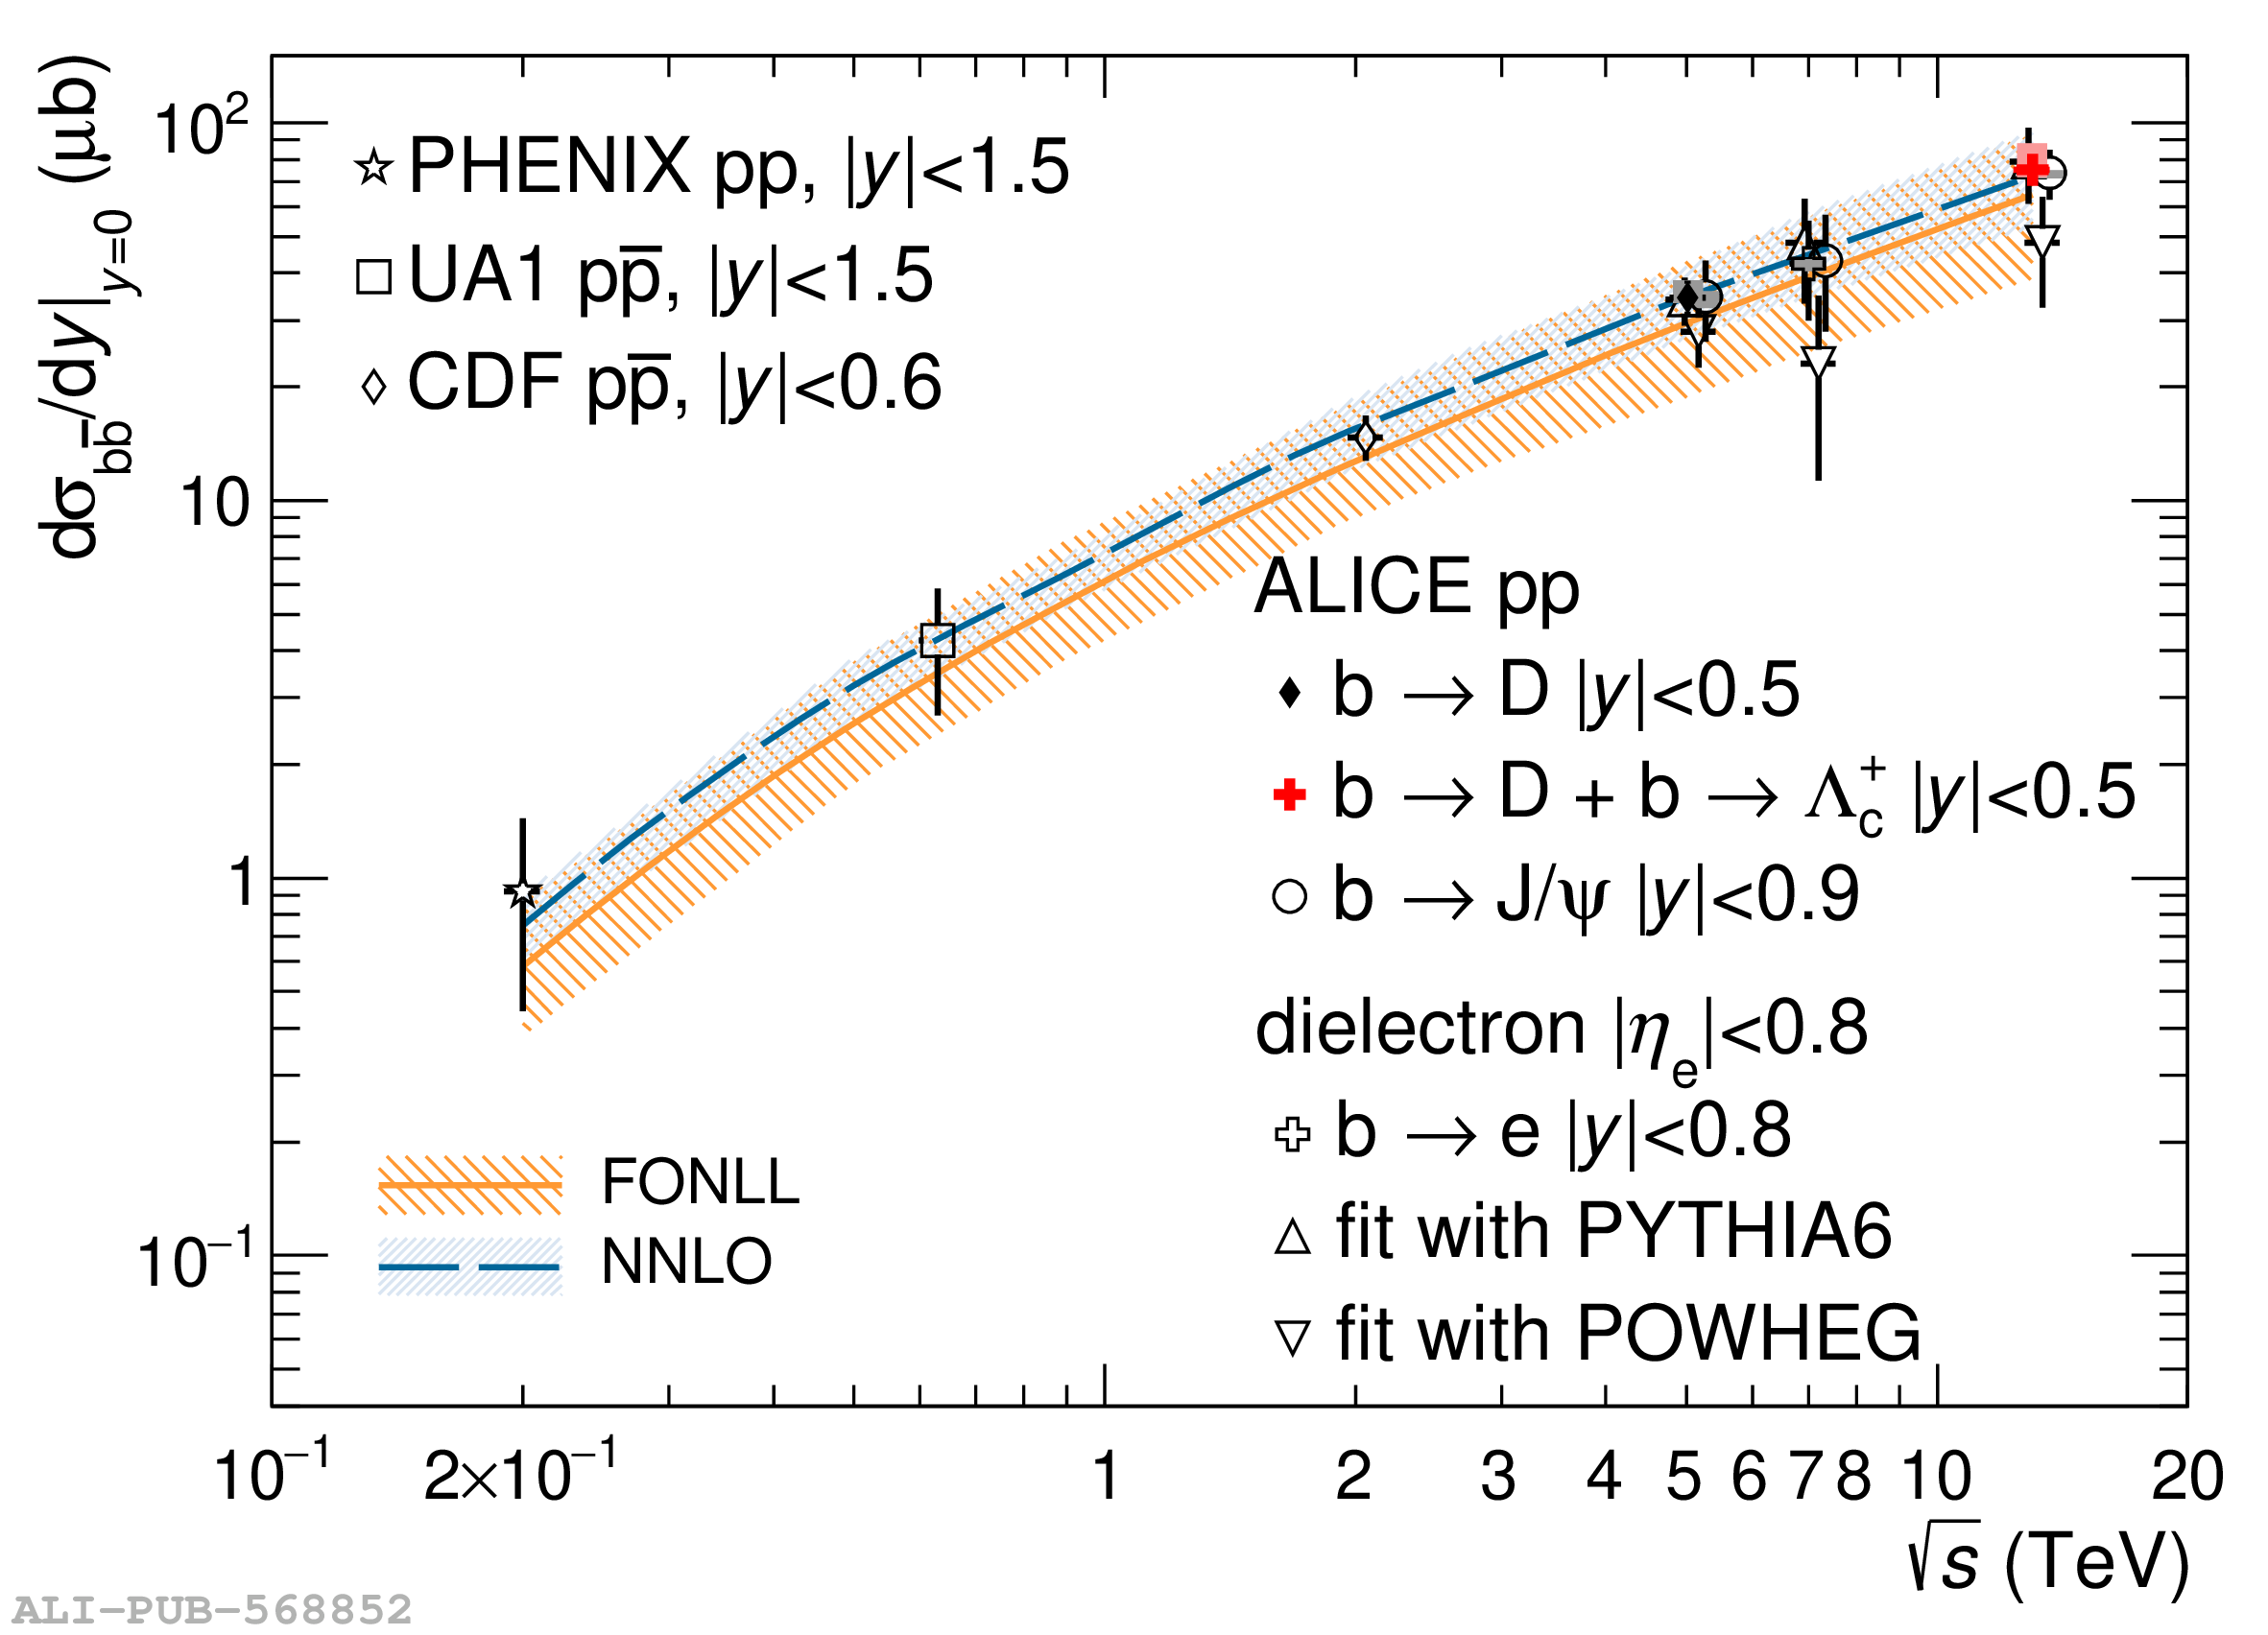 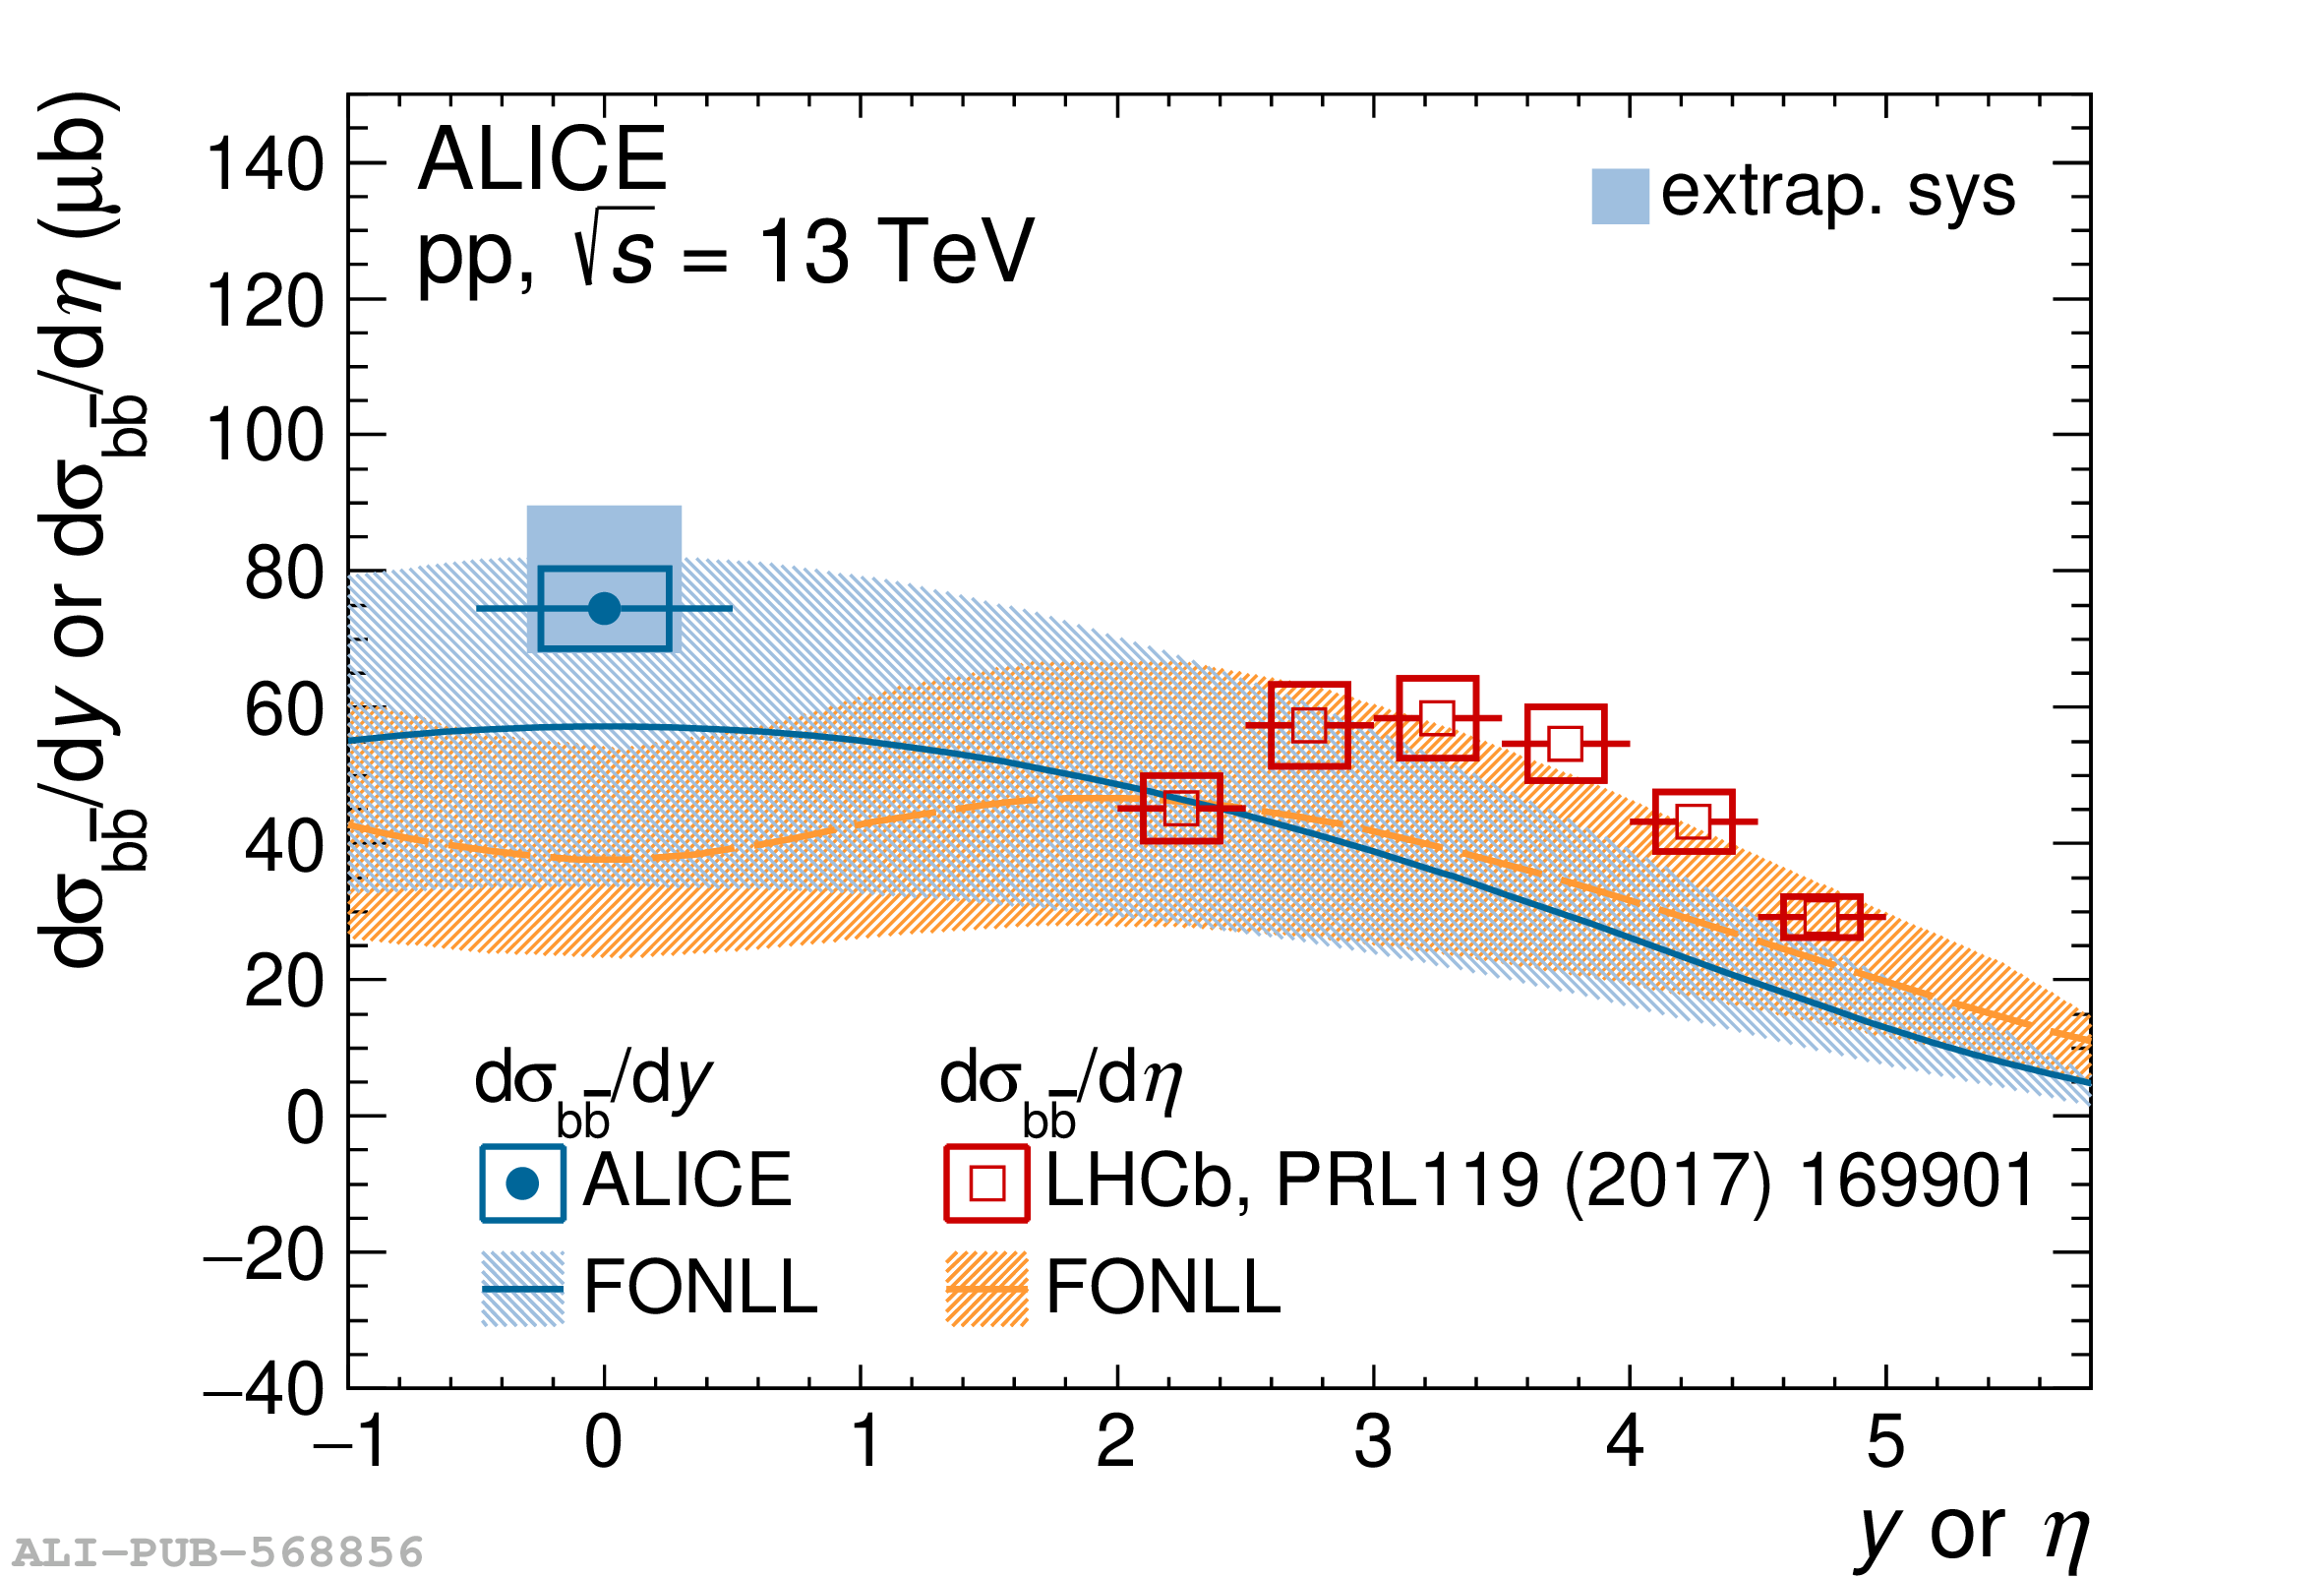 |