$p_{\mathrm{T}}$- and $ct$-differential ratios of the species used for the chemical potential measurement in the various centrality intervals. Error bars show statistical uncertainties, while boxes represent centrality-uncorrelated uncertainties. The value of $R$ represents the averages weighted with the total uncorrelated uncertainties of the differential measurements. The correlated uncertainties are not shown in the plots. | 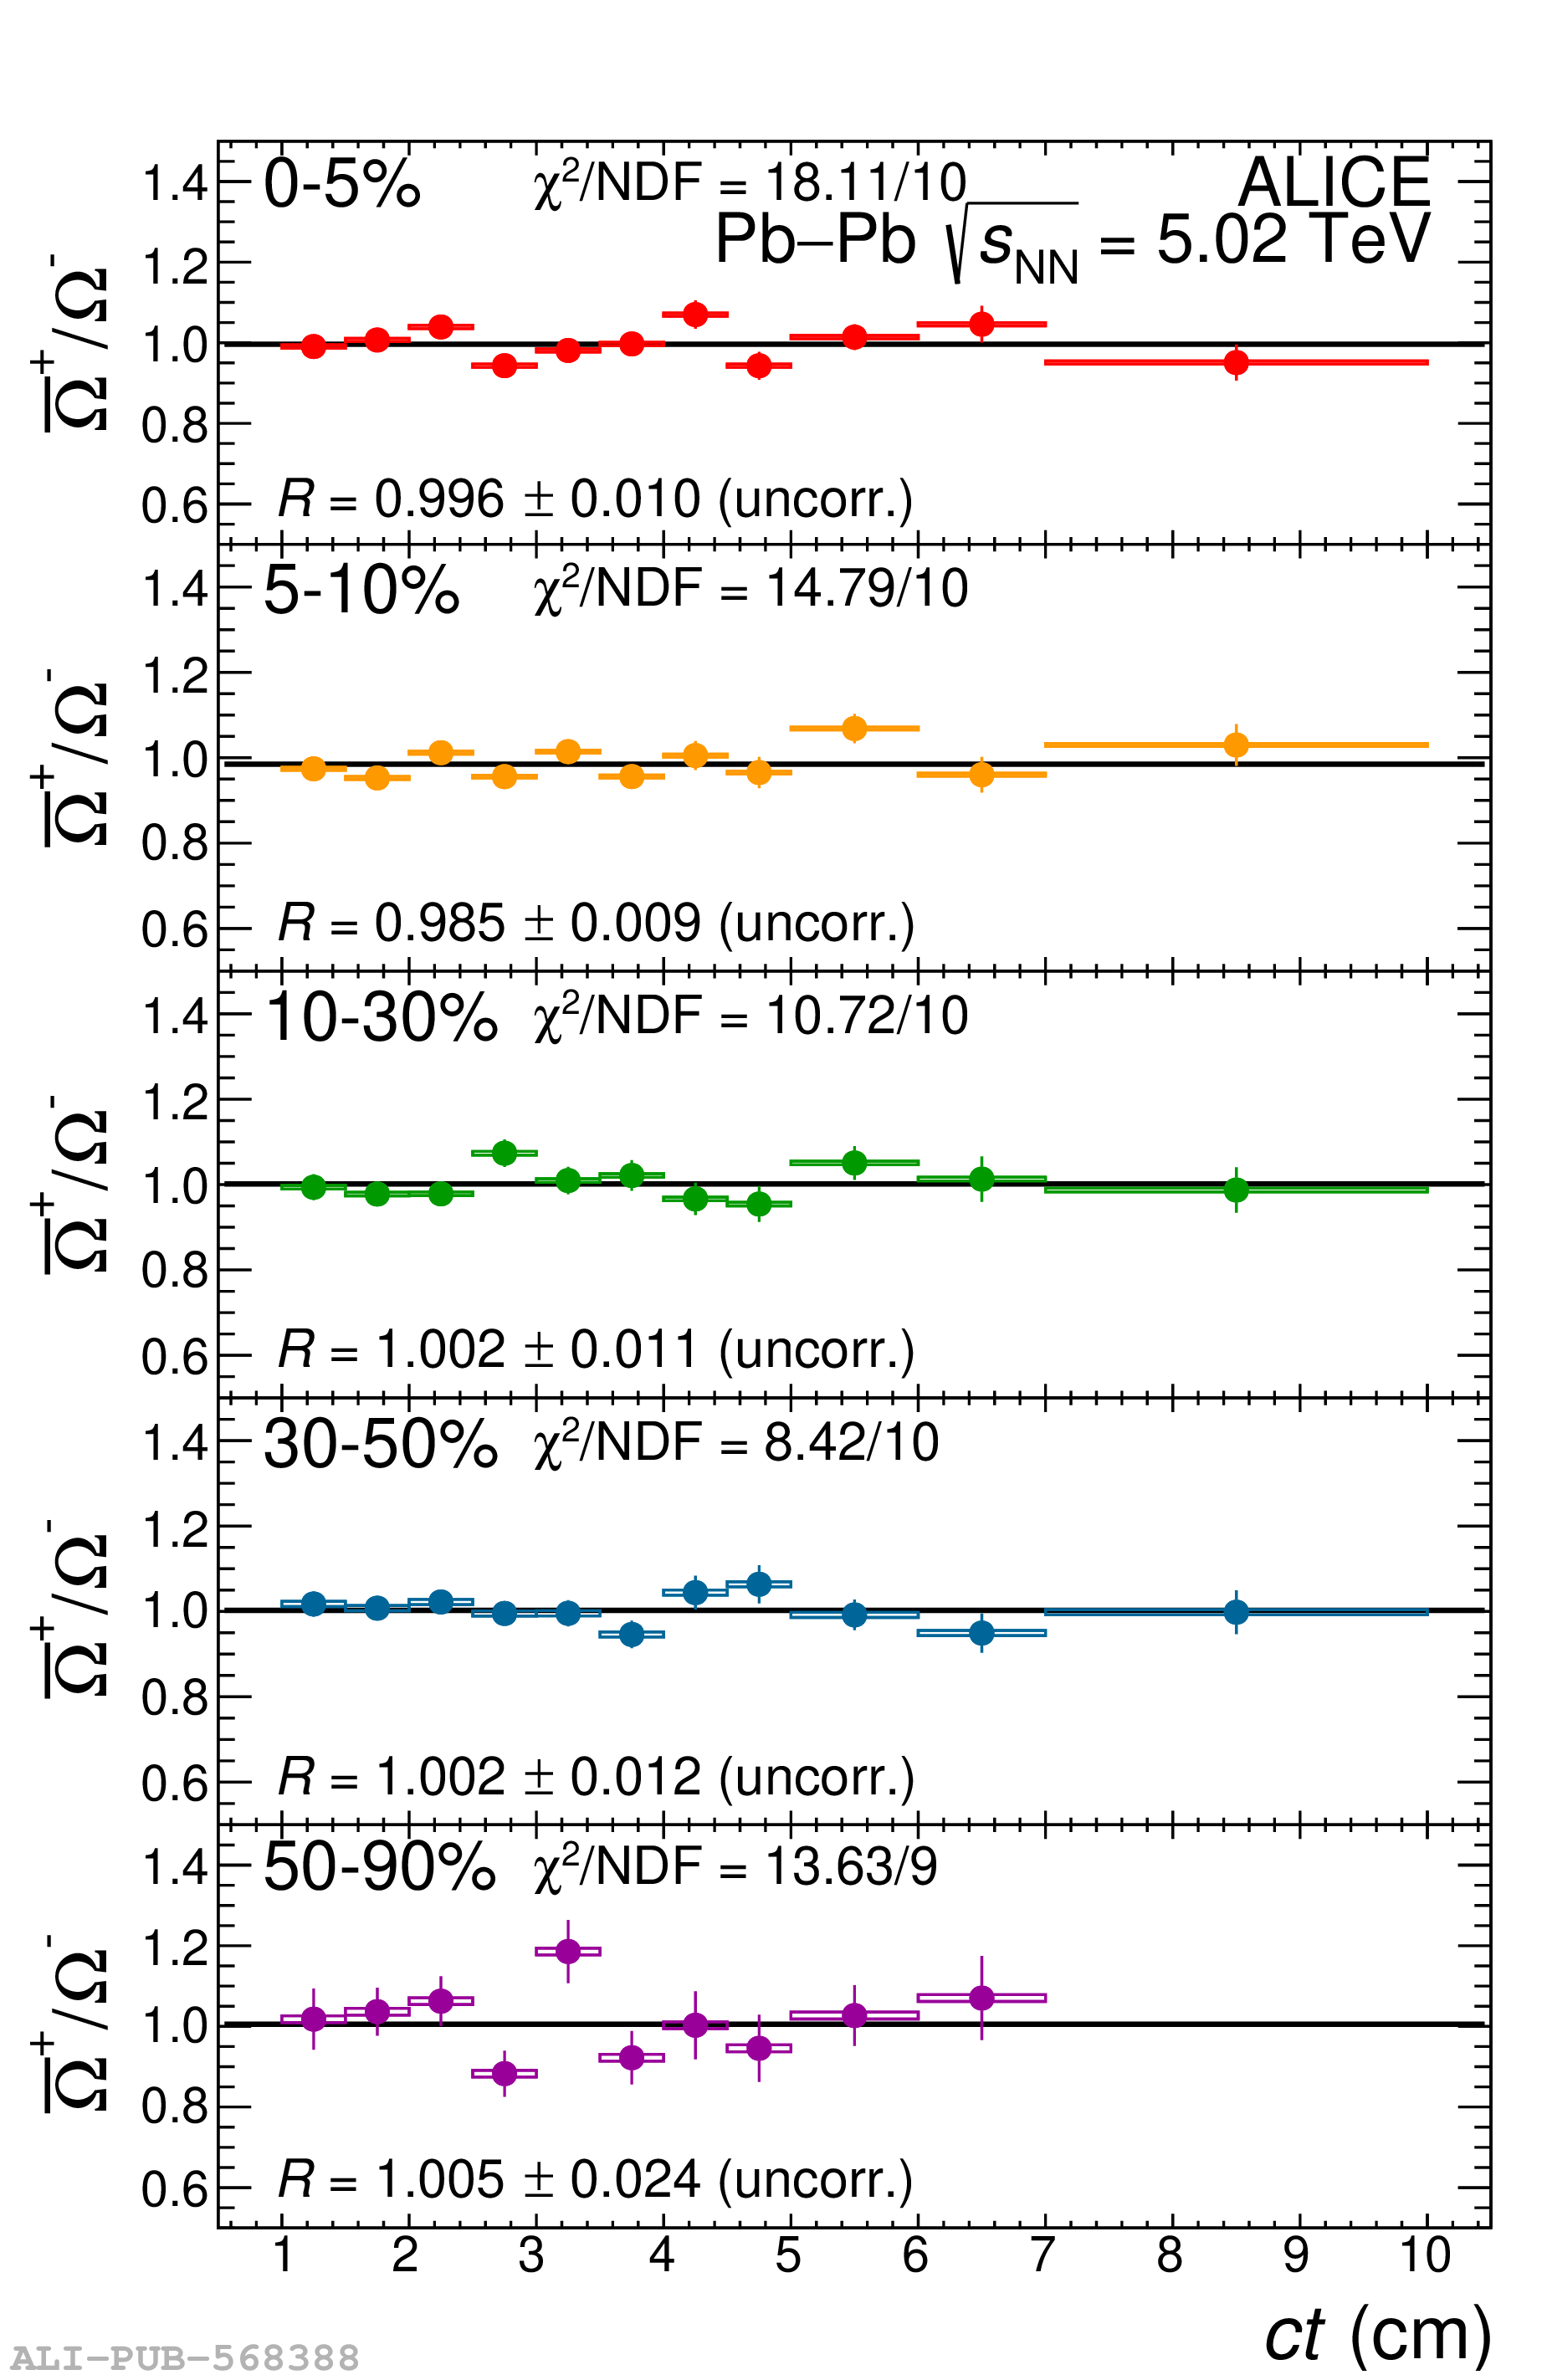 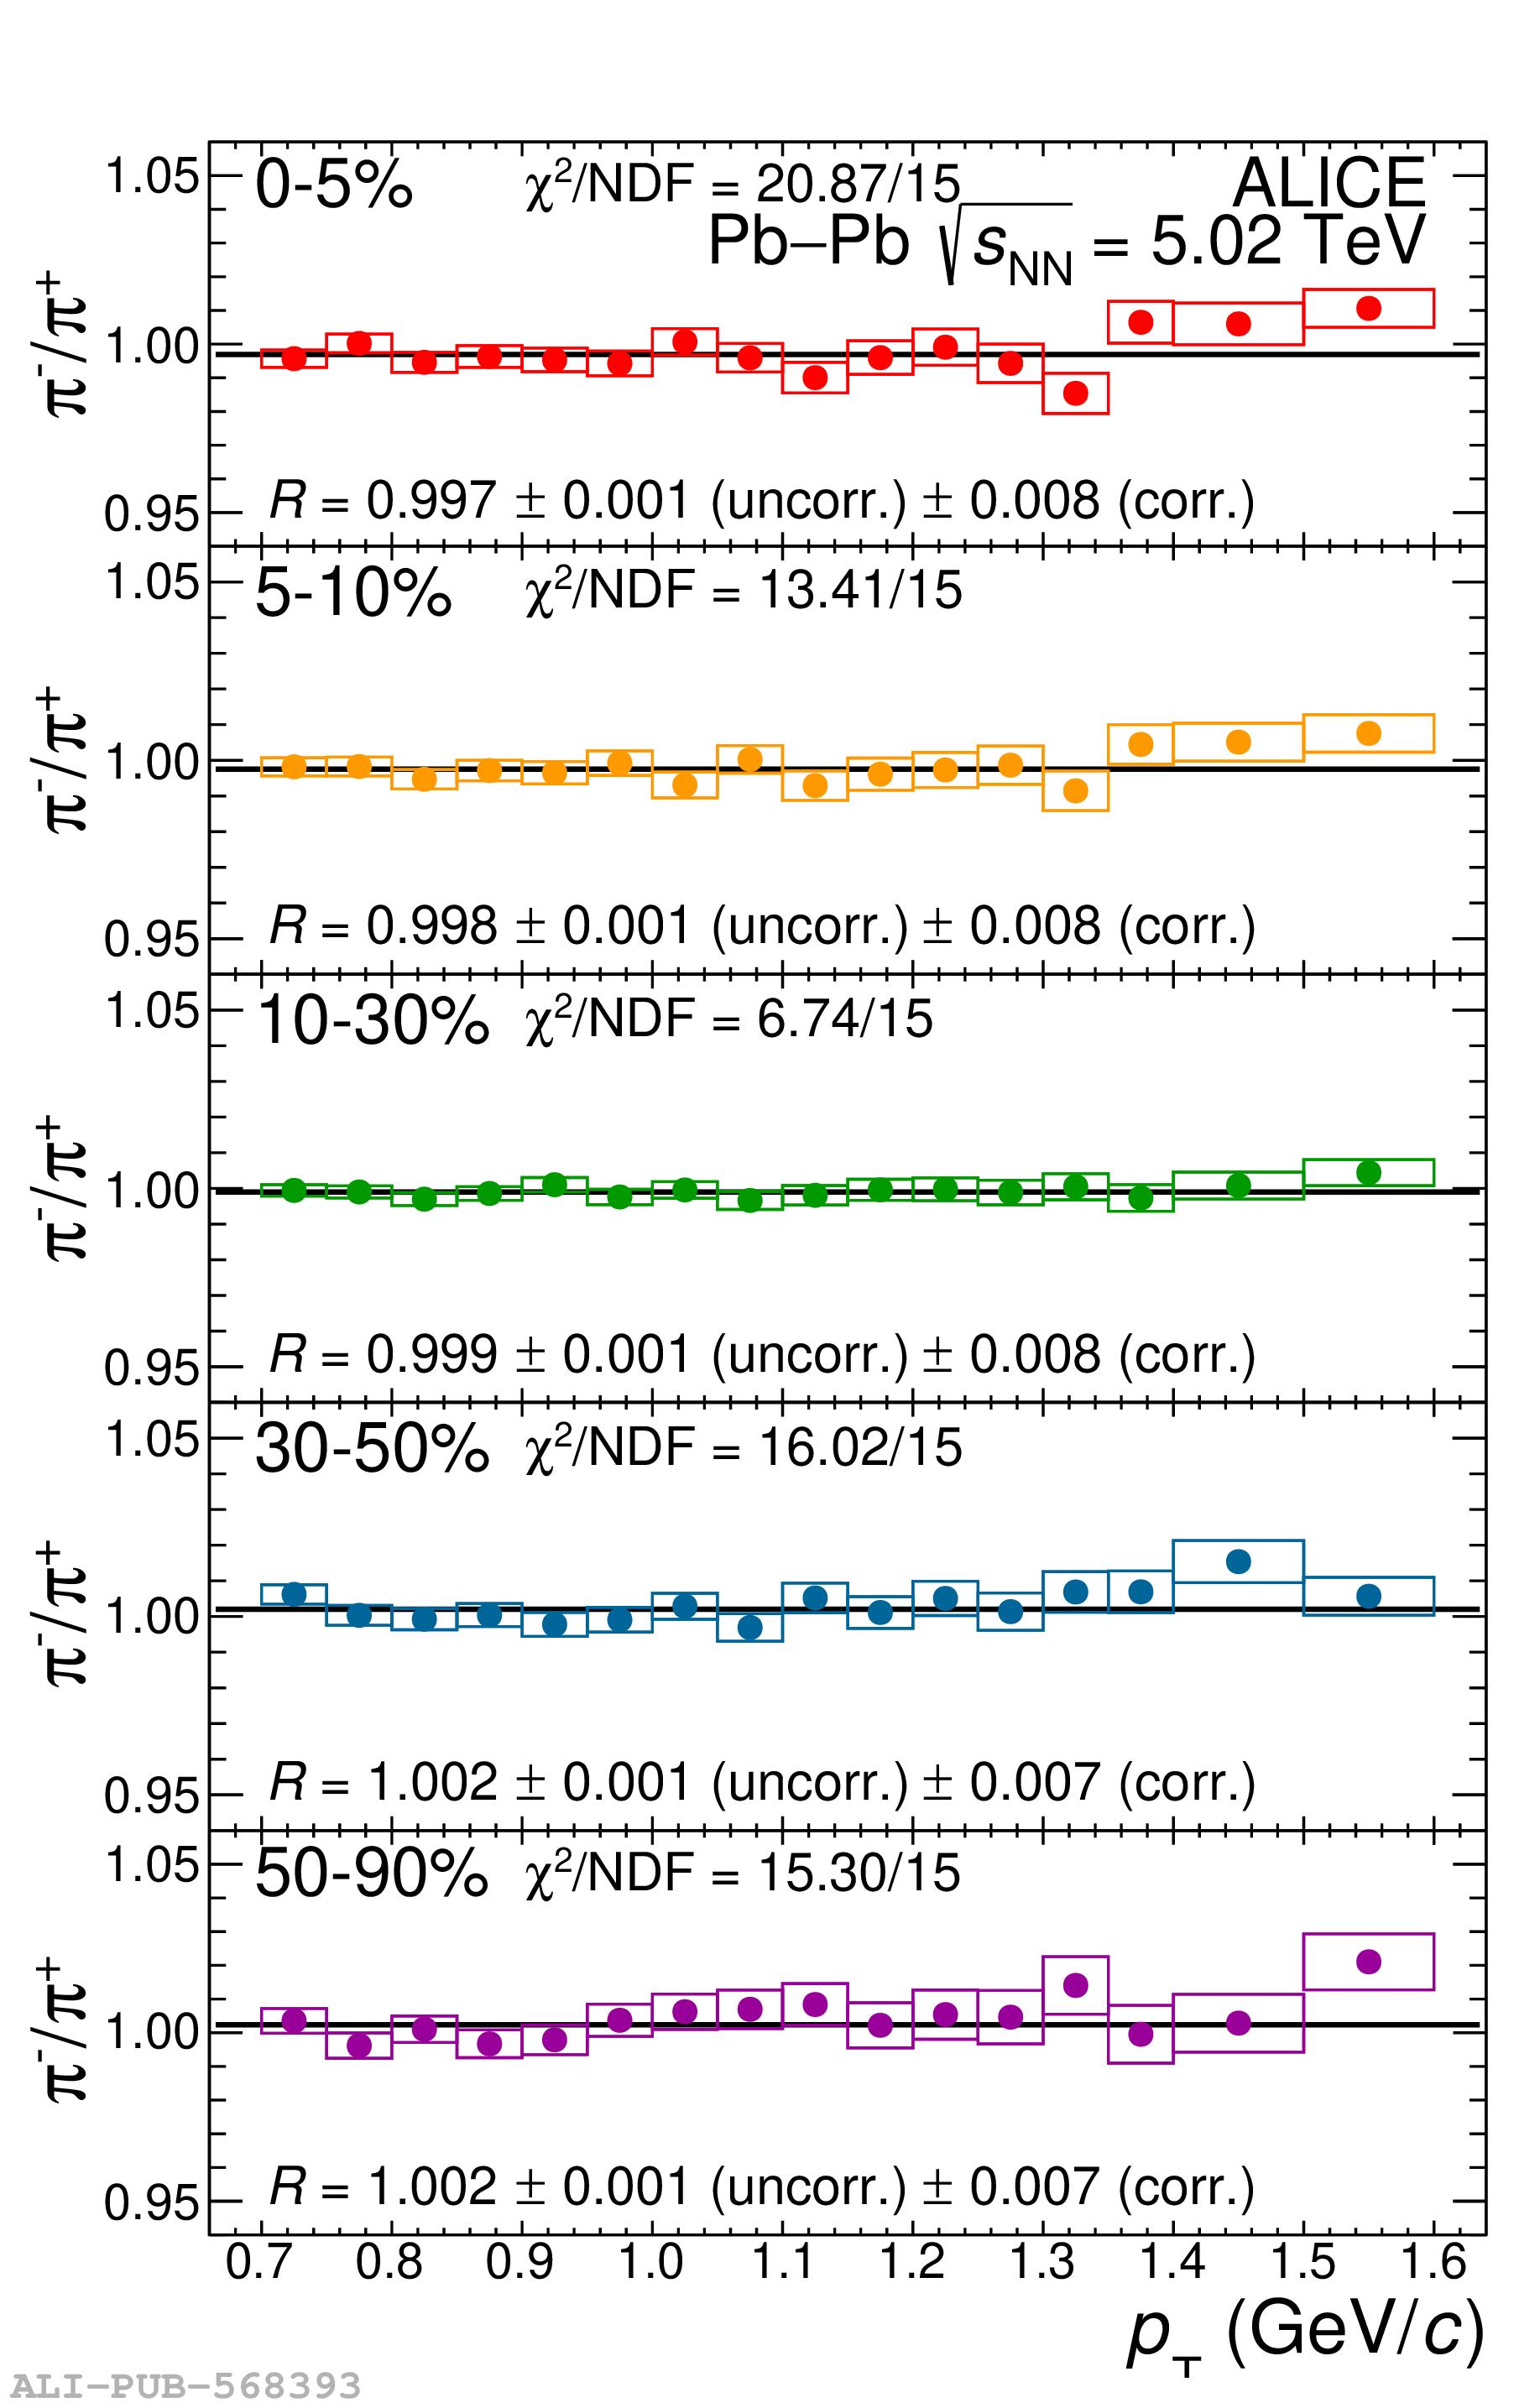 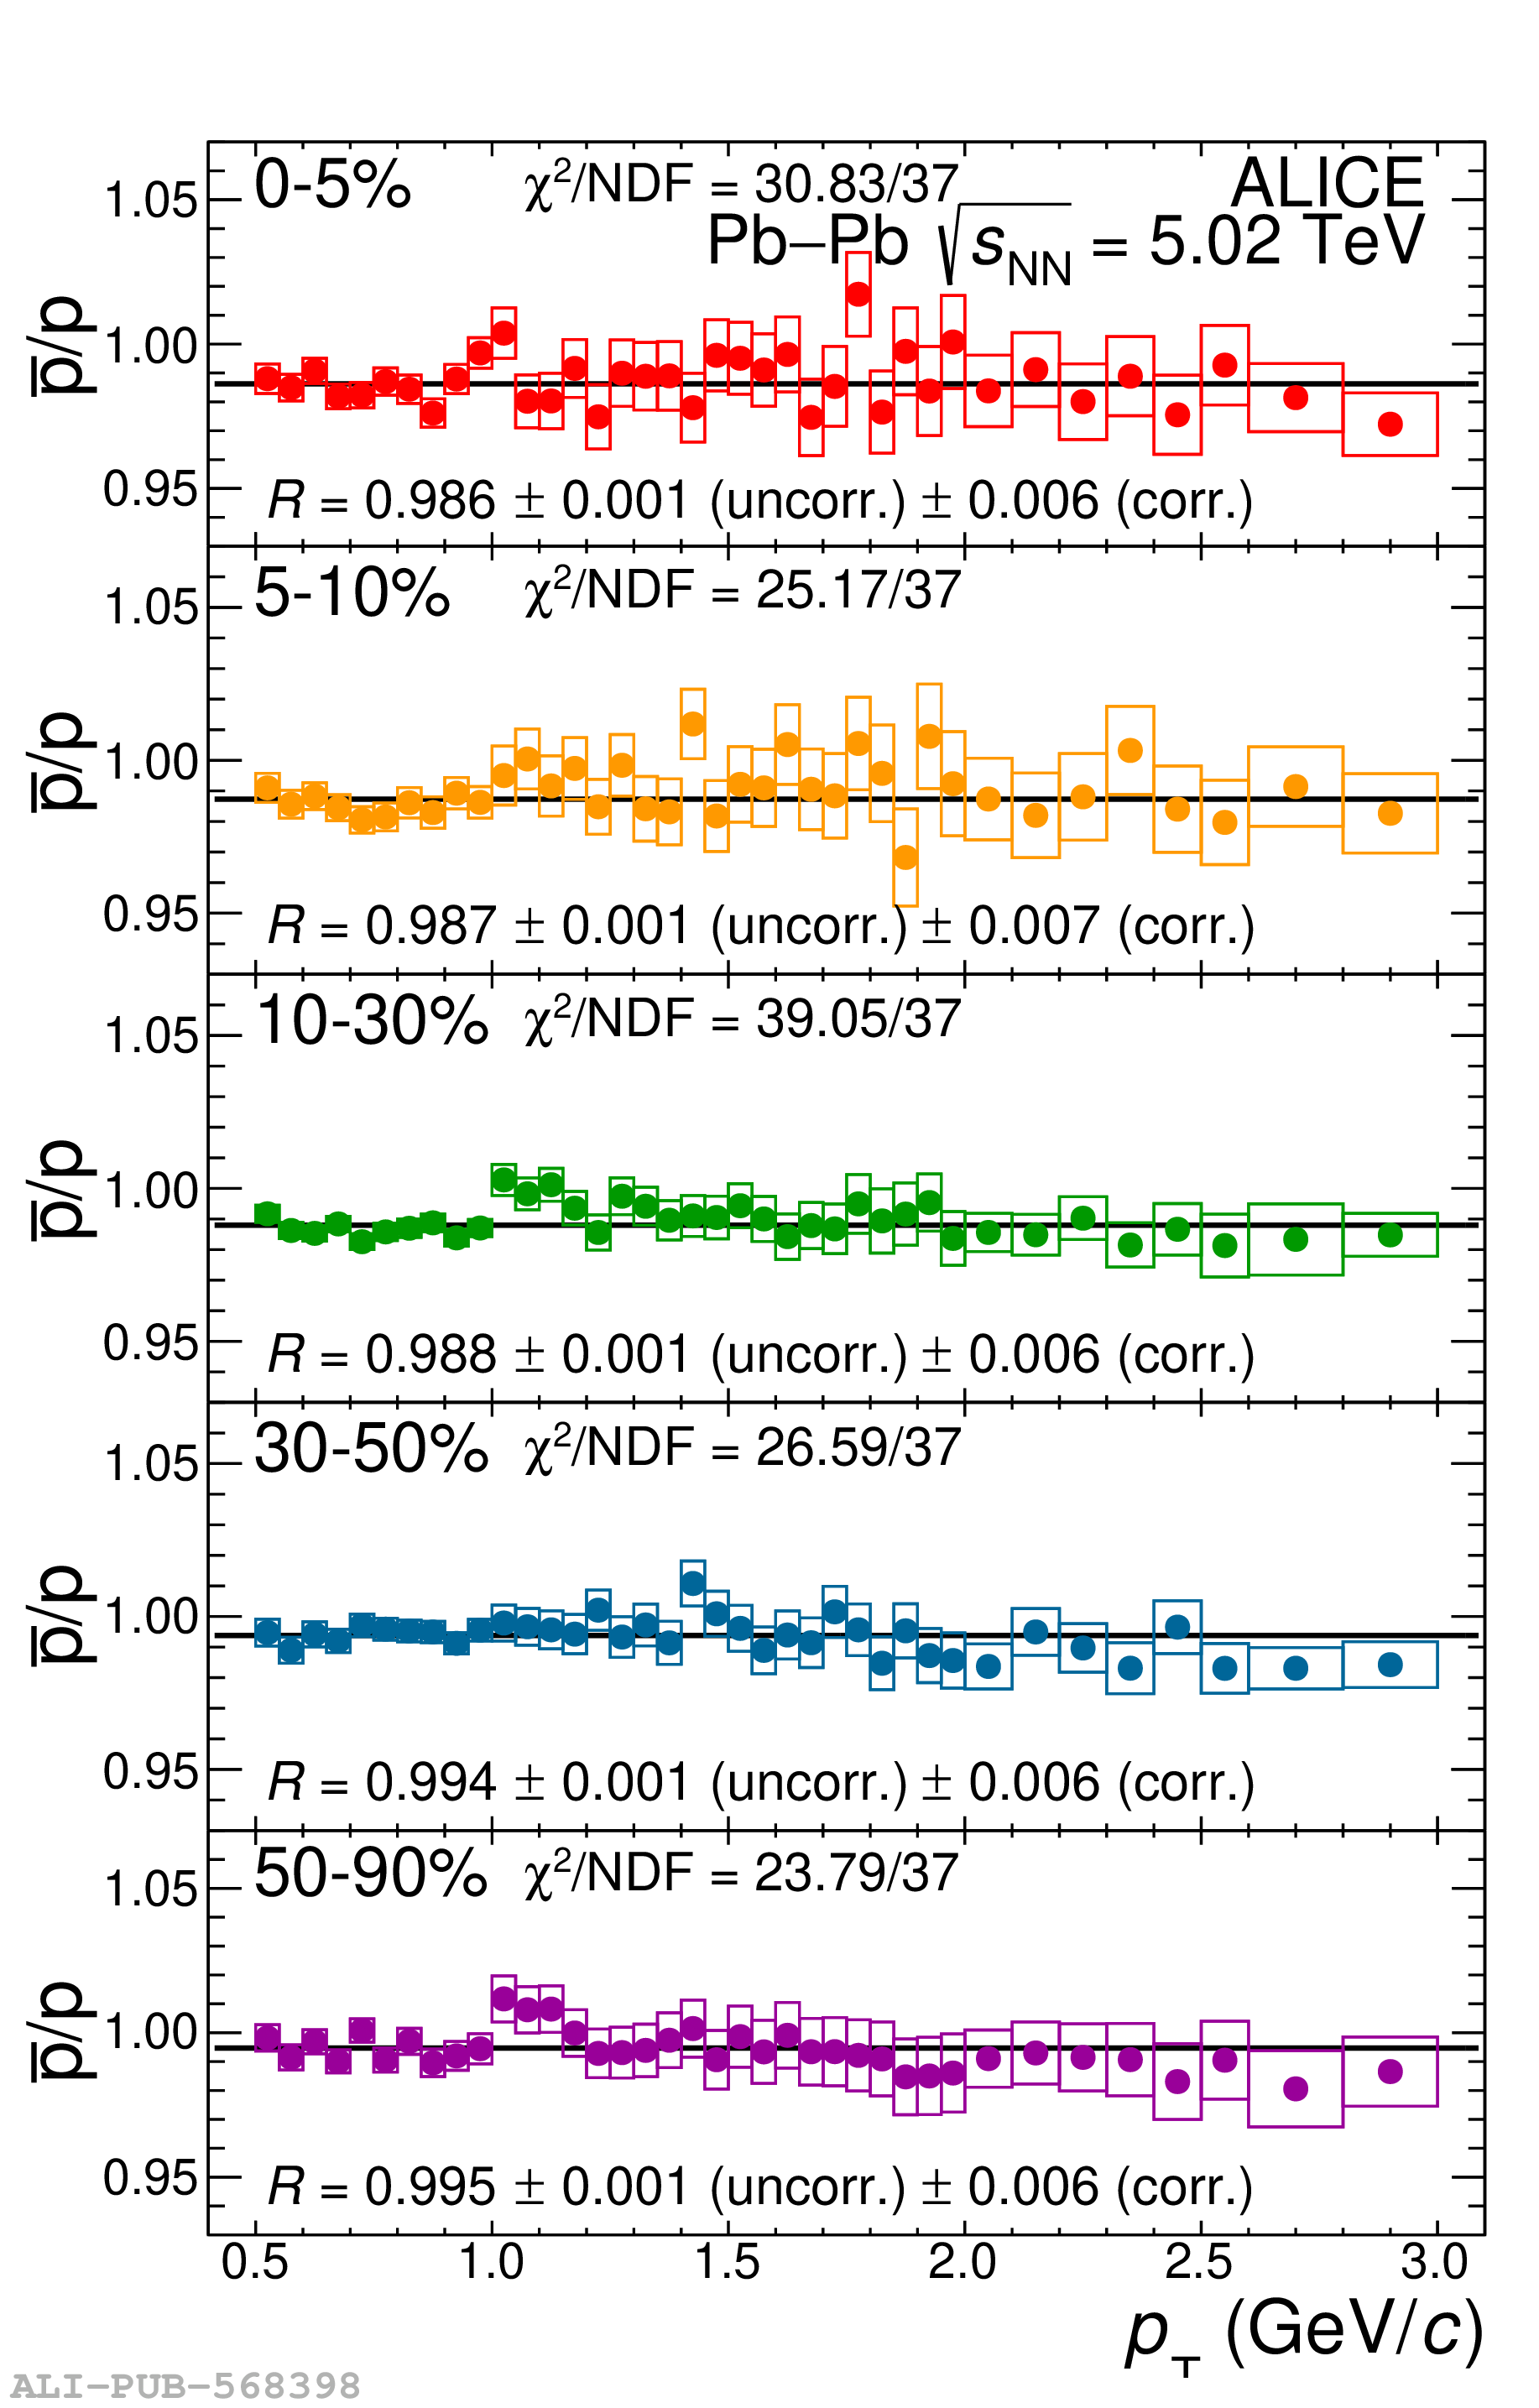 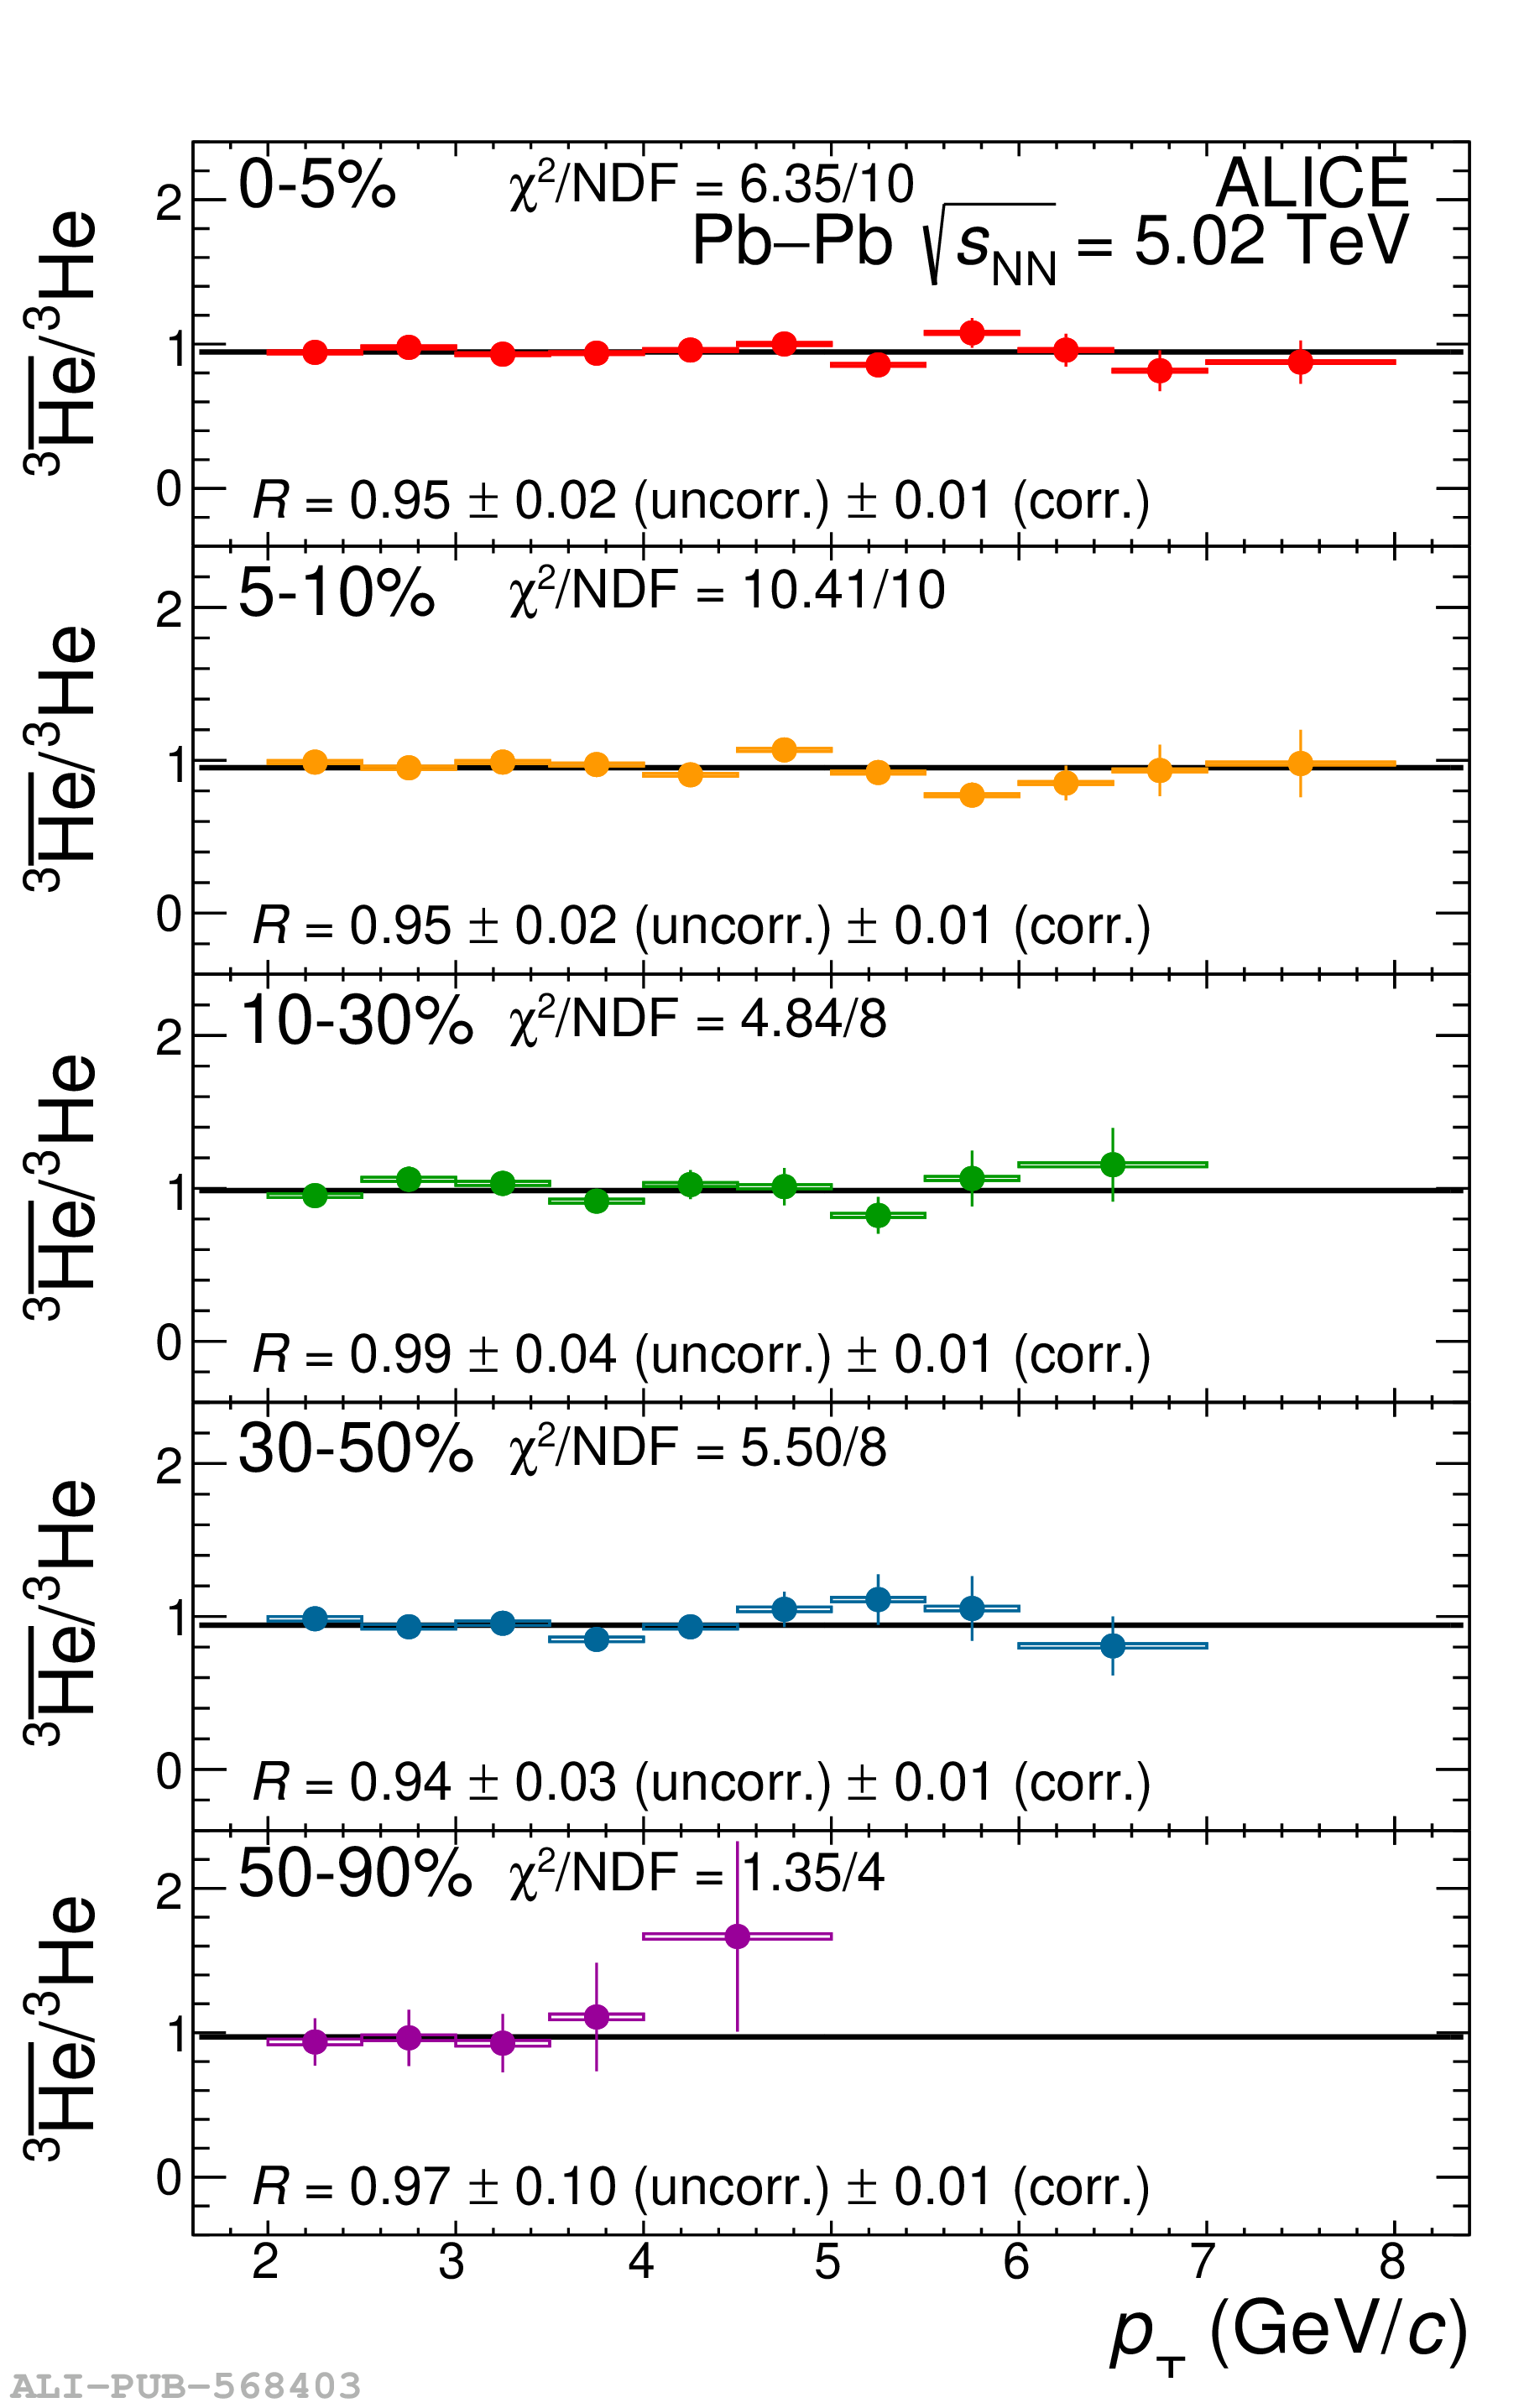 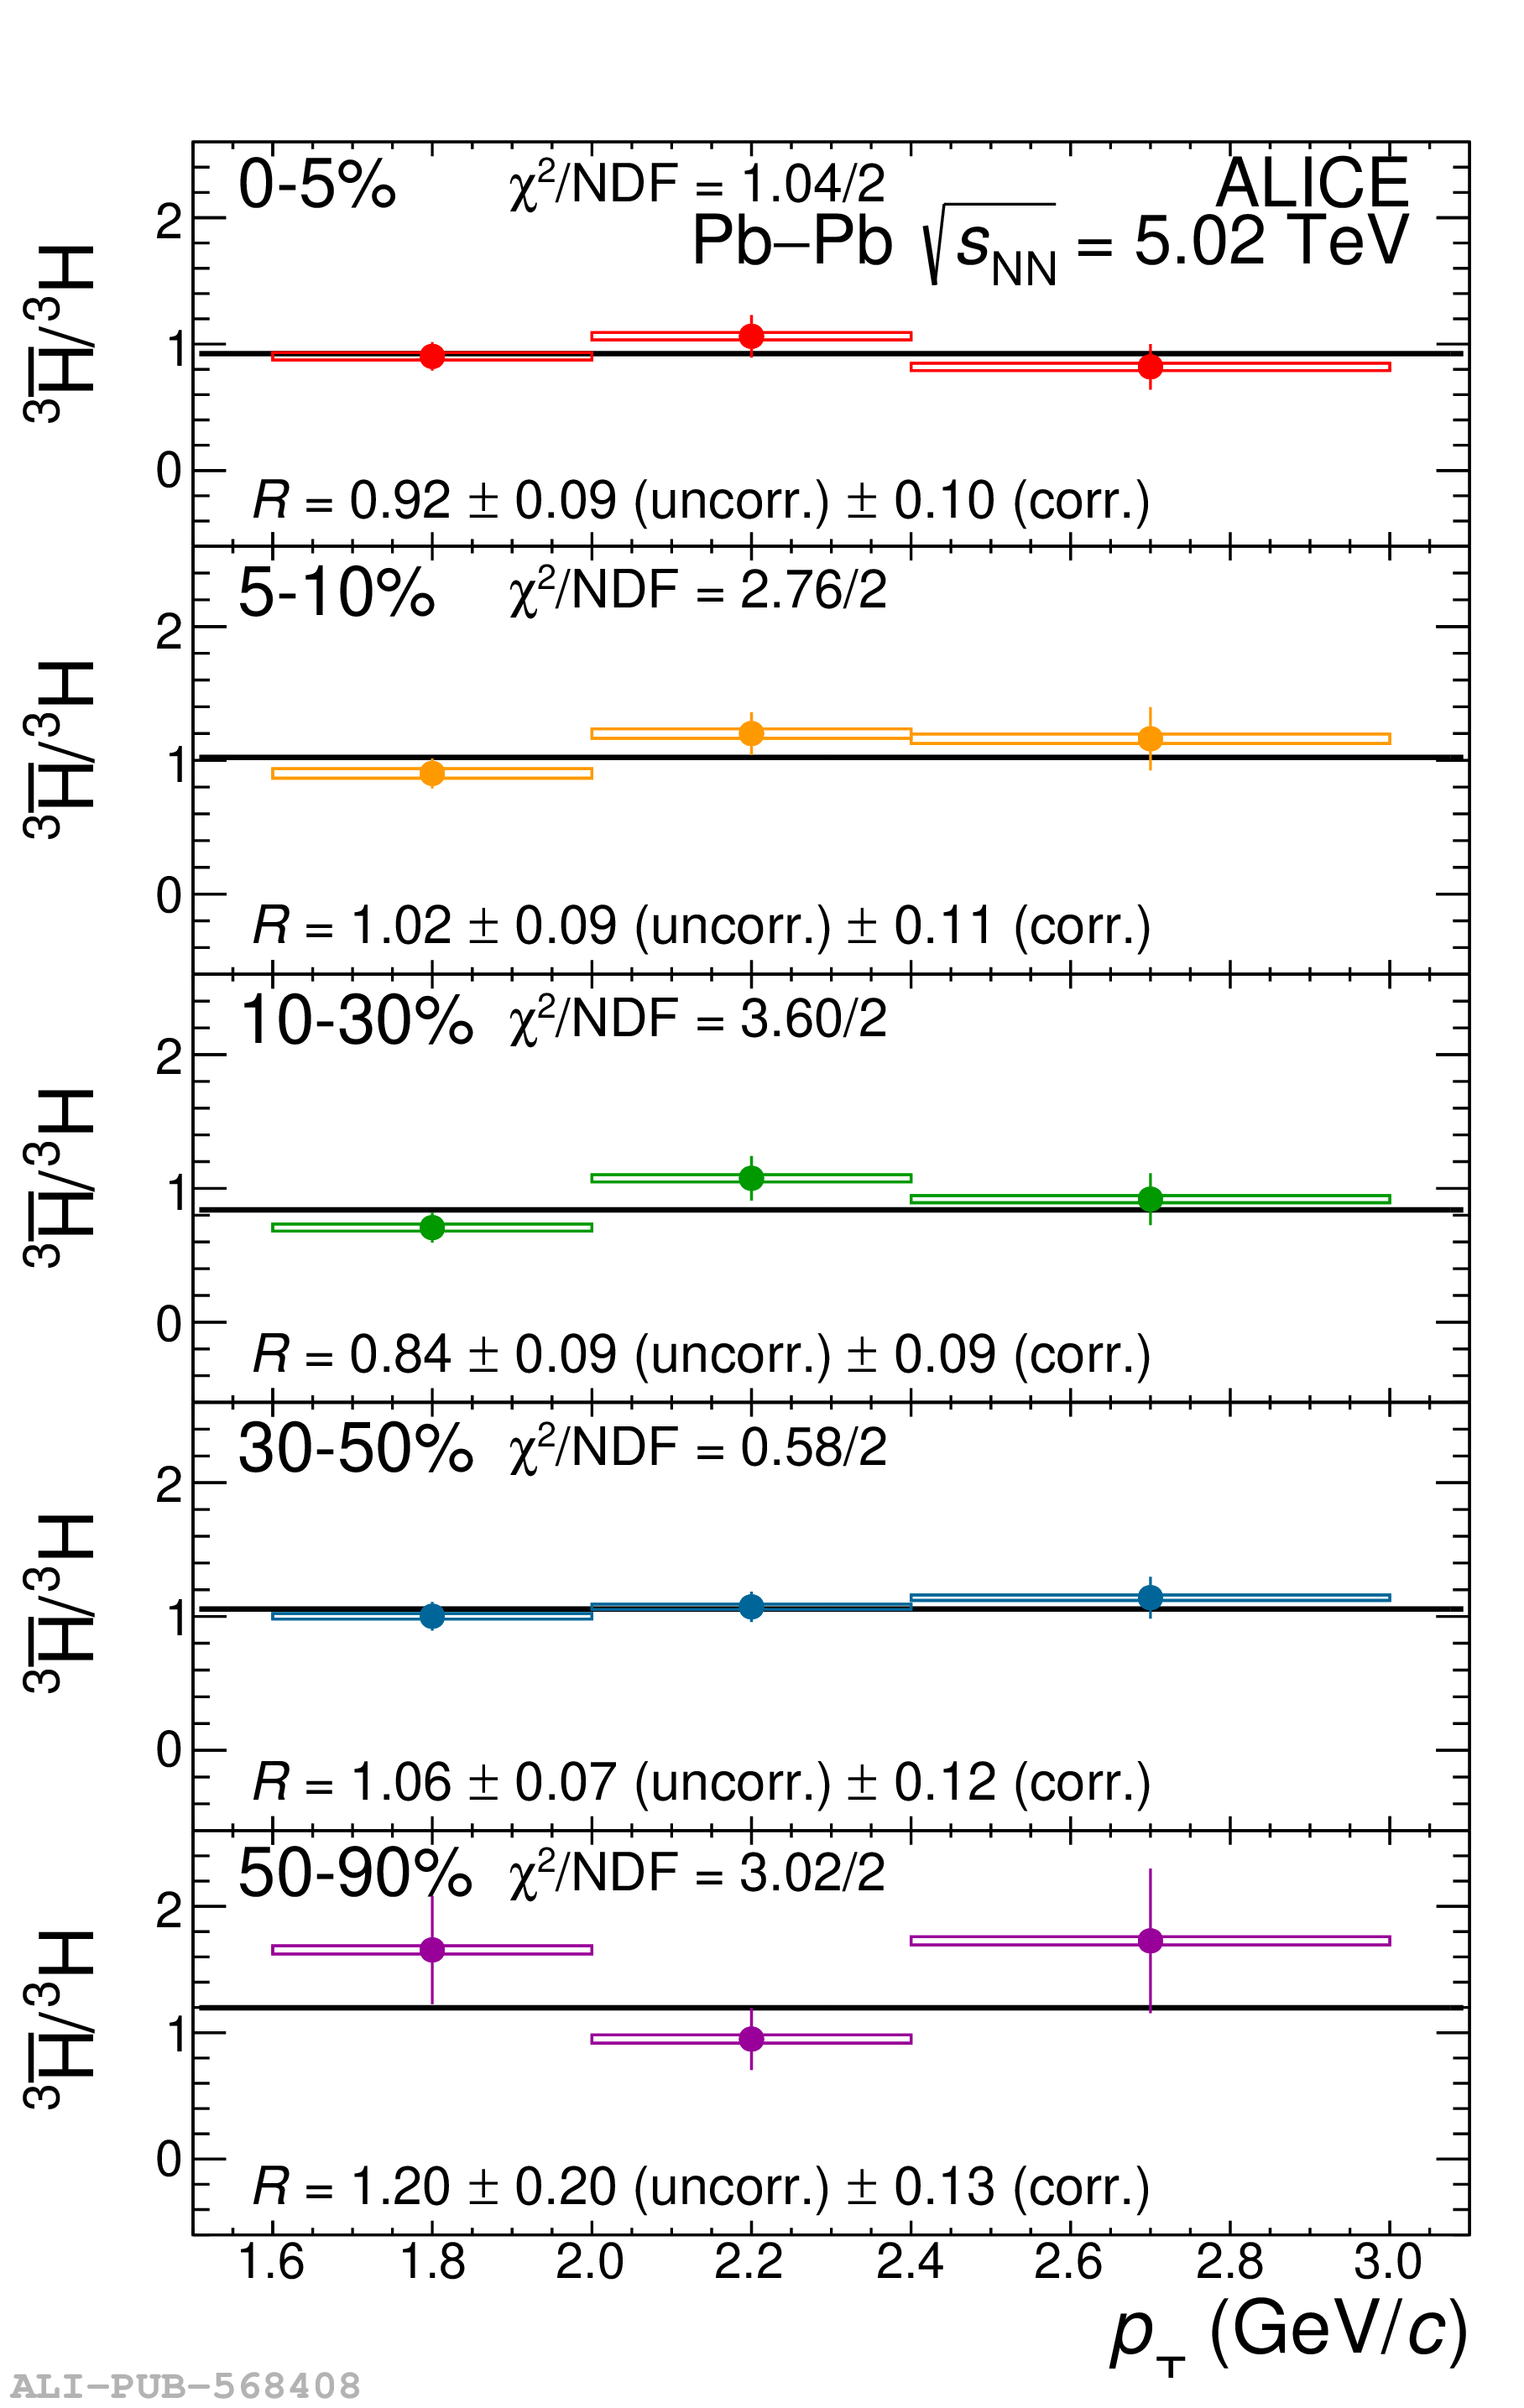 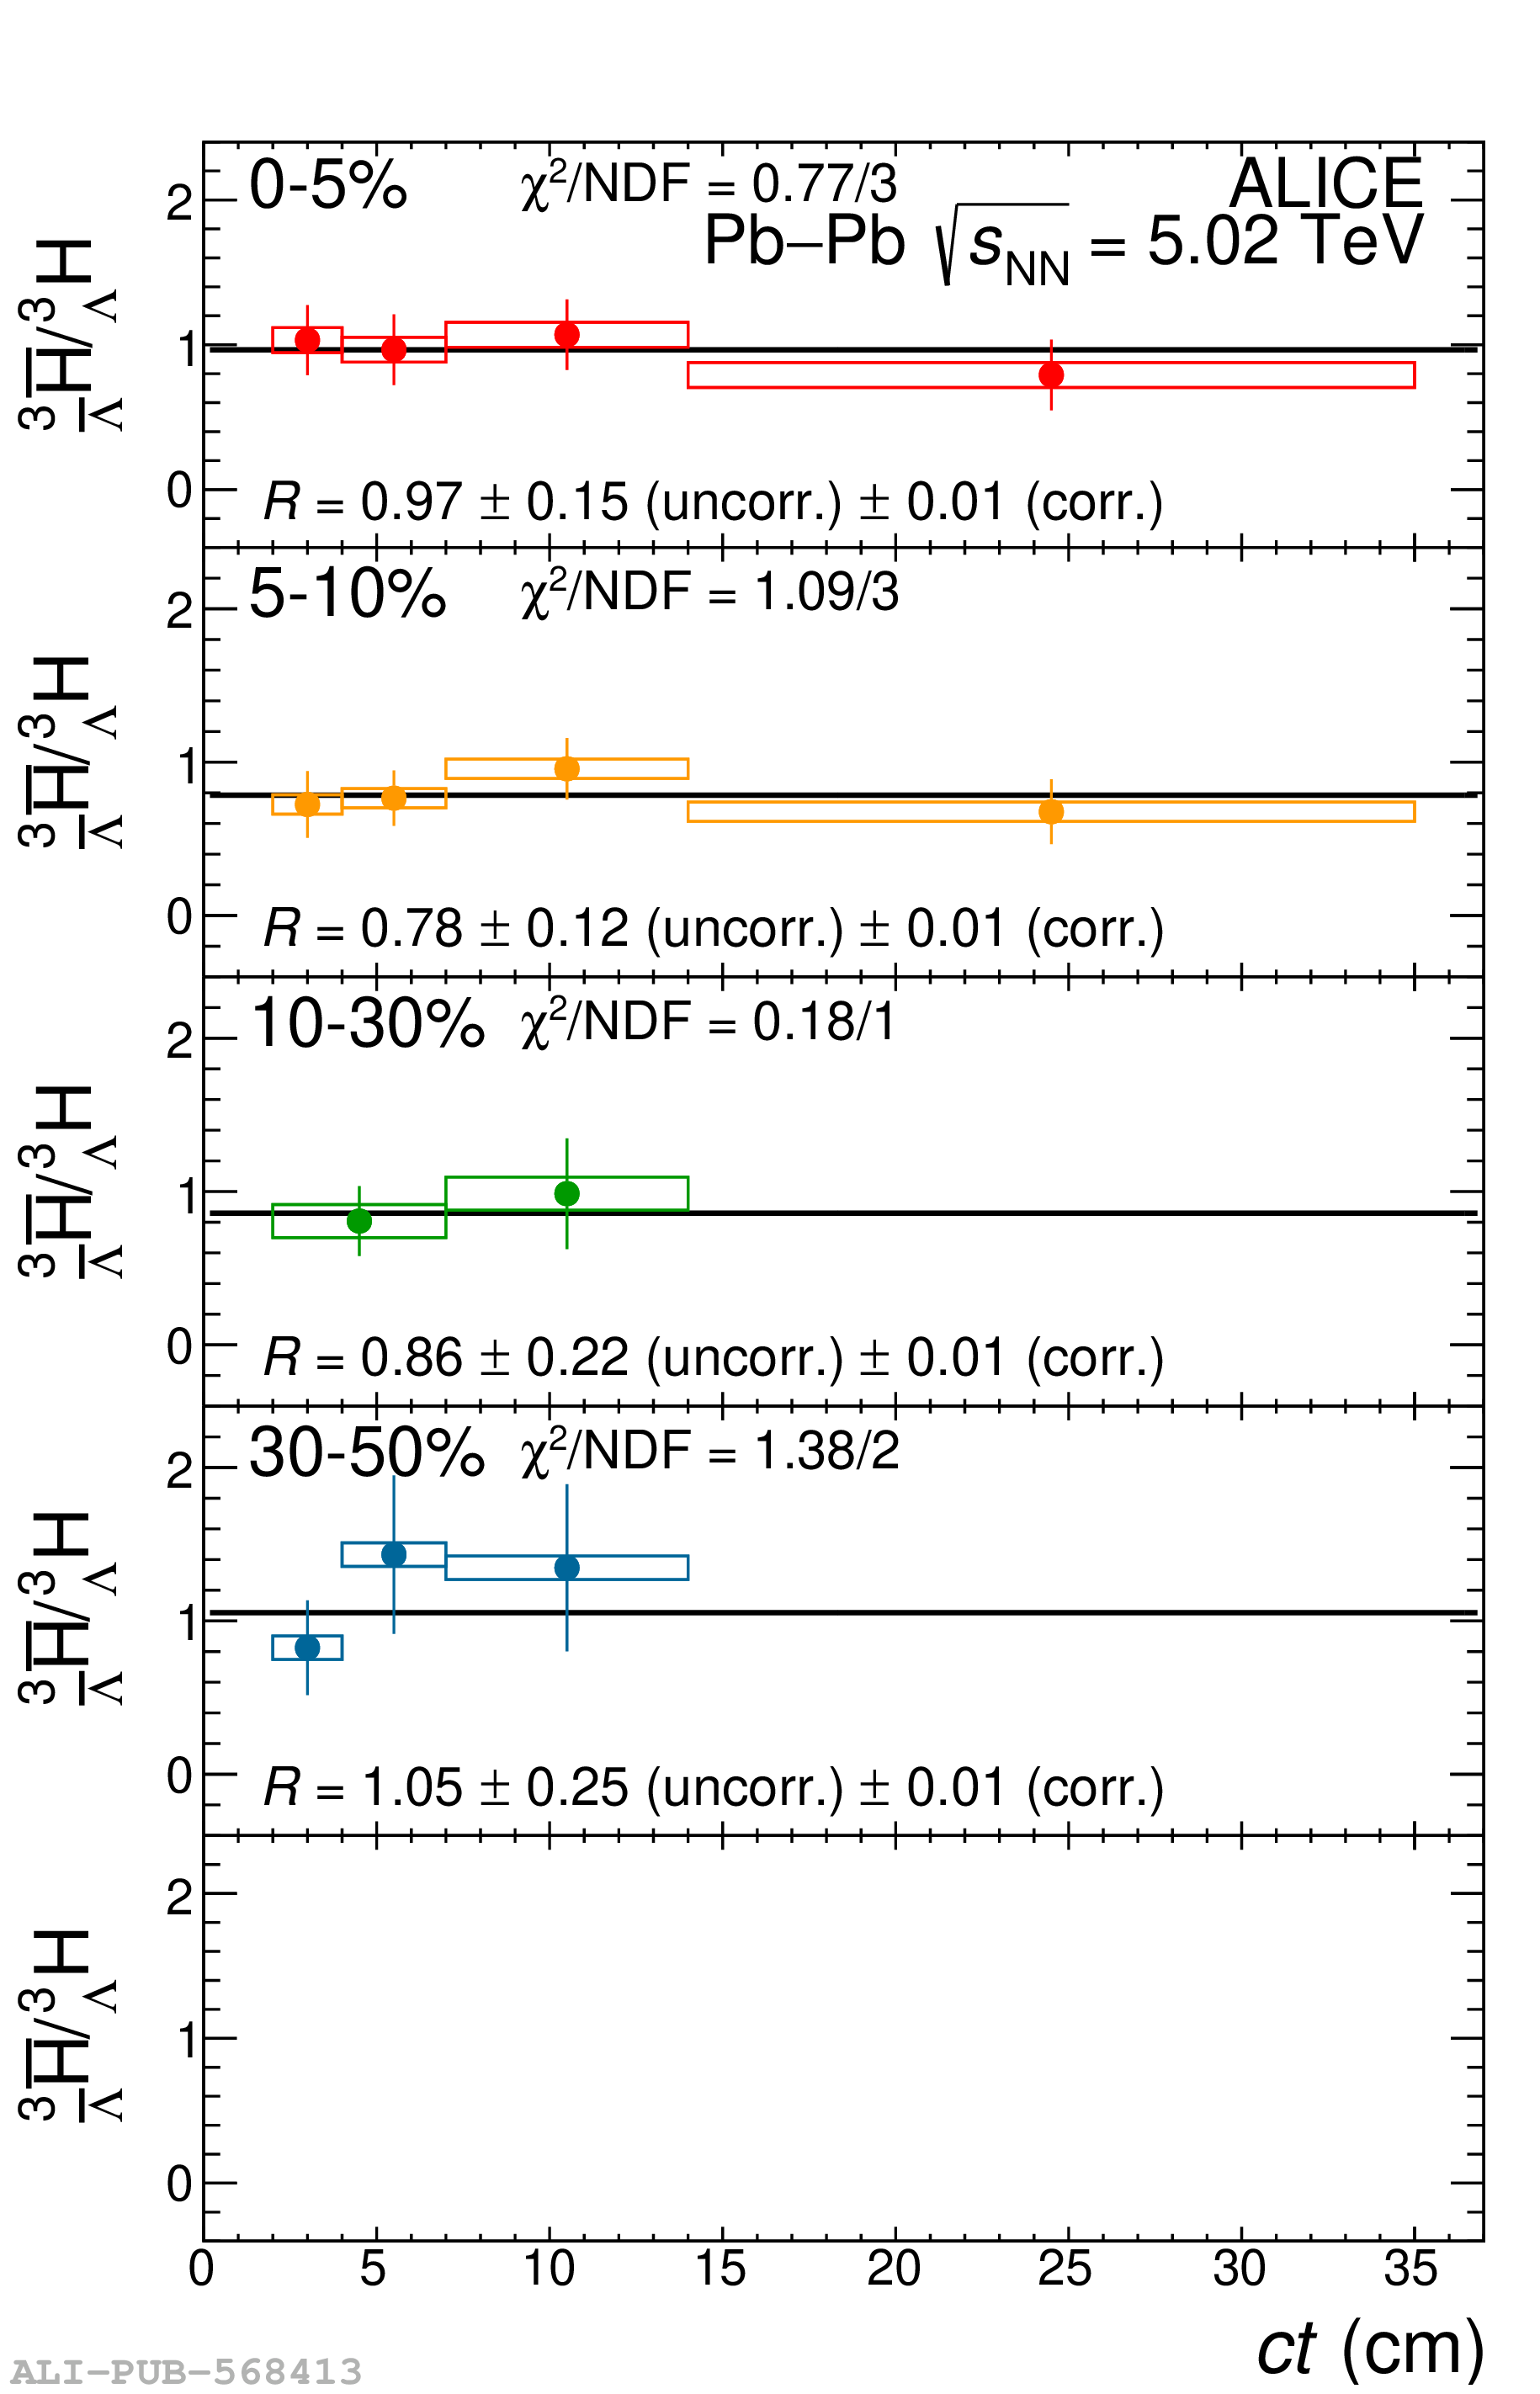 |