This Letter presents the most precise measurement to date of the matter-antimatter imbalance at midrapidity in Pb-Pb collisions at a center-of-mass energy per nucleon pair $\sqrt{s_{\rm NN}} = 5.02$ TeV. Using the Statistical Hadronization framework, it is possible to obtain the value of the electric charge and baryon chemical potentials, $\mu_Q=-0.18\pm0.90$ MeV and $\mu_B=0.71\pm0.45$ MeV, with unprecedented precision. A centrality-differential study of the antiparticle-to-particle yield ratios of charged pions, protons, $\Omega$-baryons, and light (hyper)nuclei is performed. These results indicate that the system created in Pb-Pb collisions at the LHC is on average baryon-free and electrically neutral at midrapidity.
Phys. Rev. Lett. 133 (2024) 092301
HEP Data
e-Print: arXiv:2311.13332 | PDF | inSPIRE
CERN-EP-2023-268
Figure group
Figure 1
Upper panels: statistical hadronization model fits to the measured antiparticle-to-particle yield ratios in different centrality intervals. Error bars show the sum in quadrature of statistical and centrality-uncorrelated systematic uncertainties. When not visible, error bars are hidden by the marker. Lower panels: pull distribution, defined as the difference between data and fit values, normalized to the uncertainty in the data. | 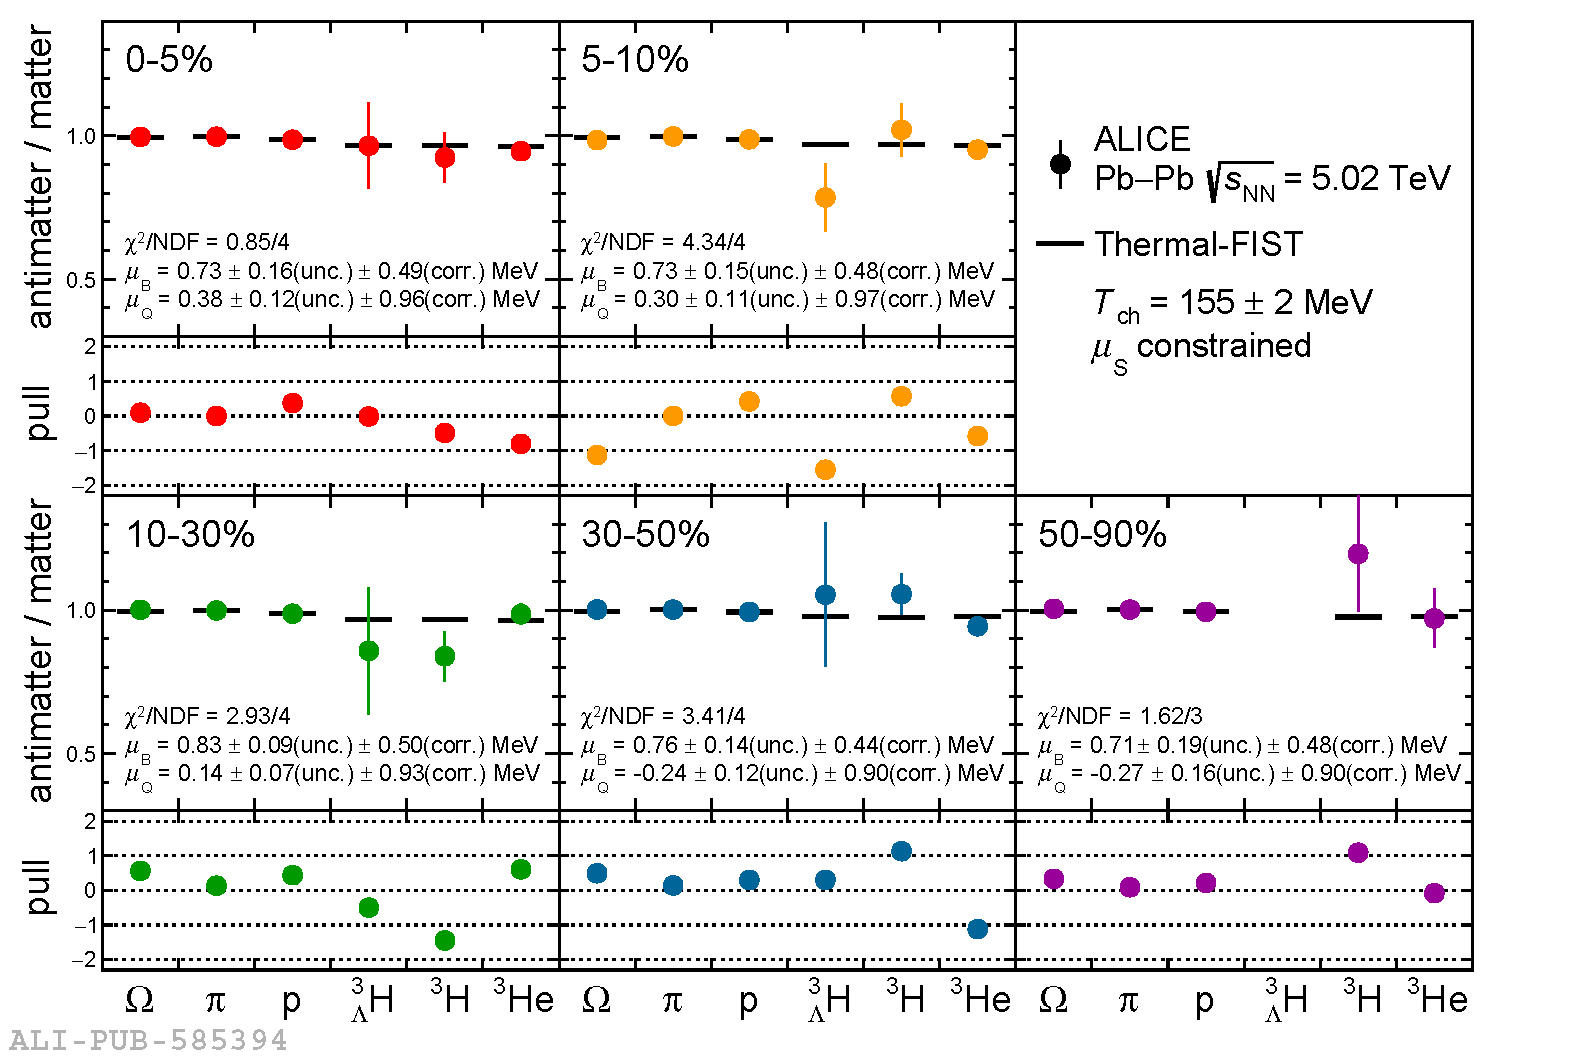 |
Figure 2
Left panel: $\mu_B$ and $\mu_Q$ obtained with Thermal-FIST in different centrality intervals. The centrality-correlated and centrality-uncorrelated uncertainties are represented with error bars and ellipses, respectively. Right panel: $\mu_B$ extracted from data collected in Au--Au and Pb--Pb collisions at the AGS (E802, E866, E877, E895, E896, E917 Collaborations), SPS (NA44, NA49, NA47 Collaborations), RHIC (BRAHMS, PHENIX, STAR Collaboration), and LHC (ALICE Collaboration) as a function of the center-of-mass energy per nucleon--nucleon pair , and phenomenological parameterization of $\mu_B(\sqrt{s_{\mathrm{NN}}})$ . The inset shows more in detail the results obtained at the LHC . | 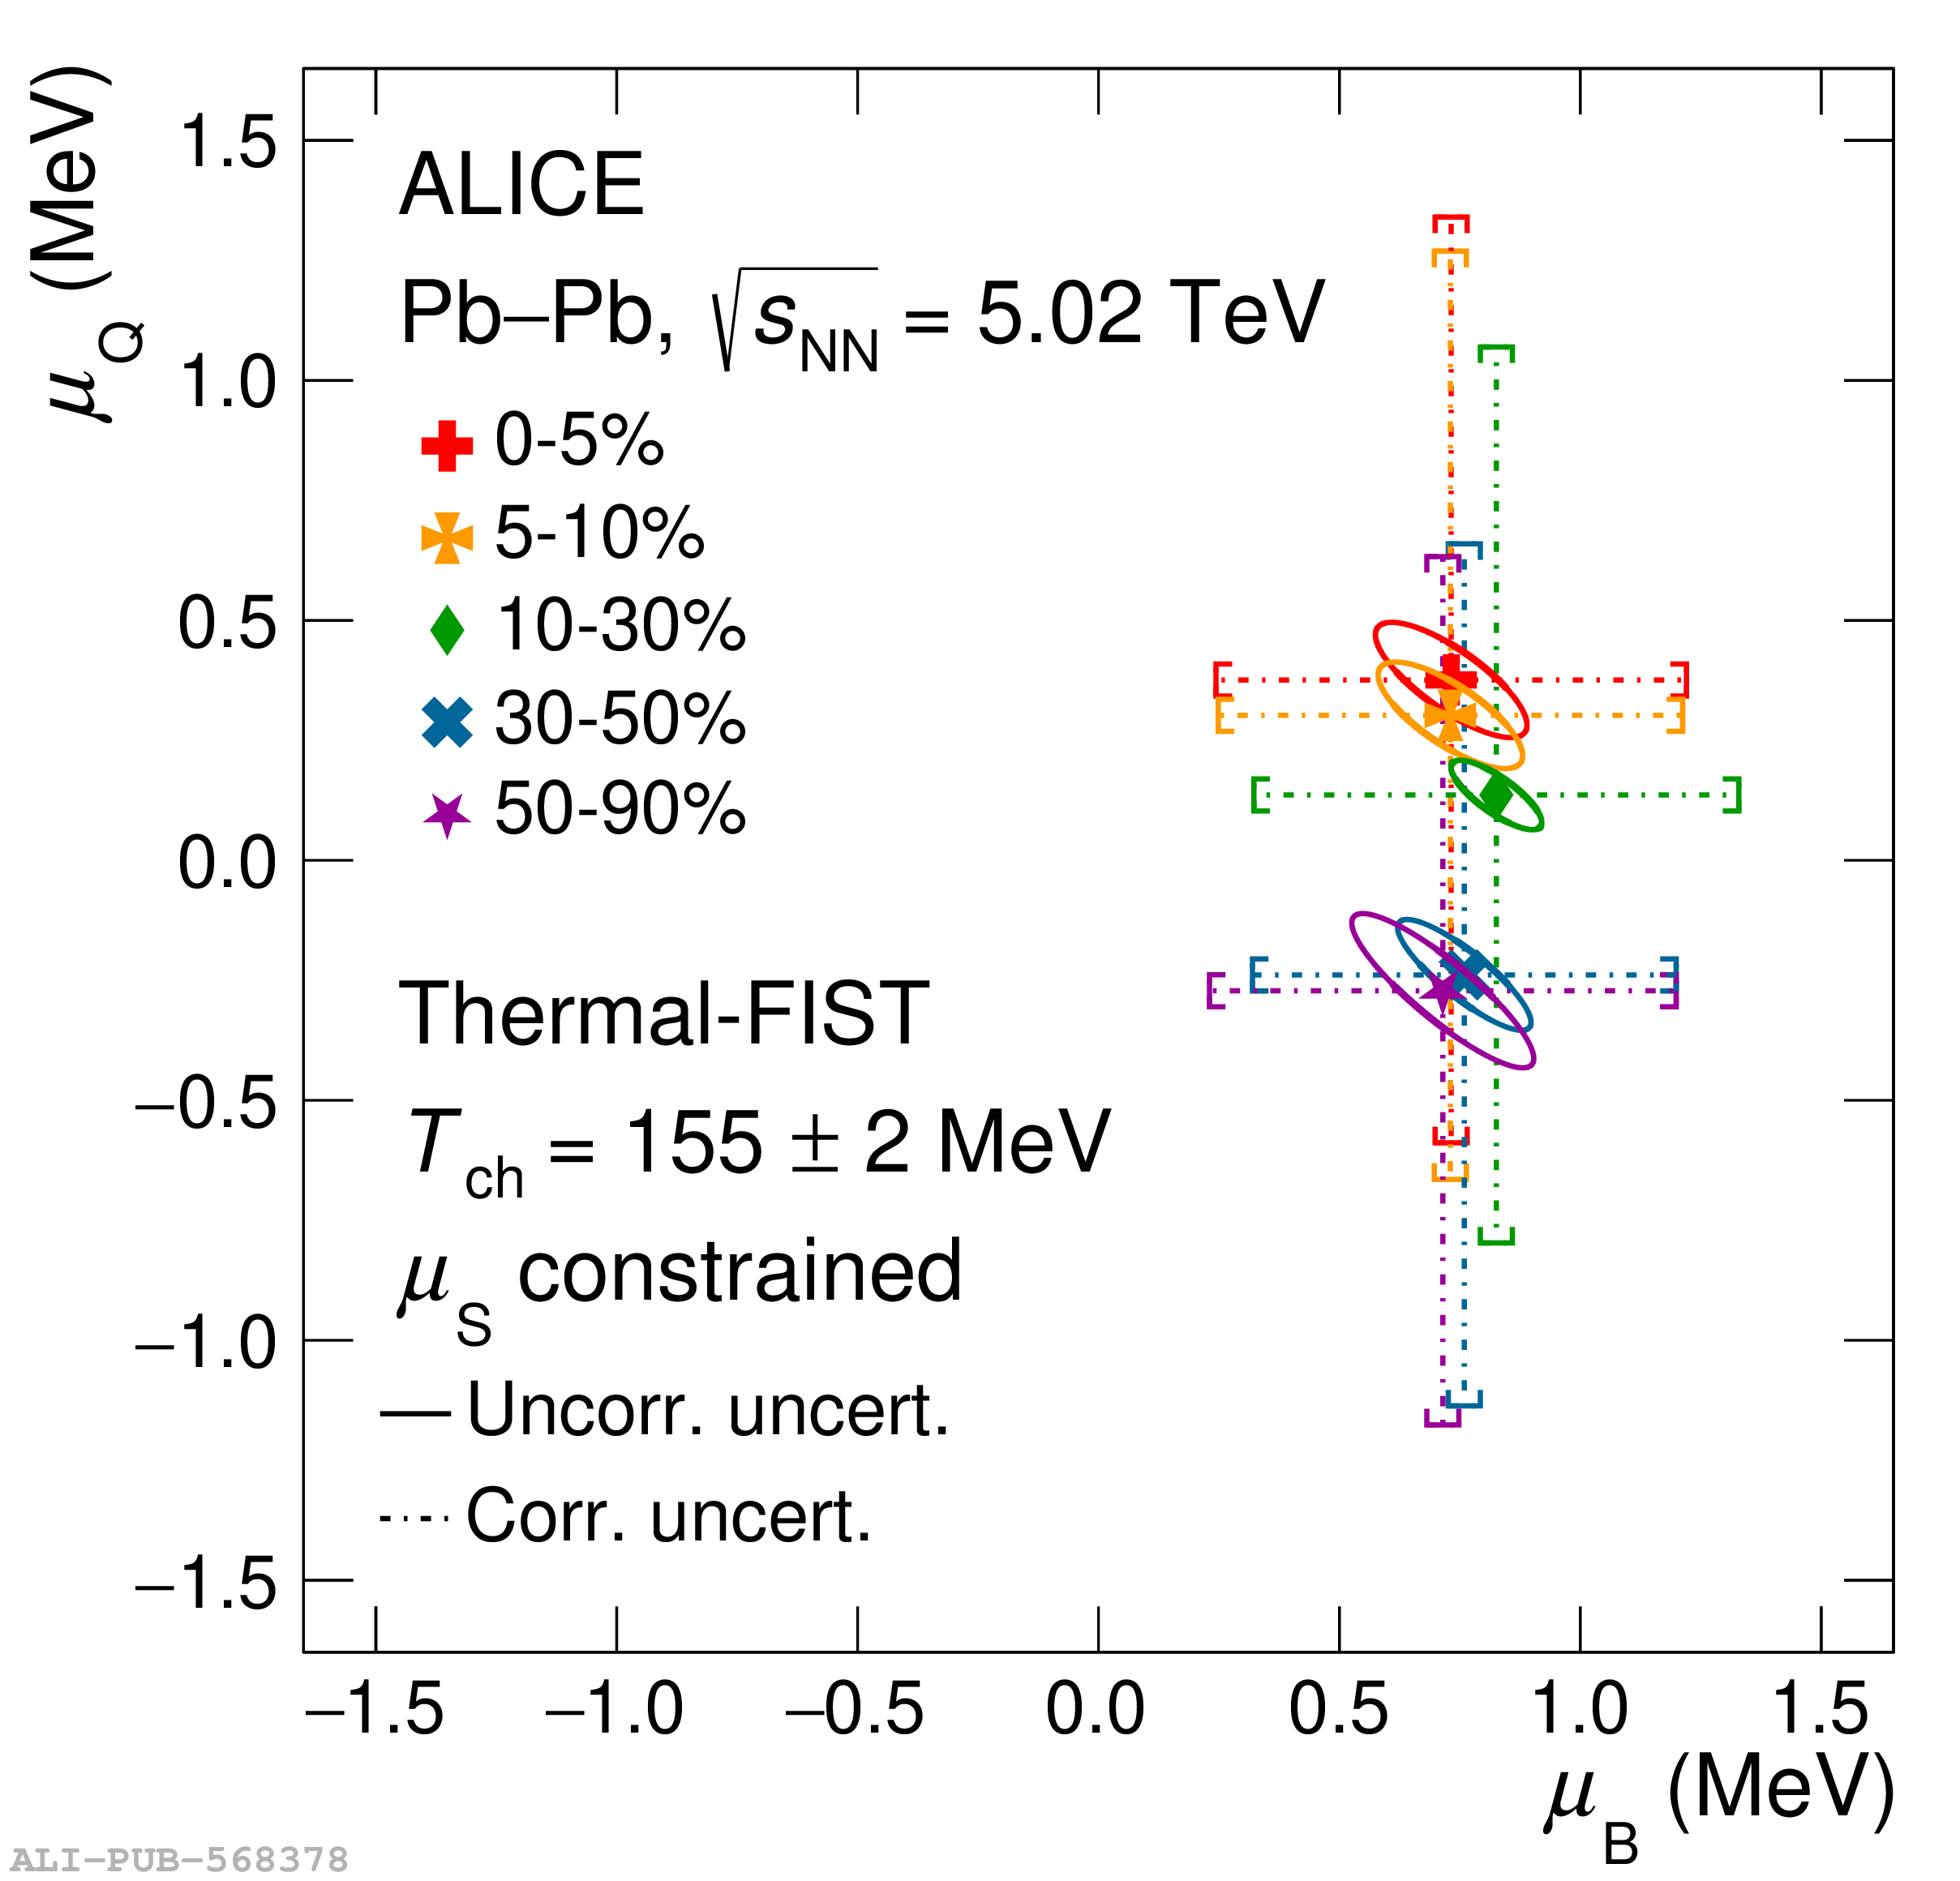 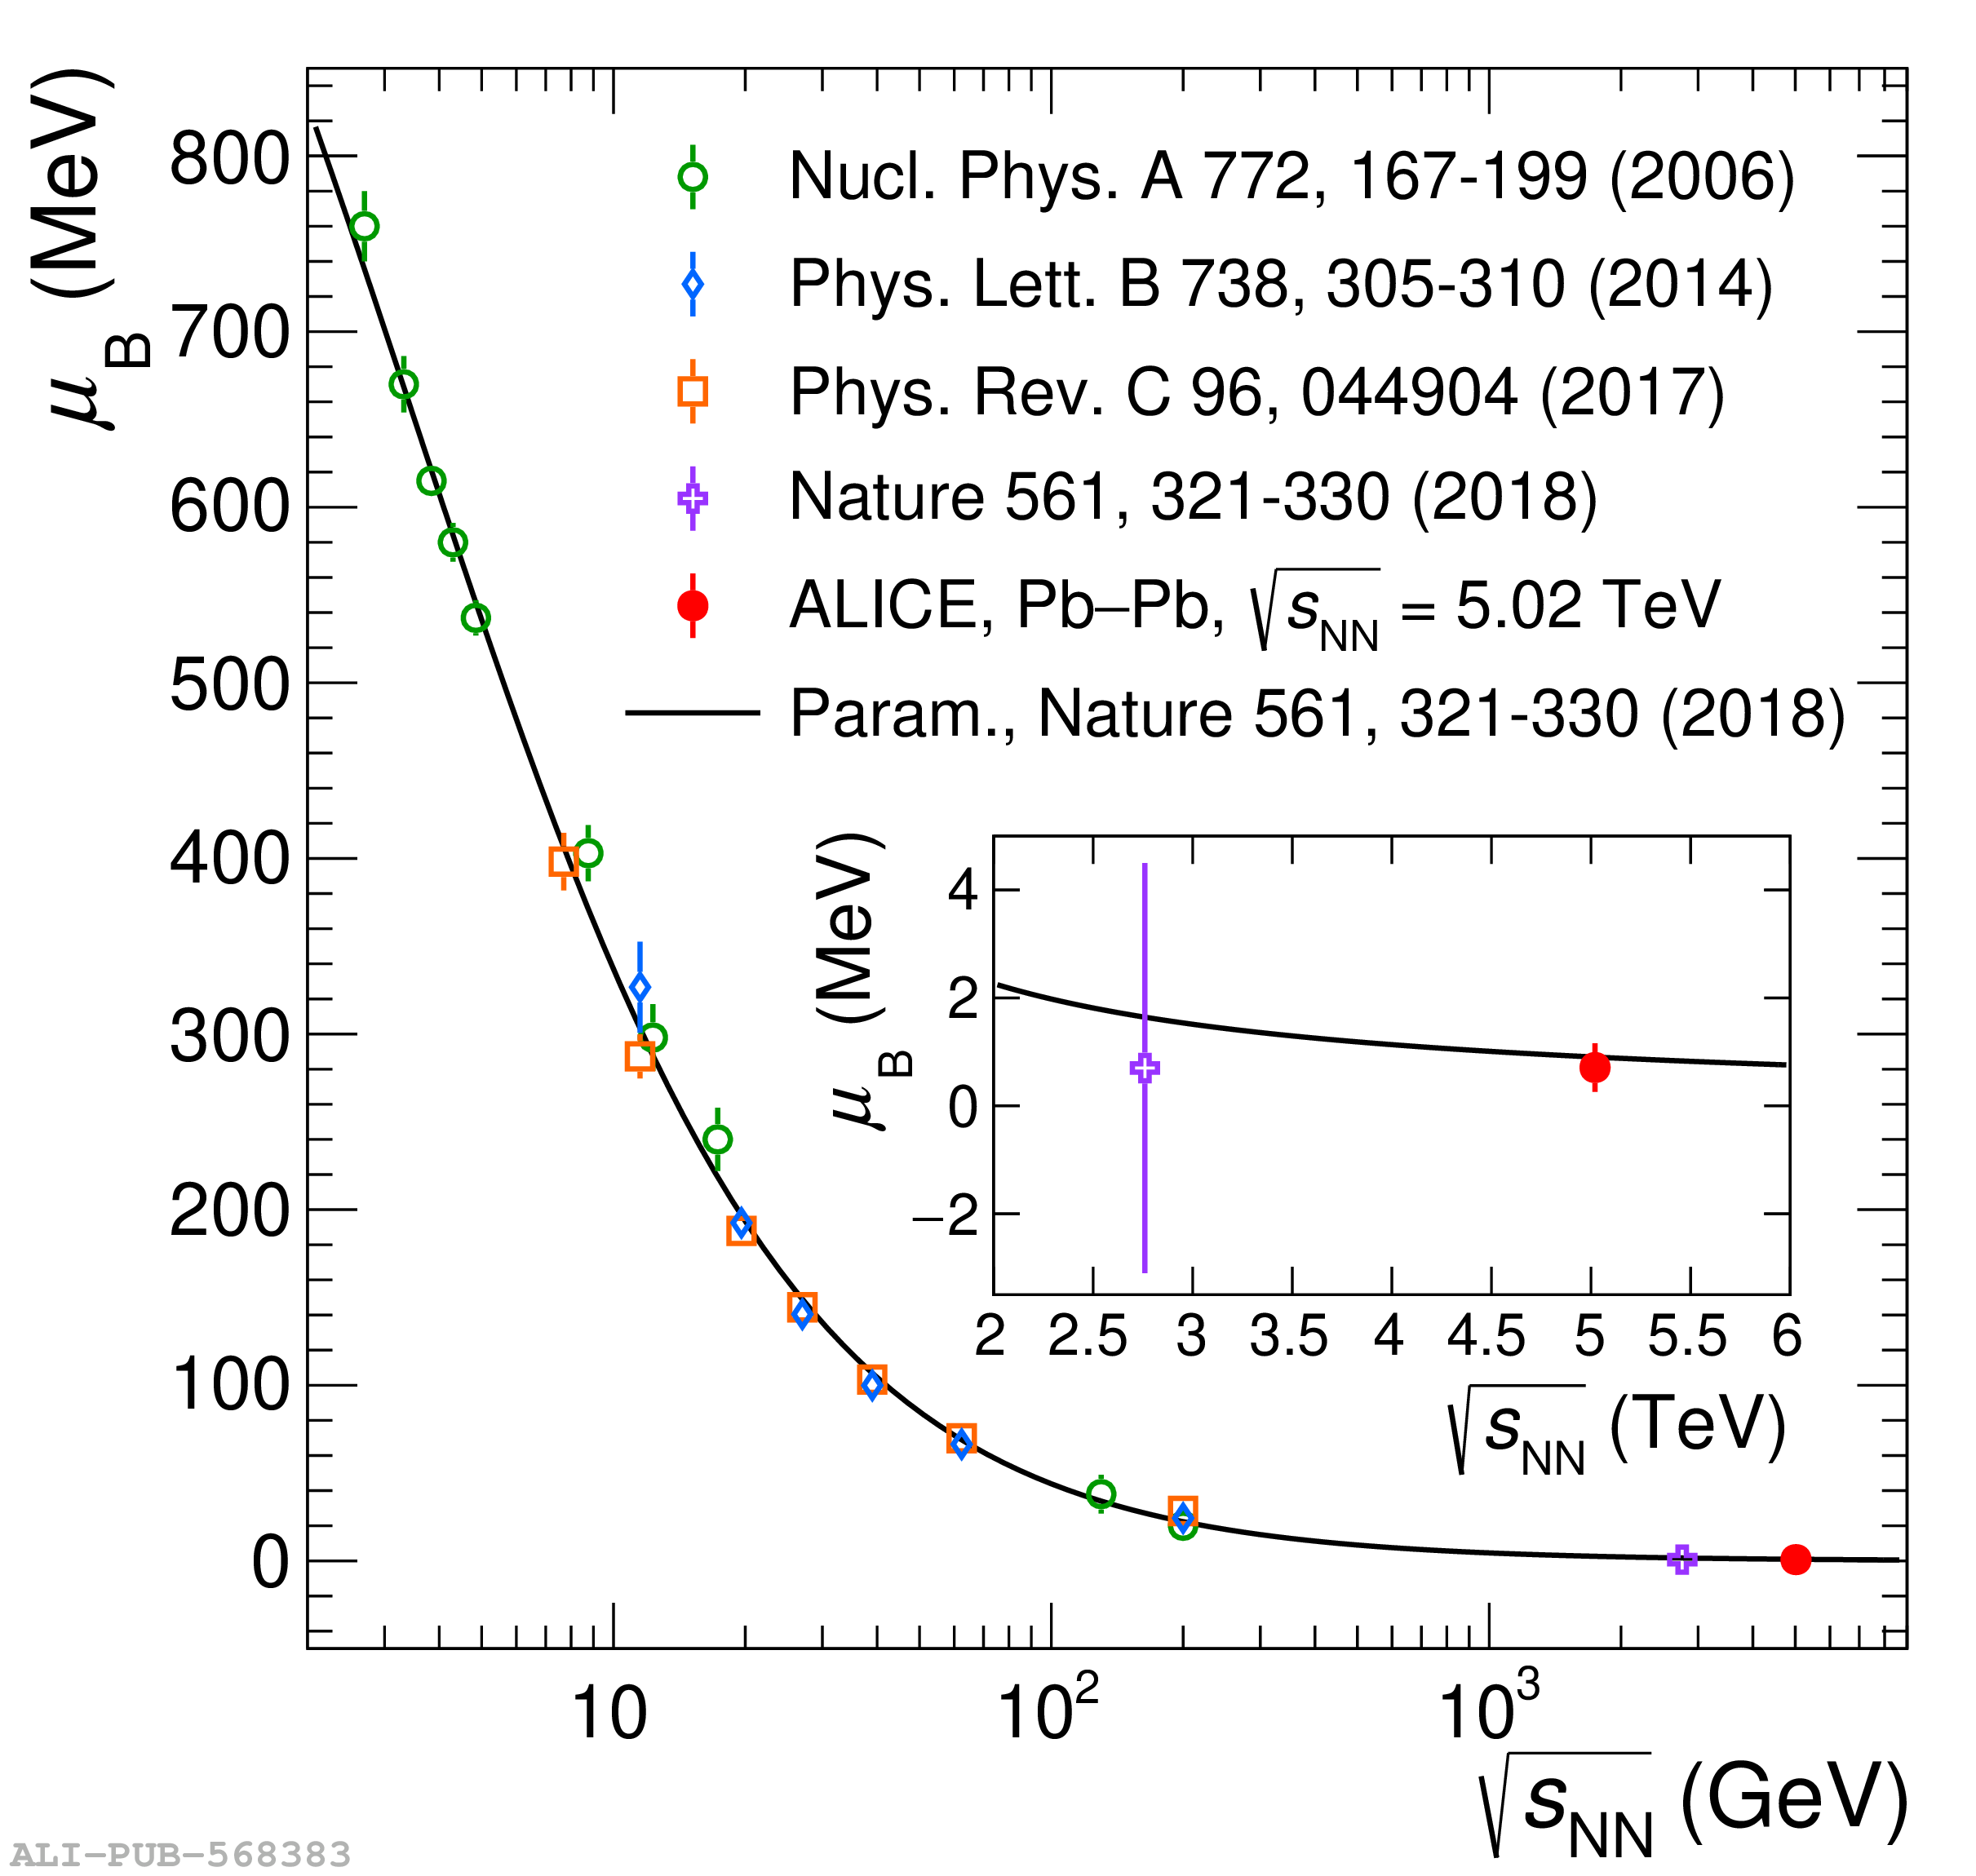 |
Figure A.1
$p_{\mathrm{T}}$- and $ct$-differential ratios of the species used for the chemical potential measurement in the various centrality intervals. Error bars show statistical uncertainties, while boxes represent centrality-uncorrelated uncertainties. The value of $R$ represents the averages weighted with the total uncorrelated uncertainties of the differential measurements. The correlated uncertainties are not shown in the plots. | 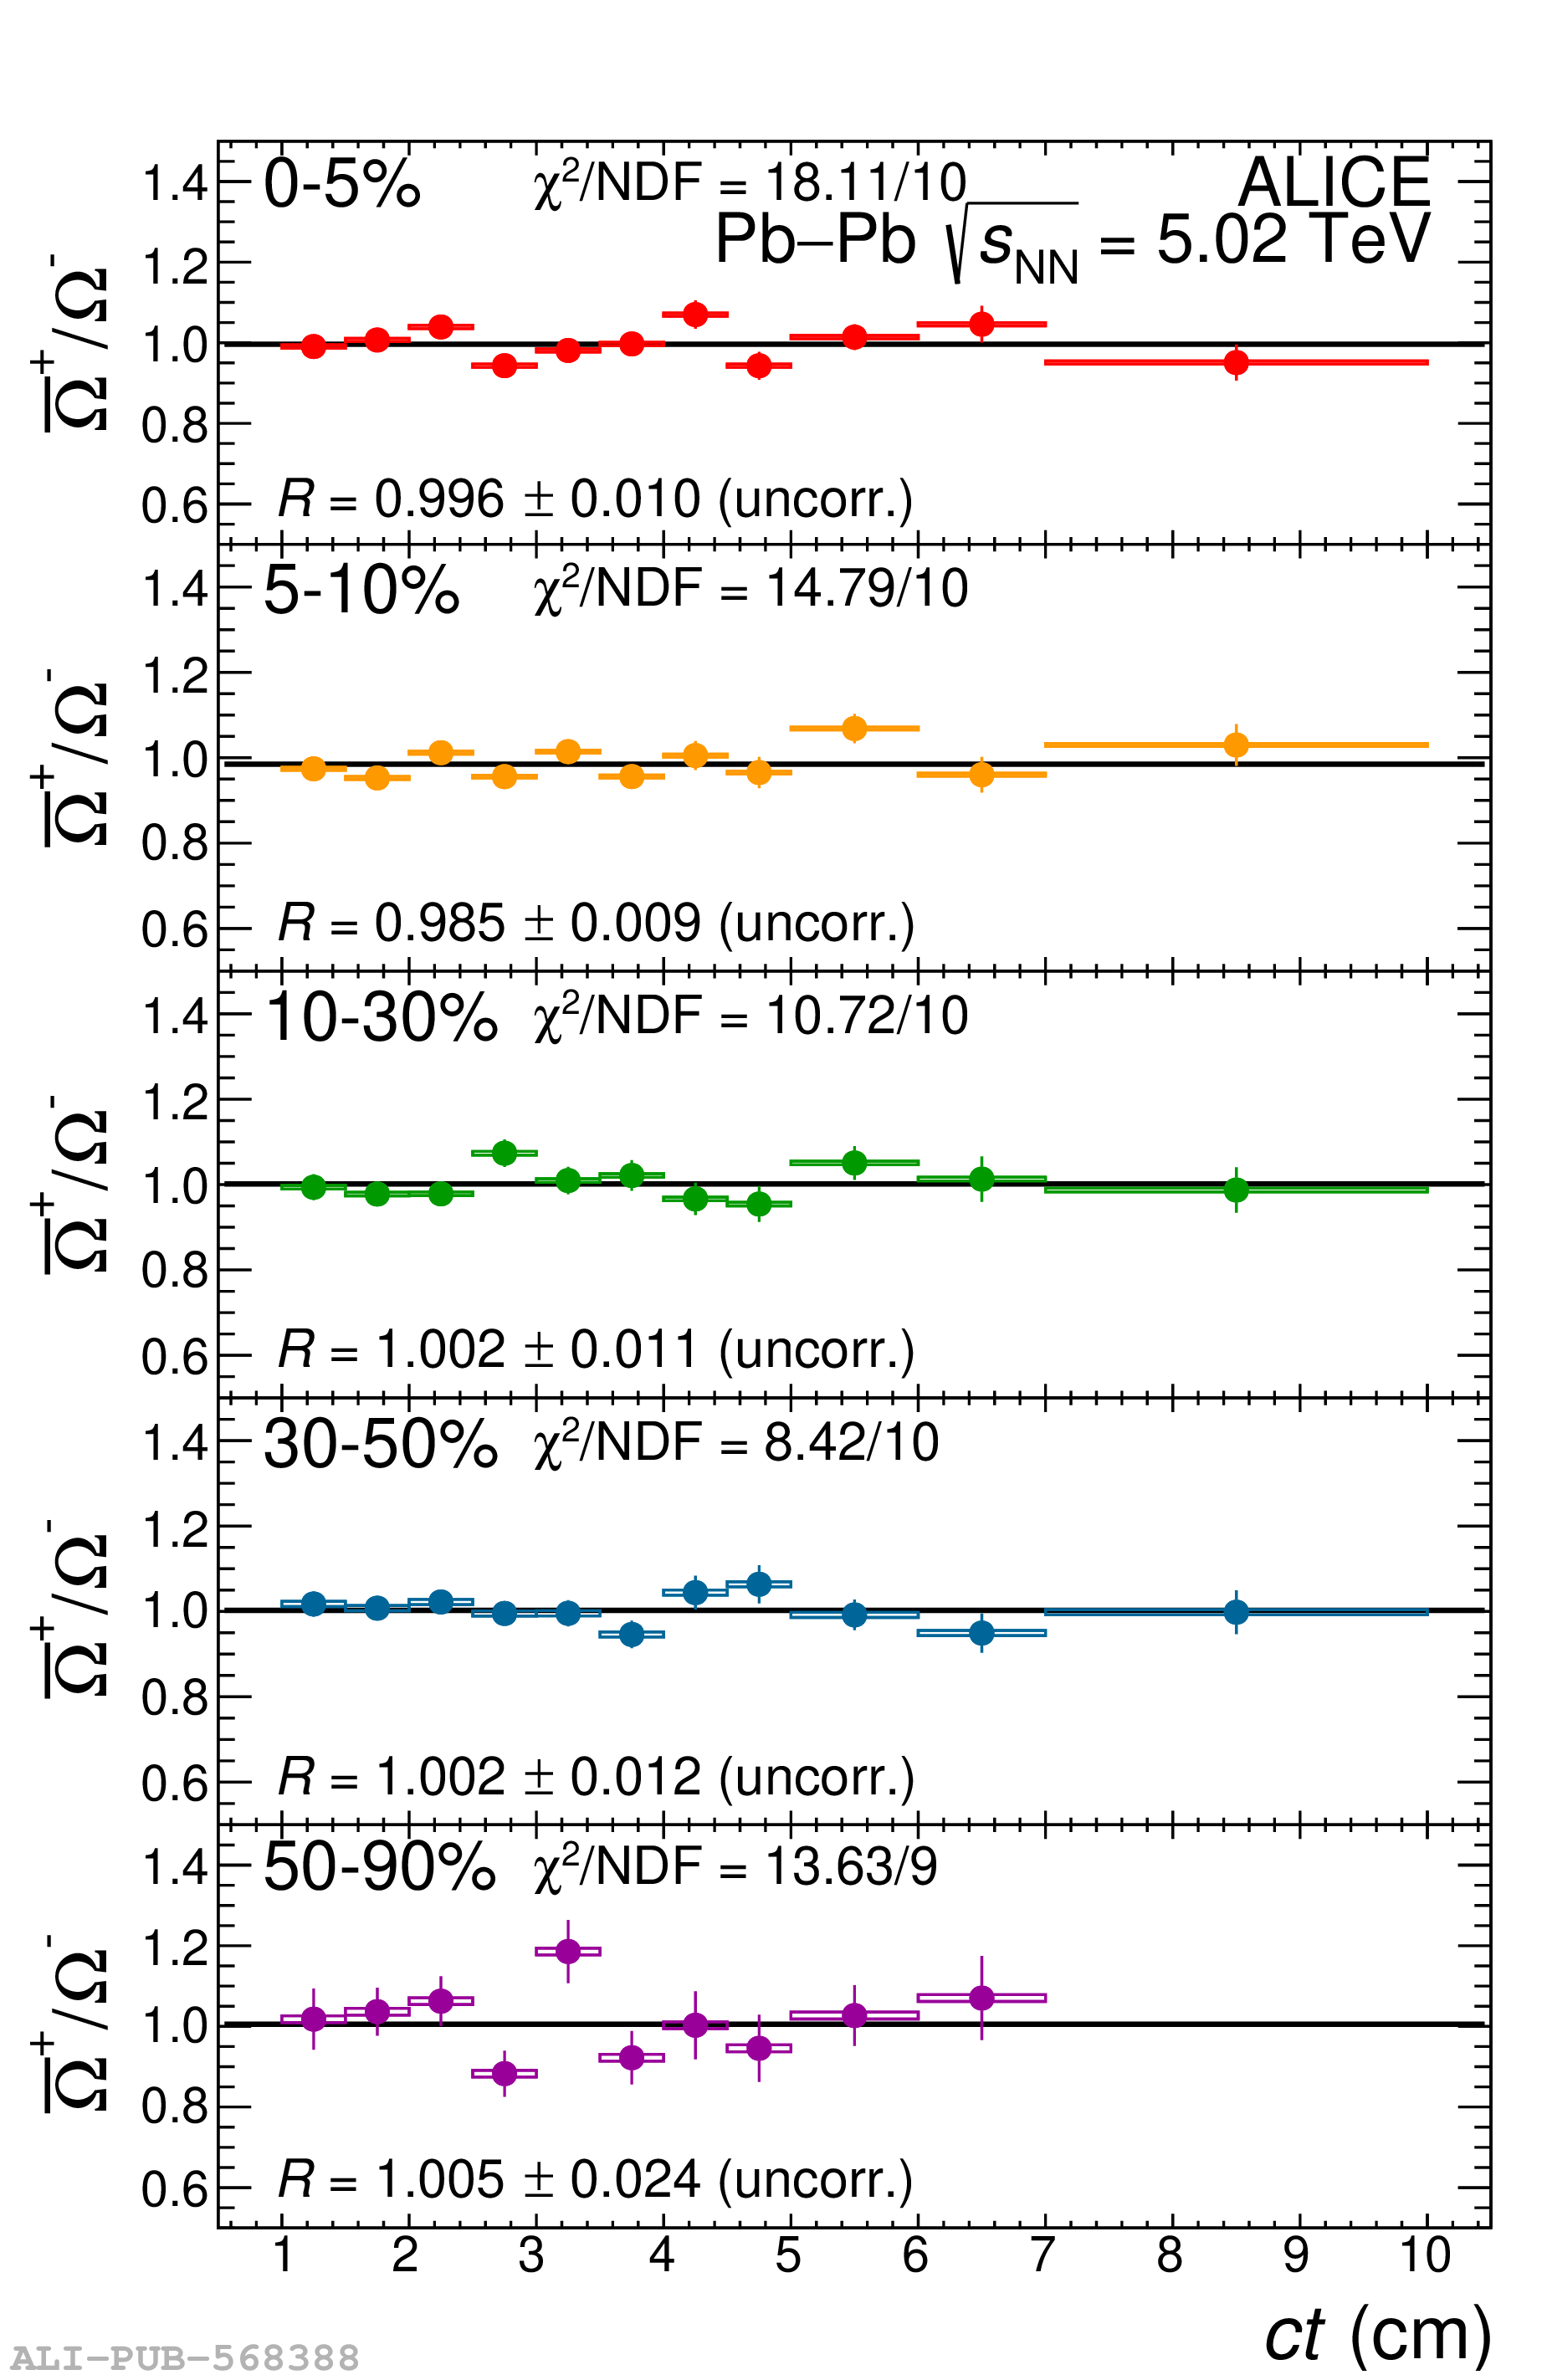 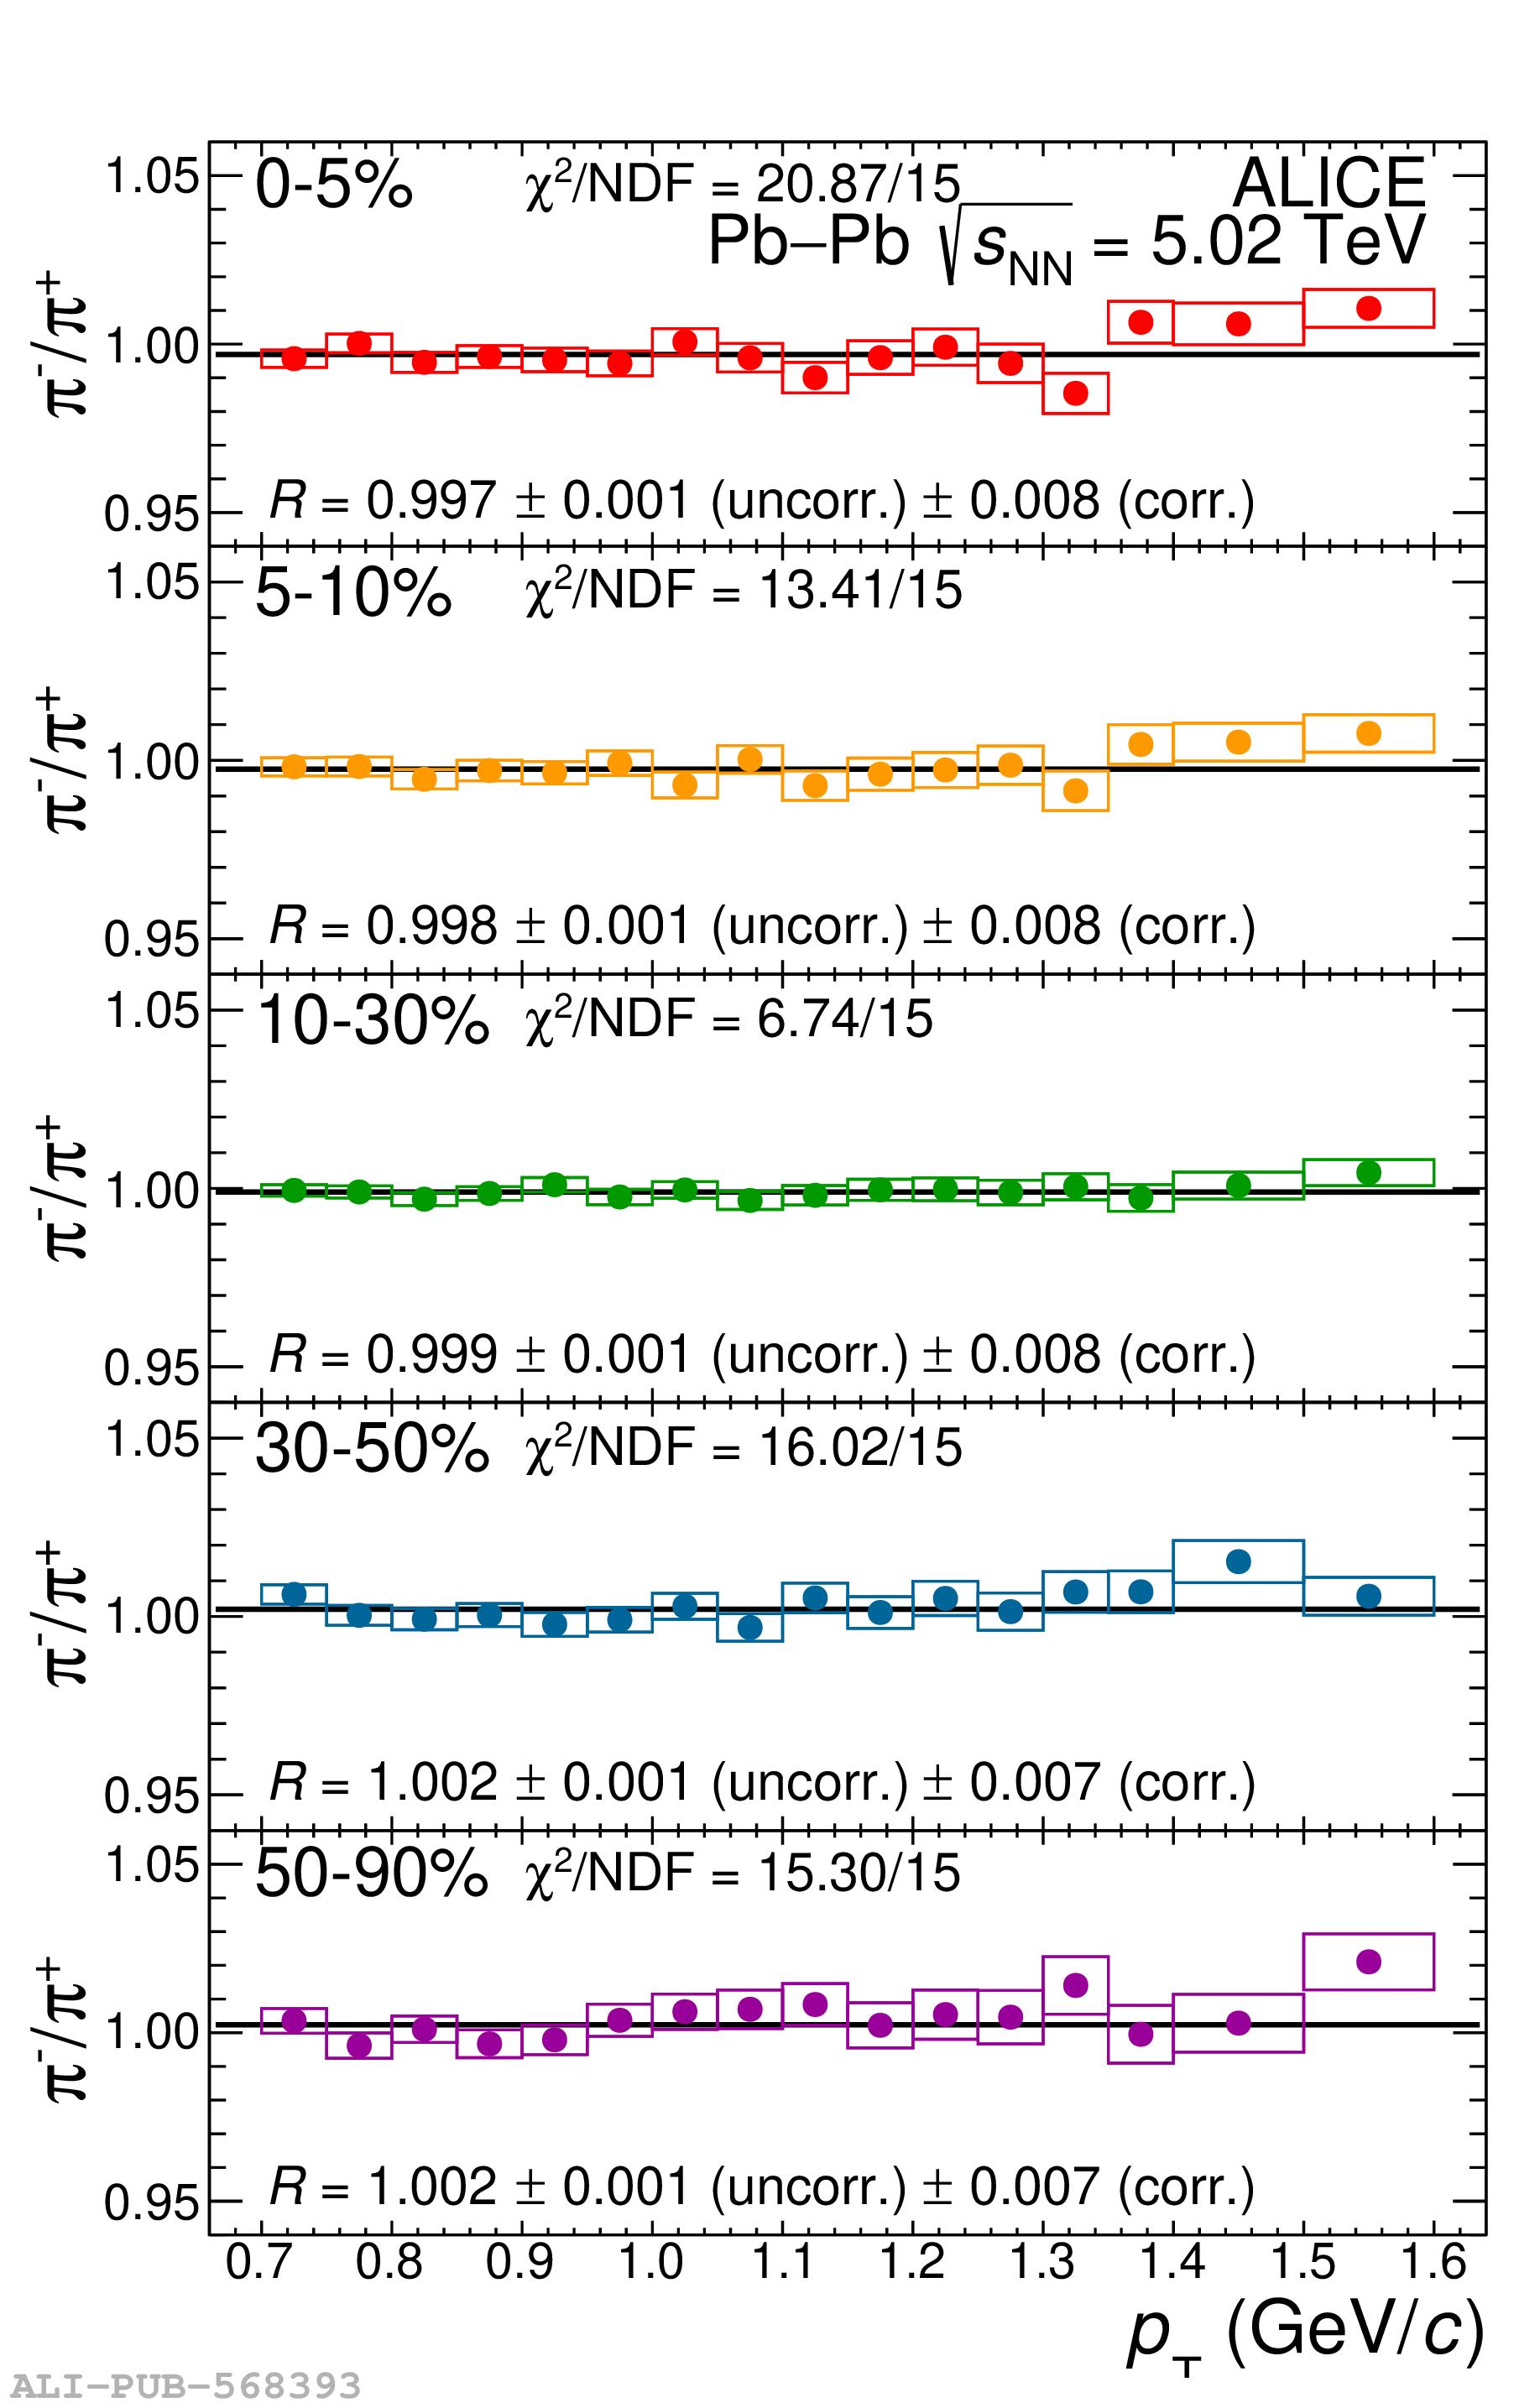 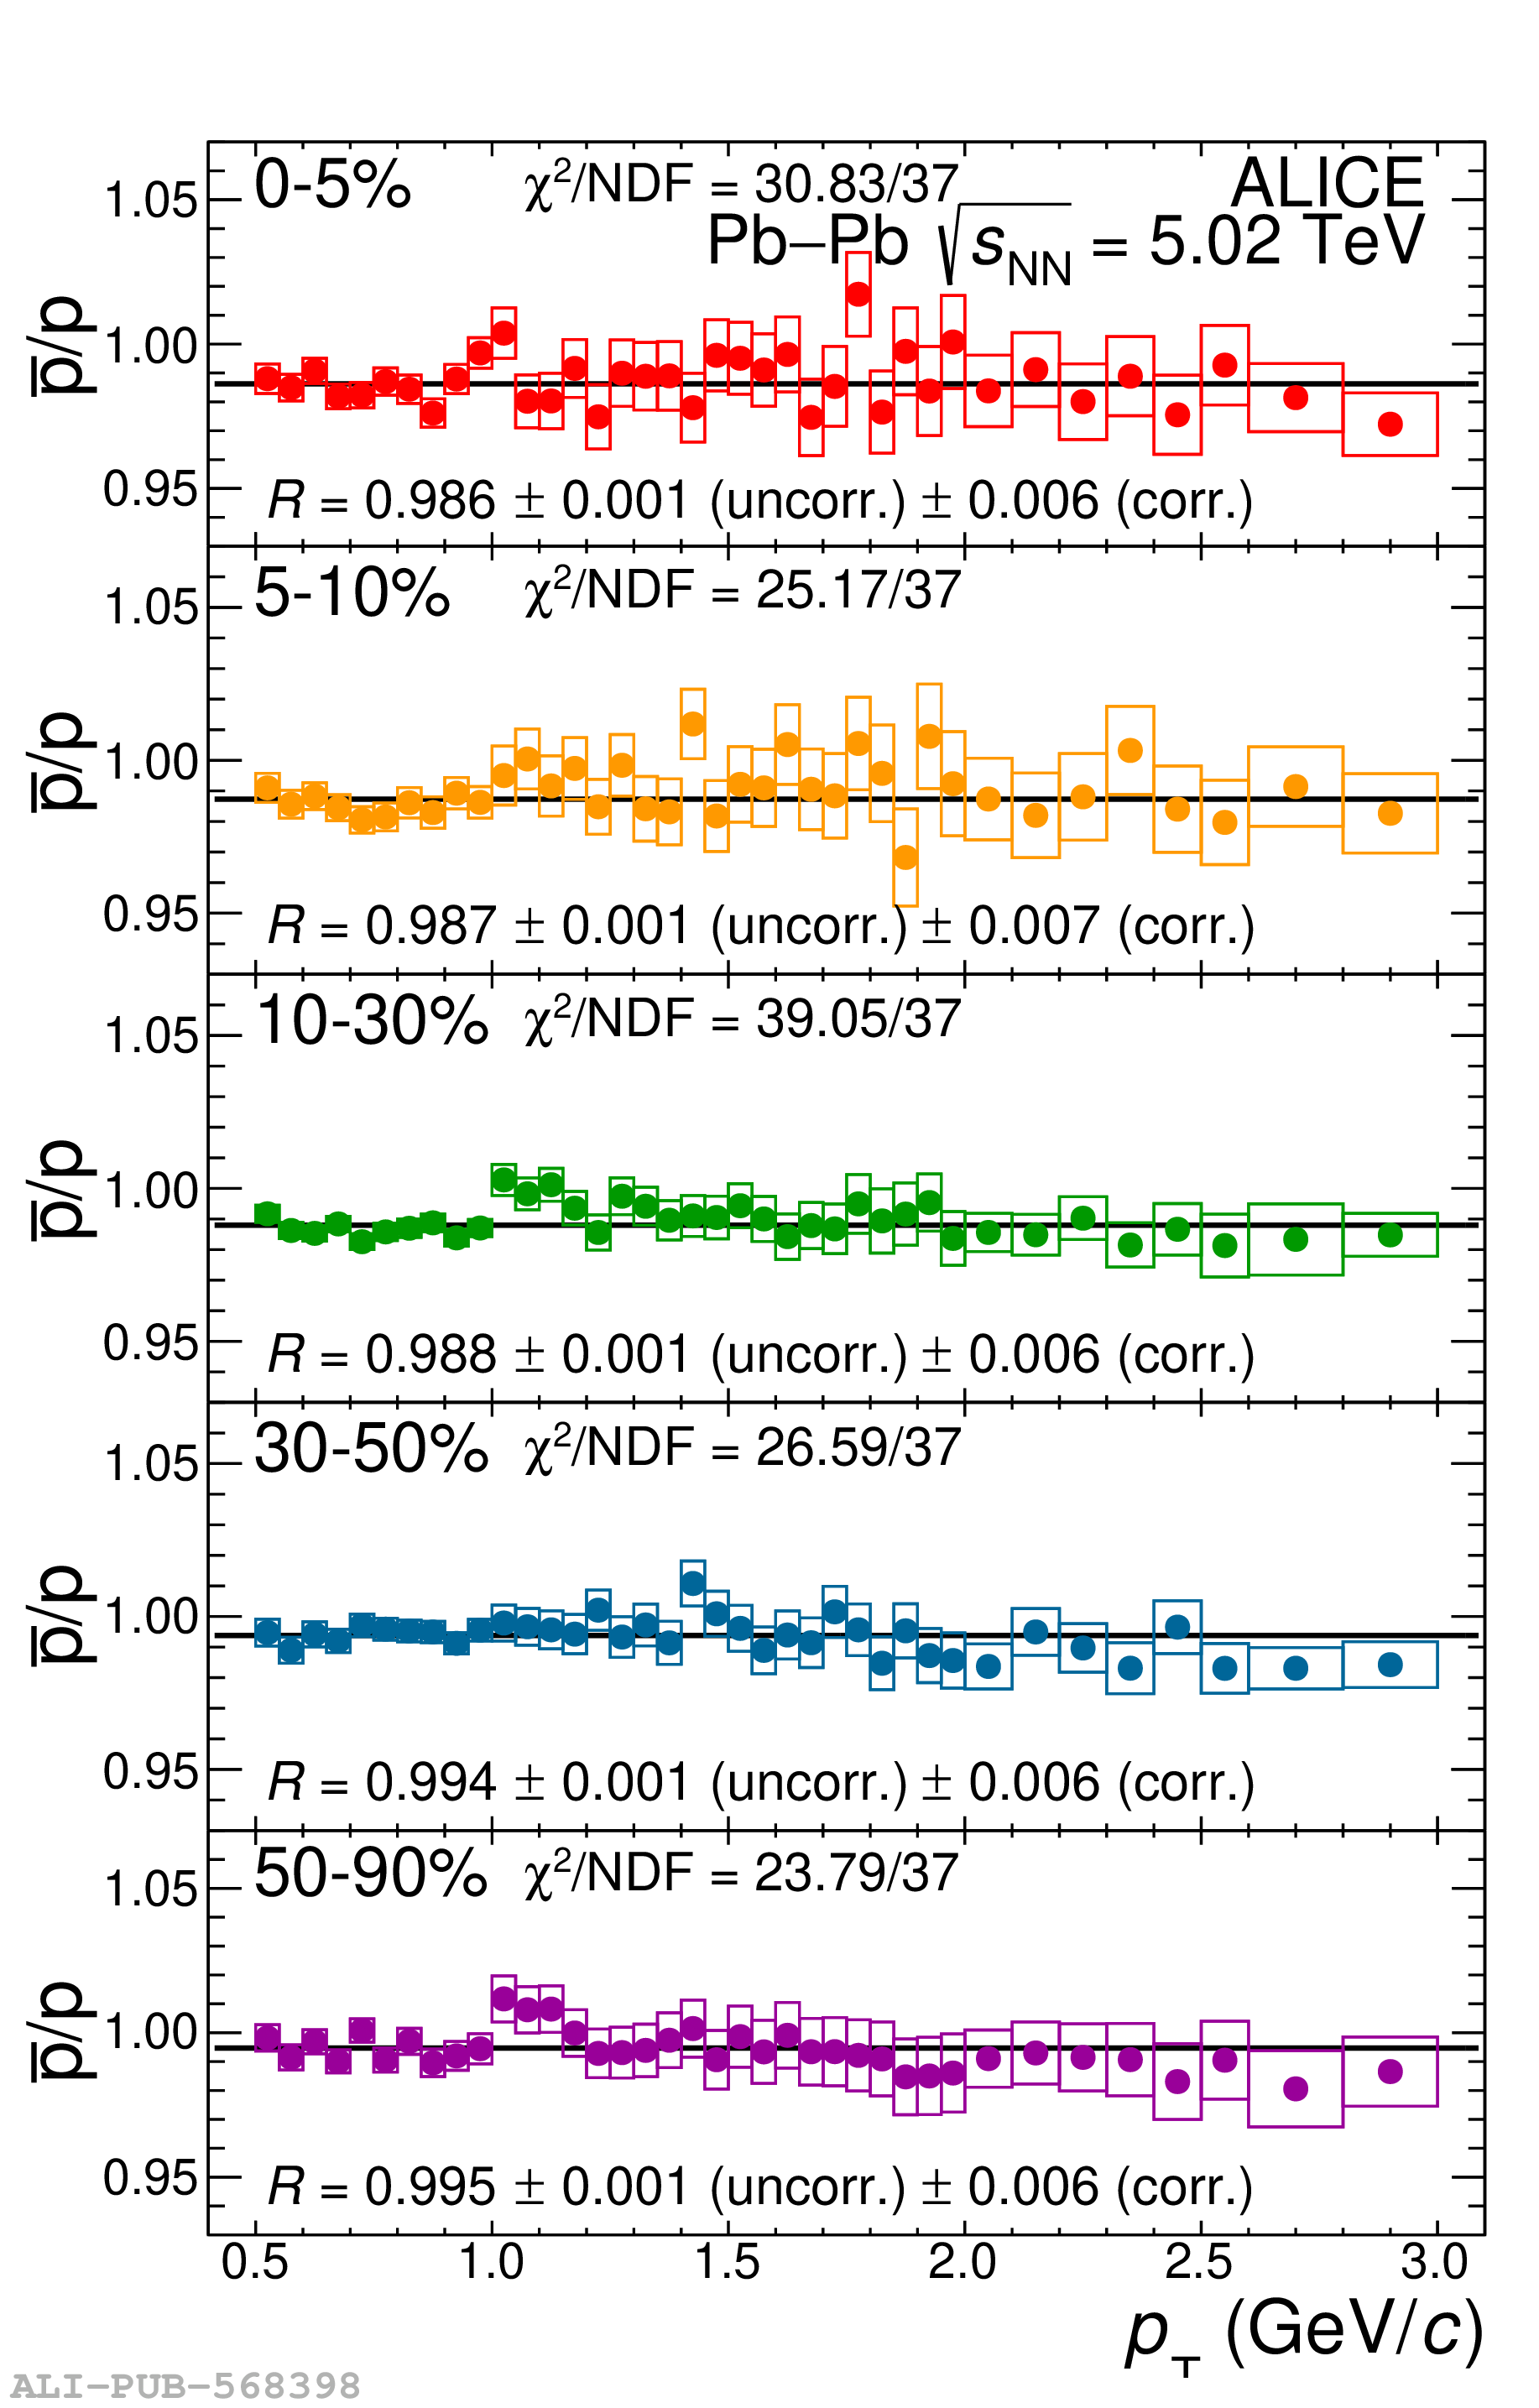 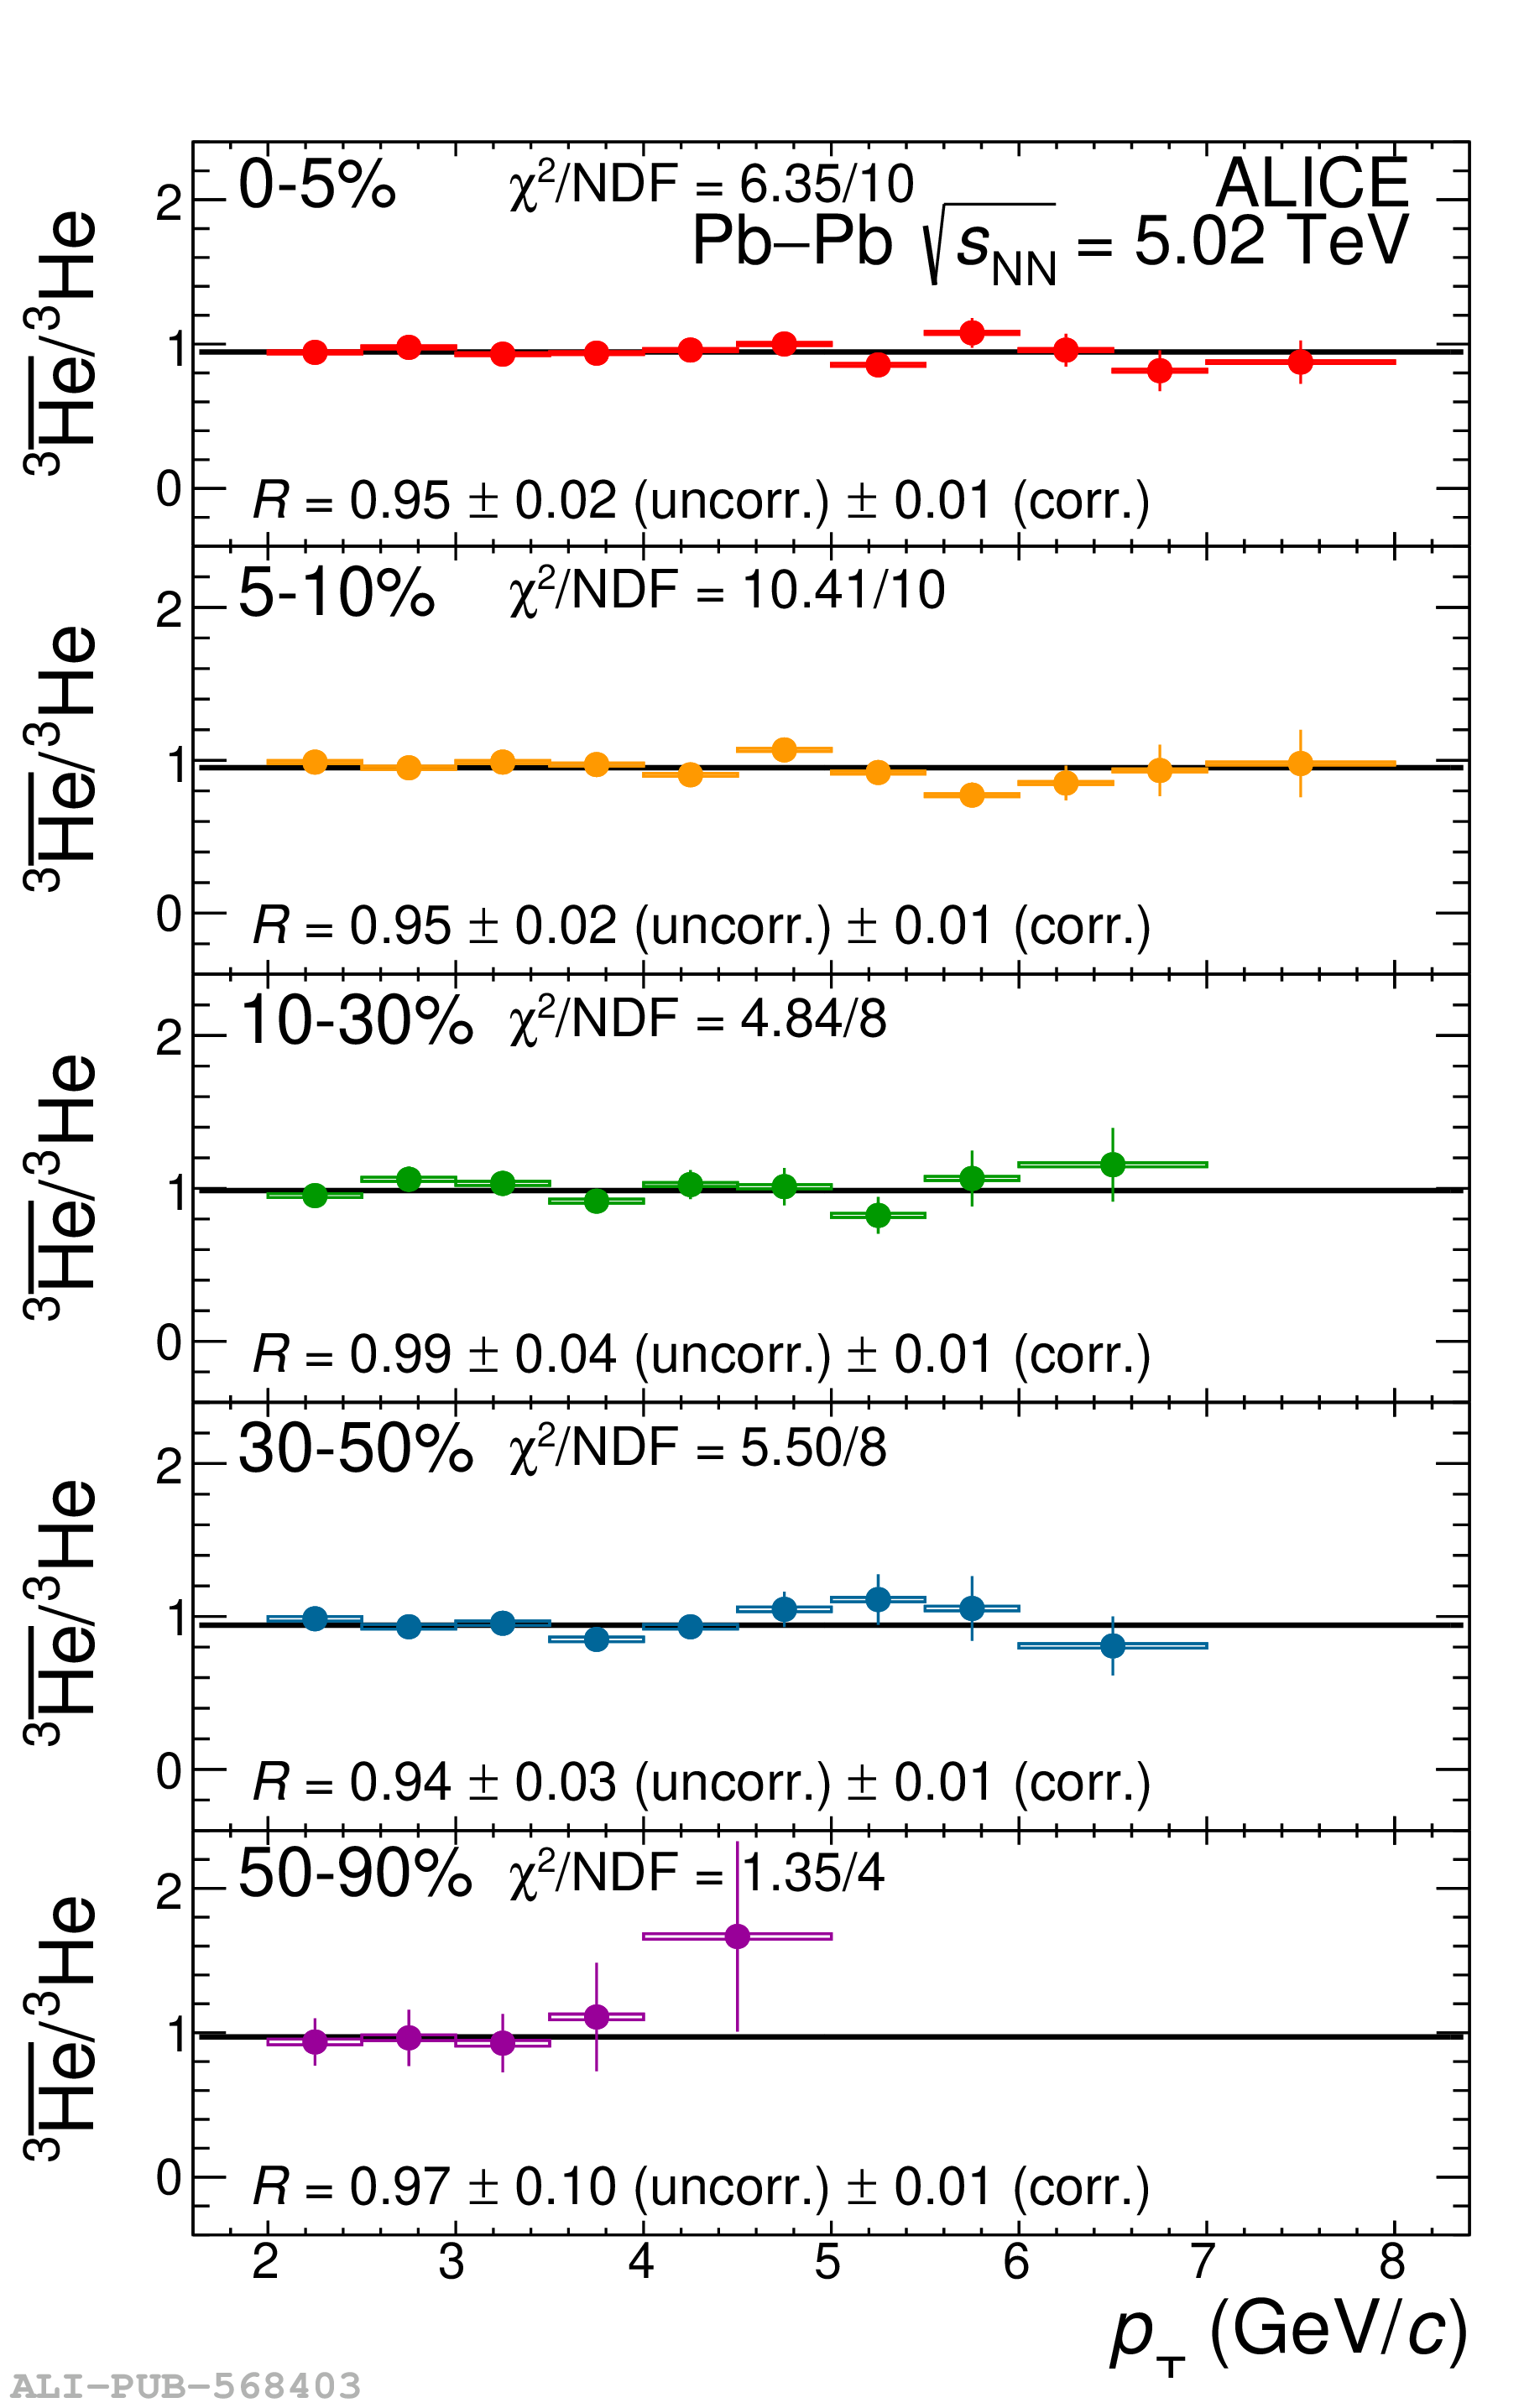 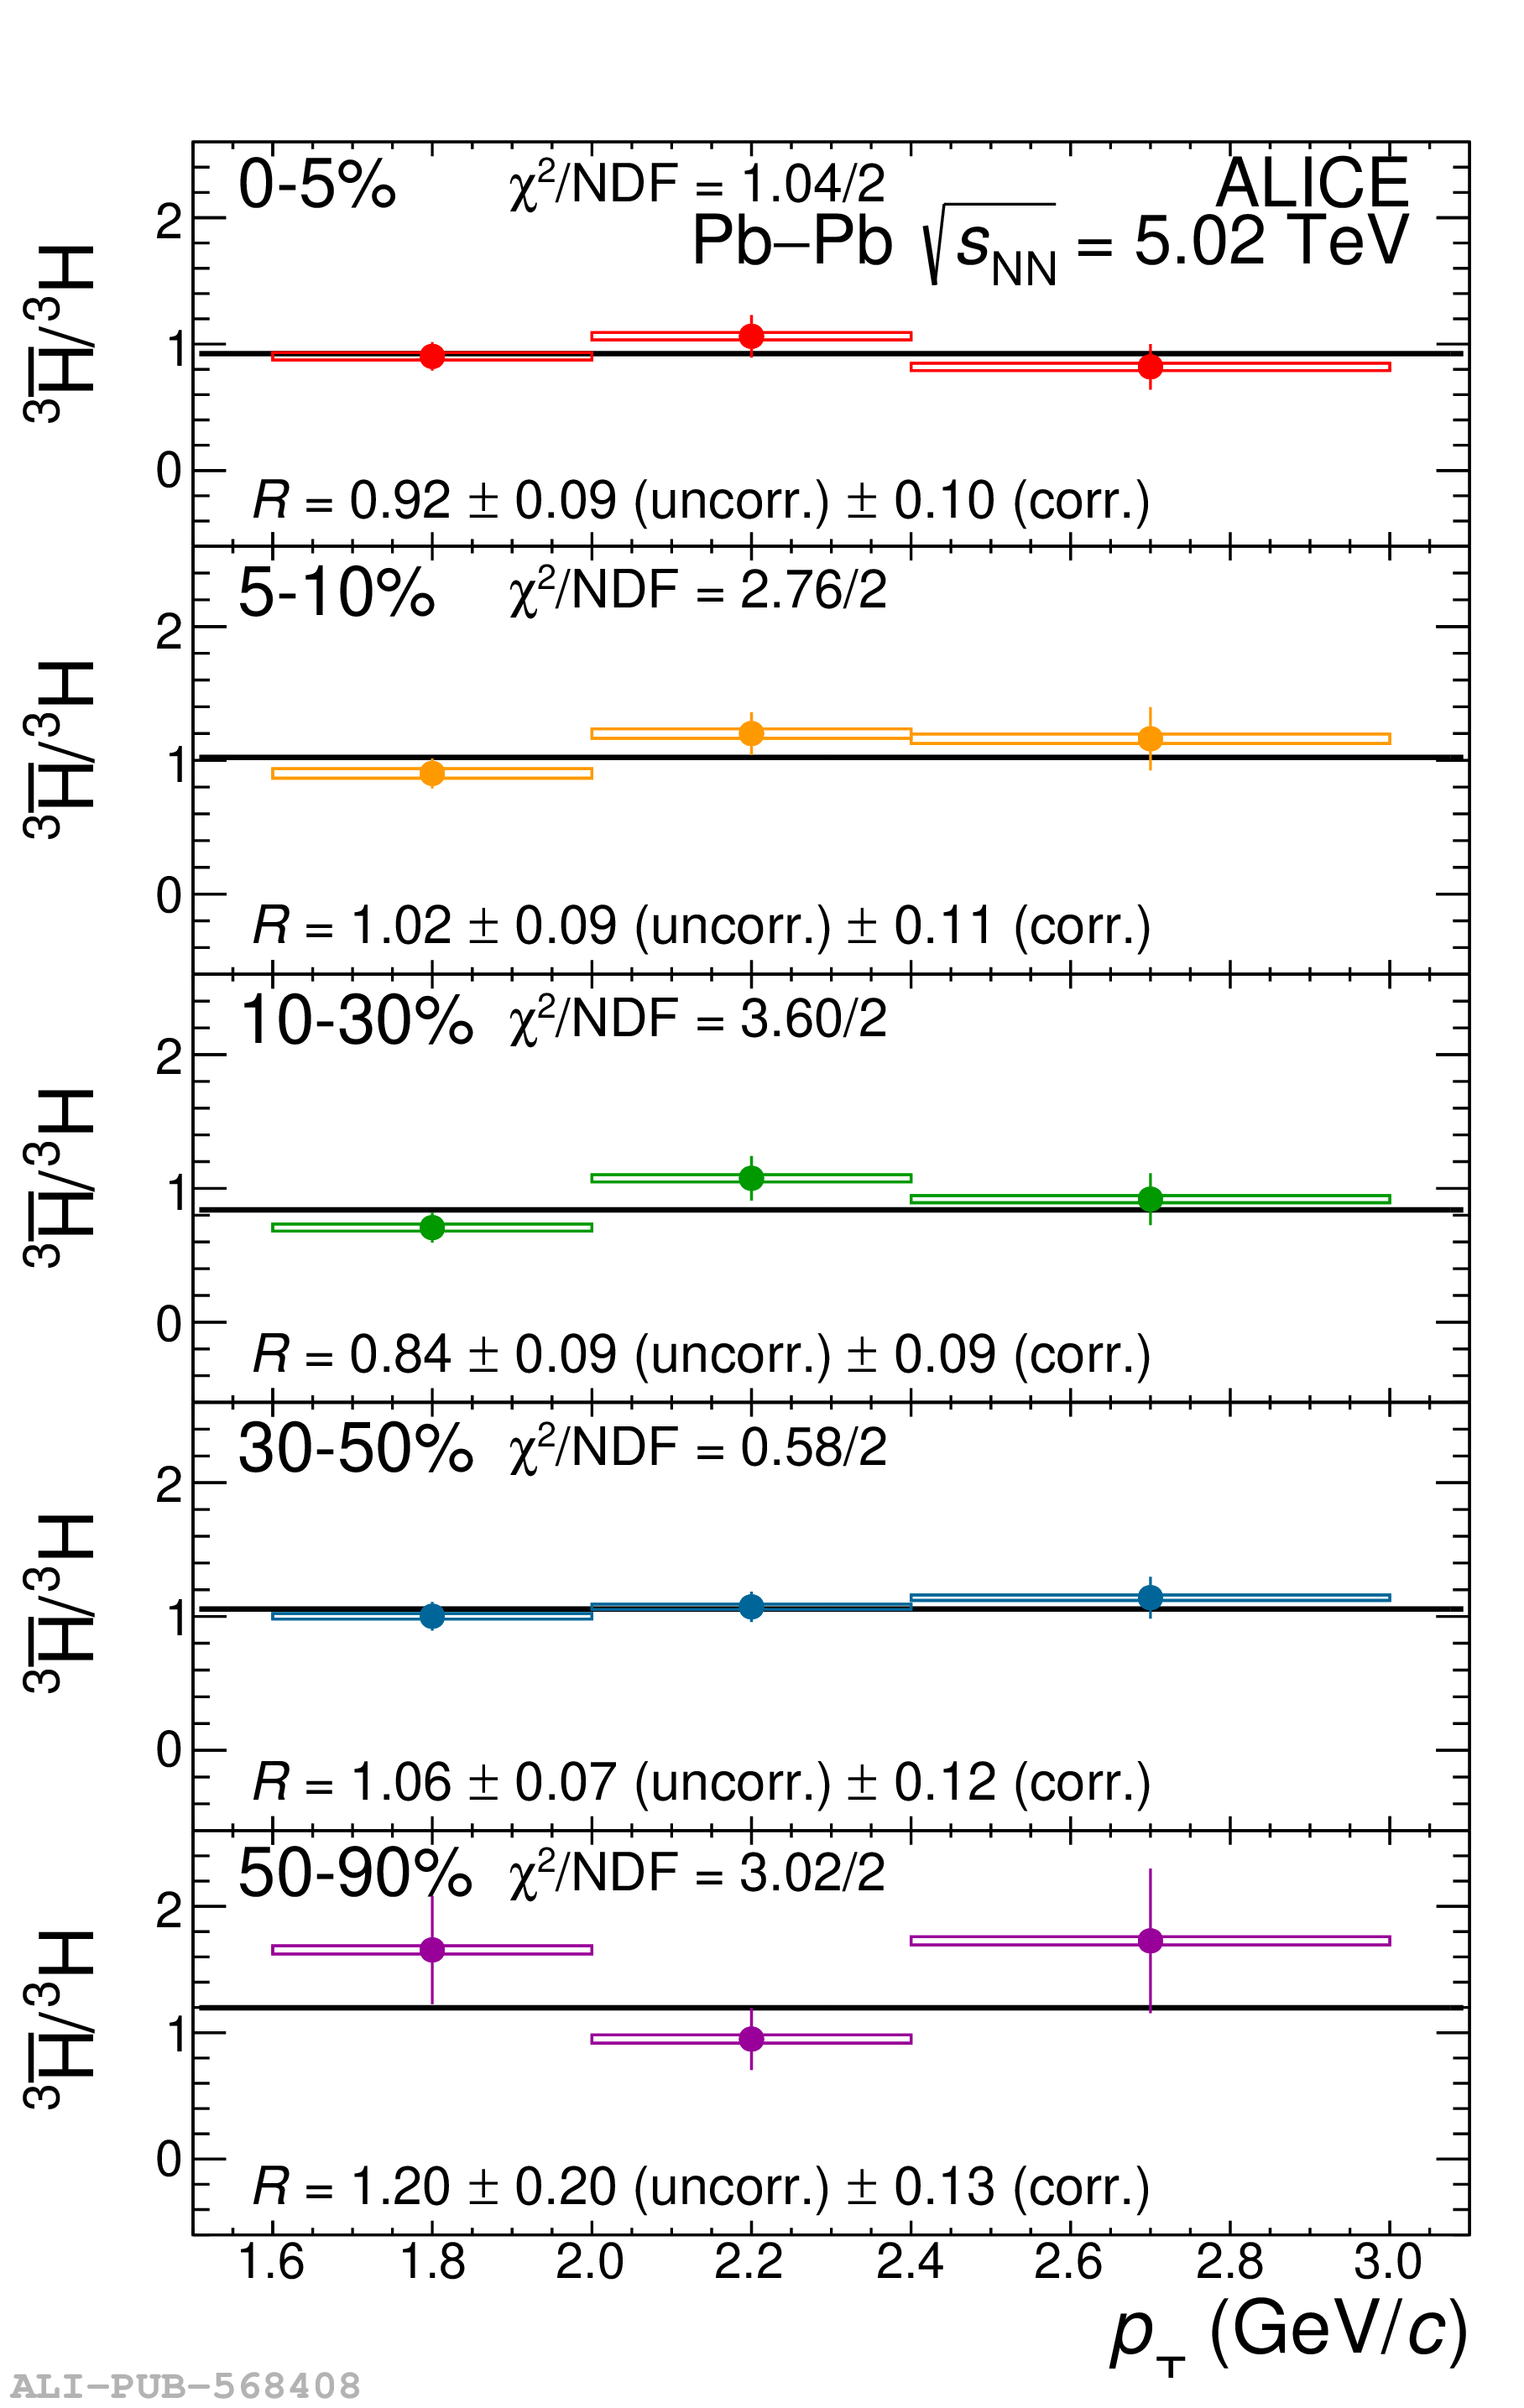 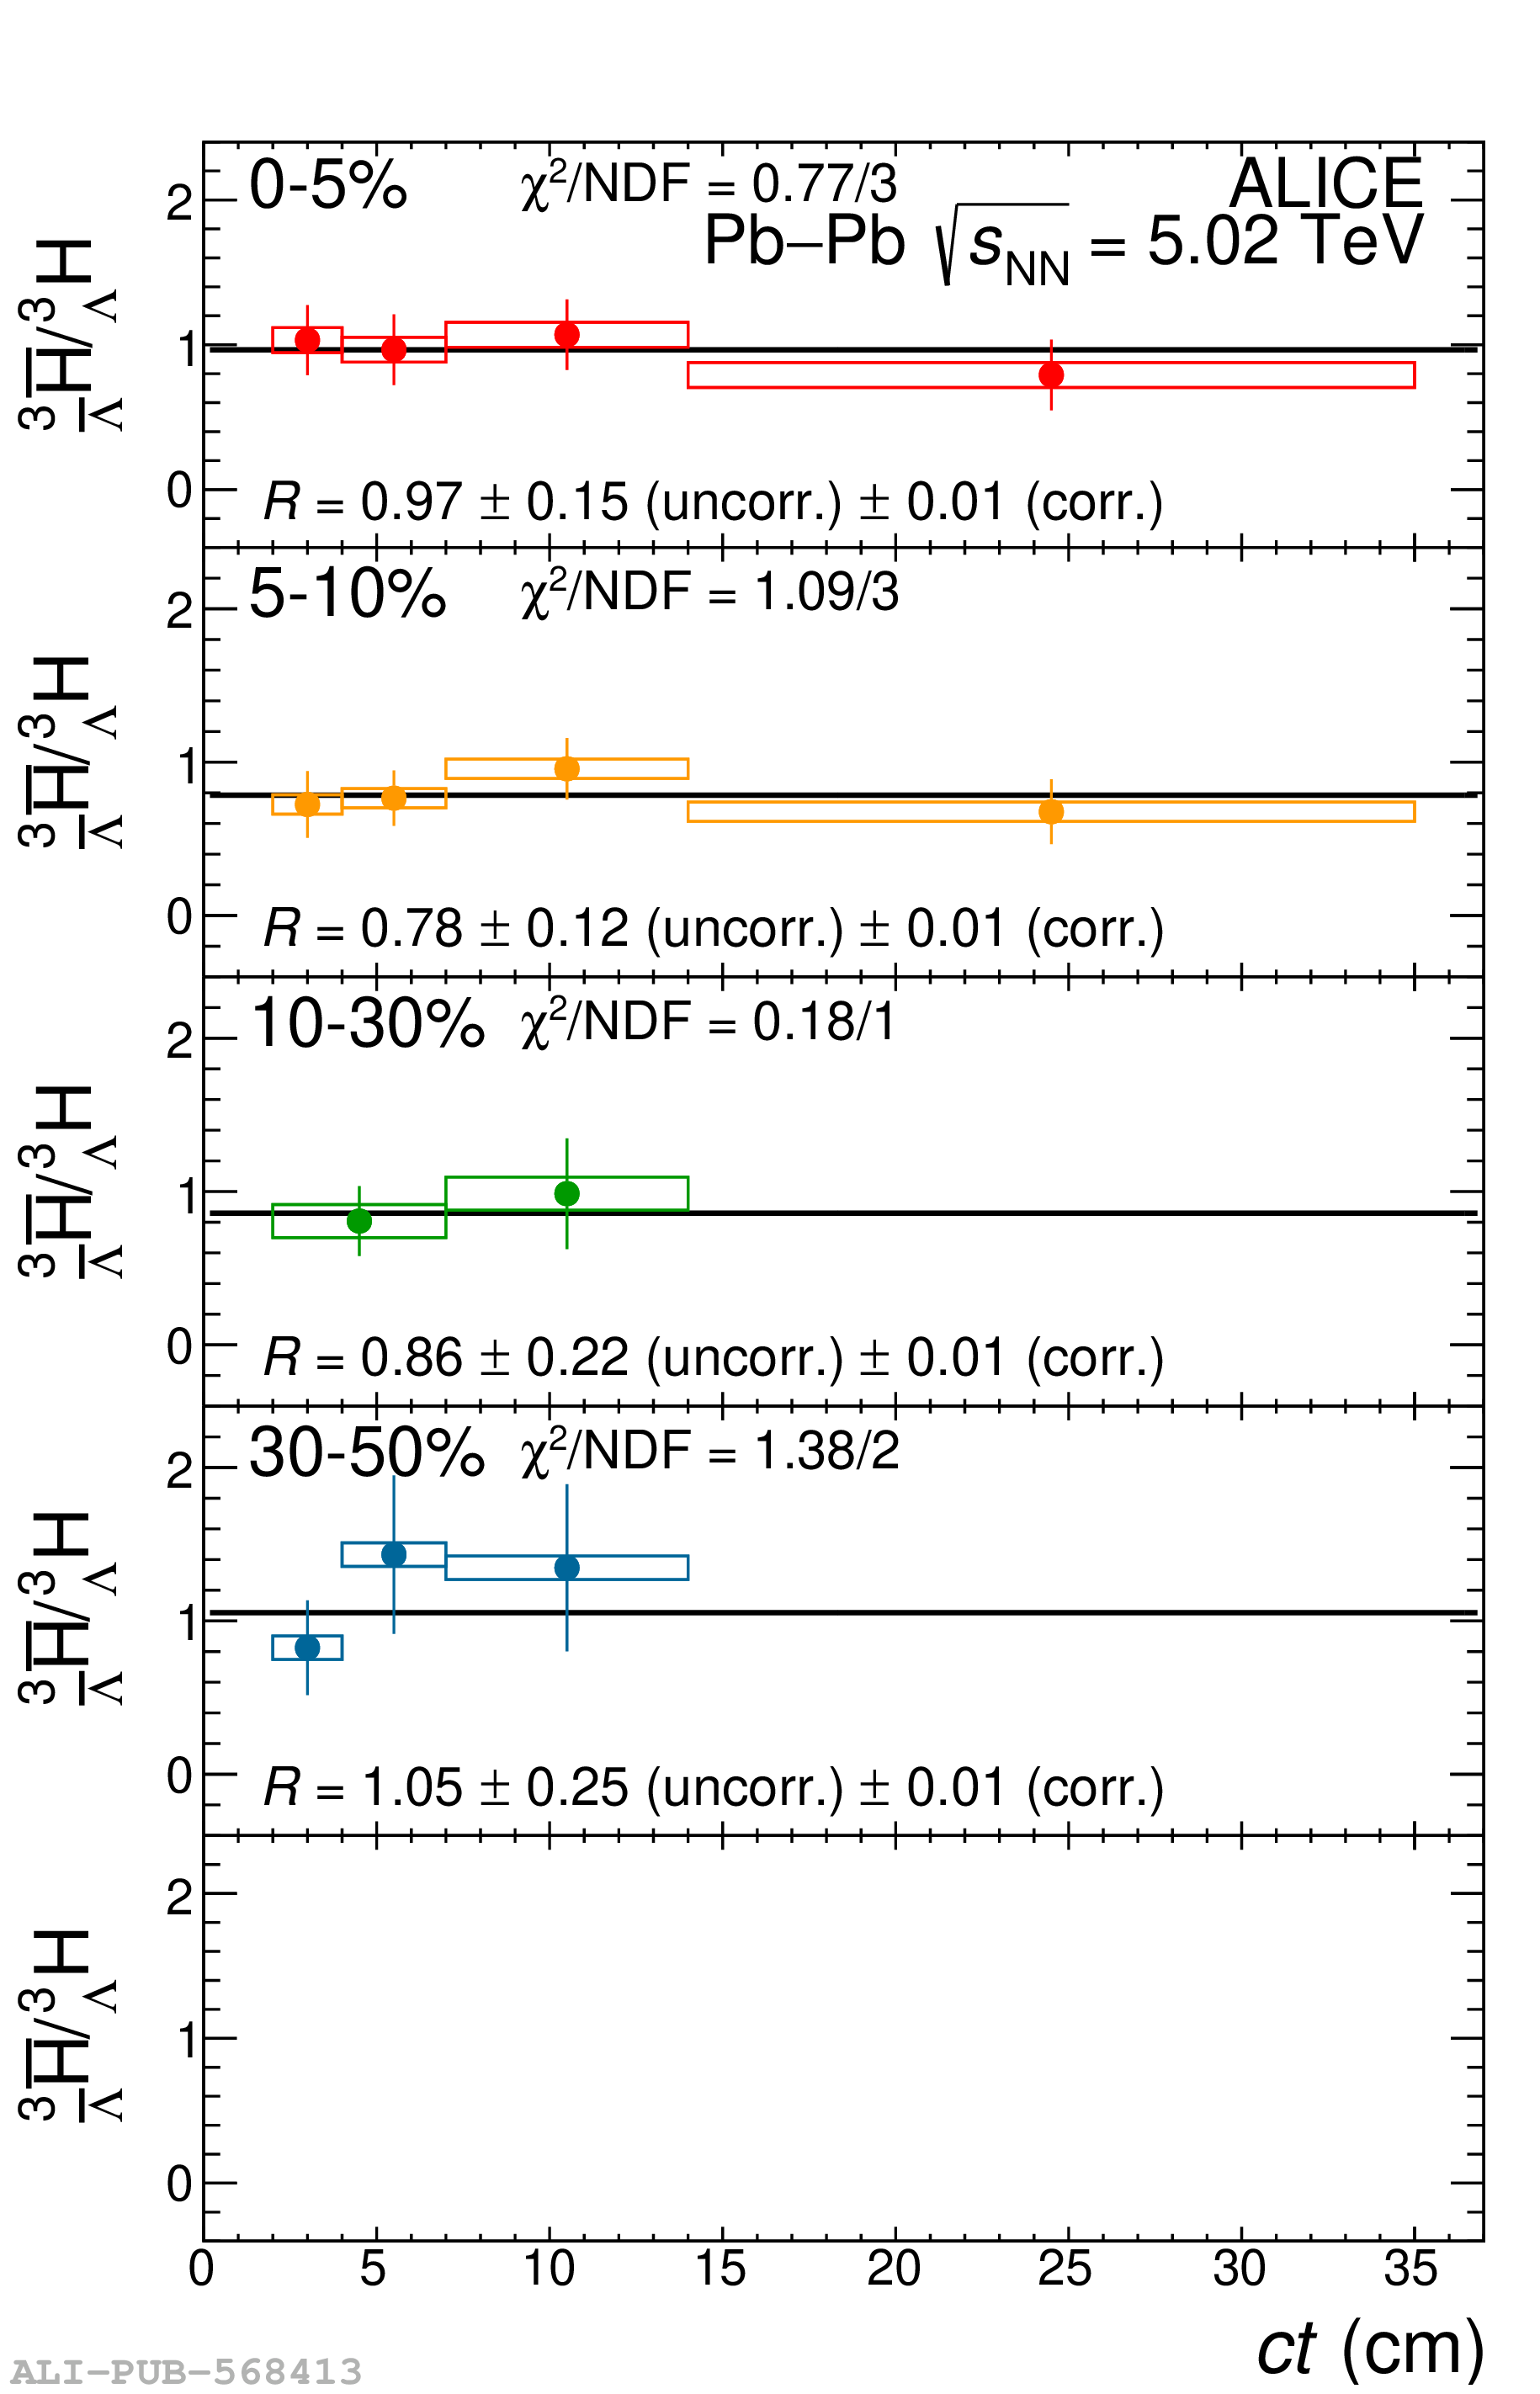 |
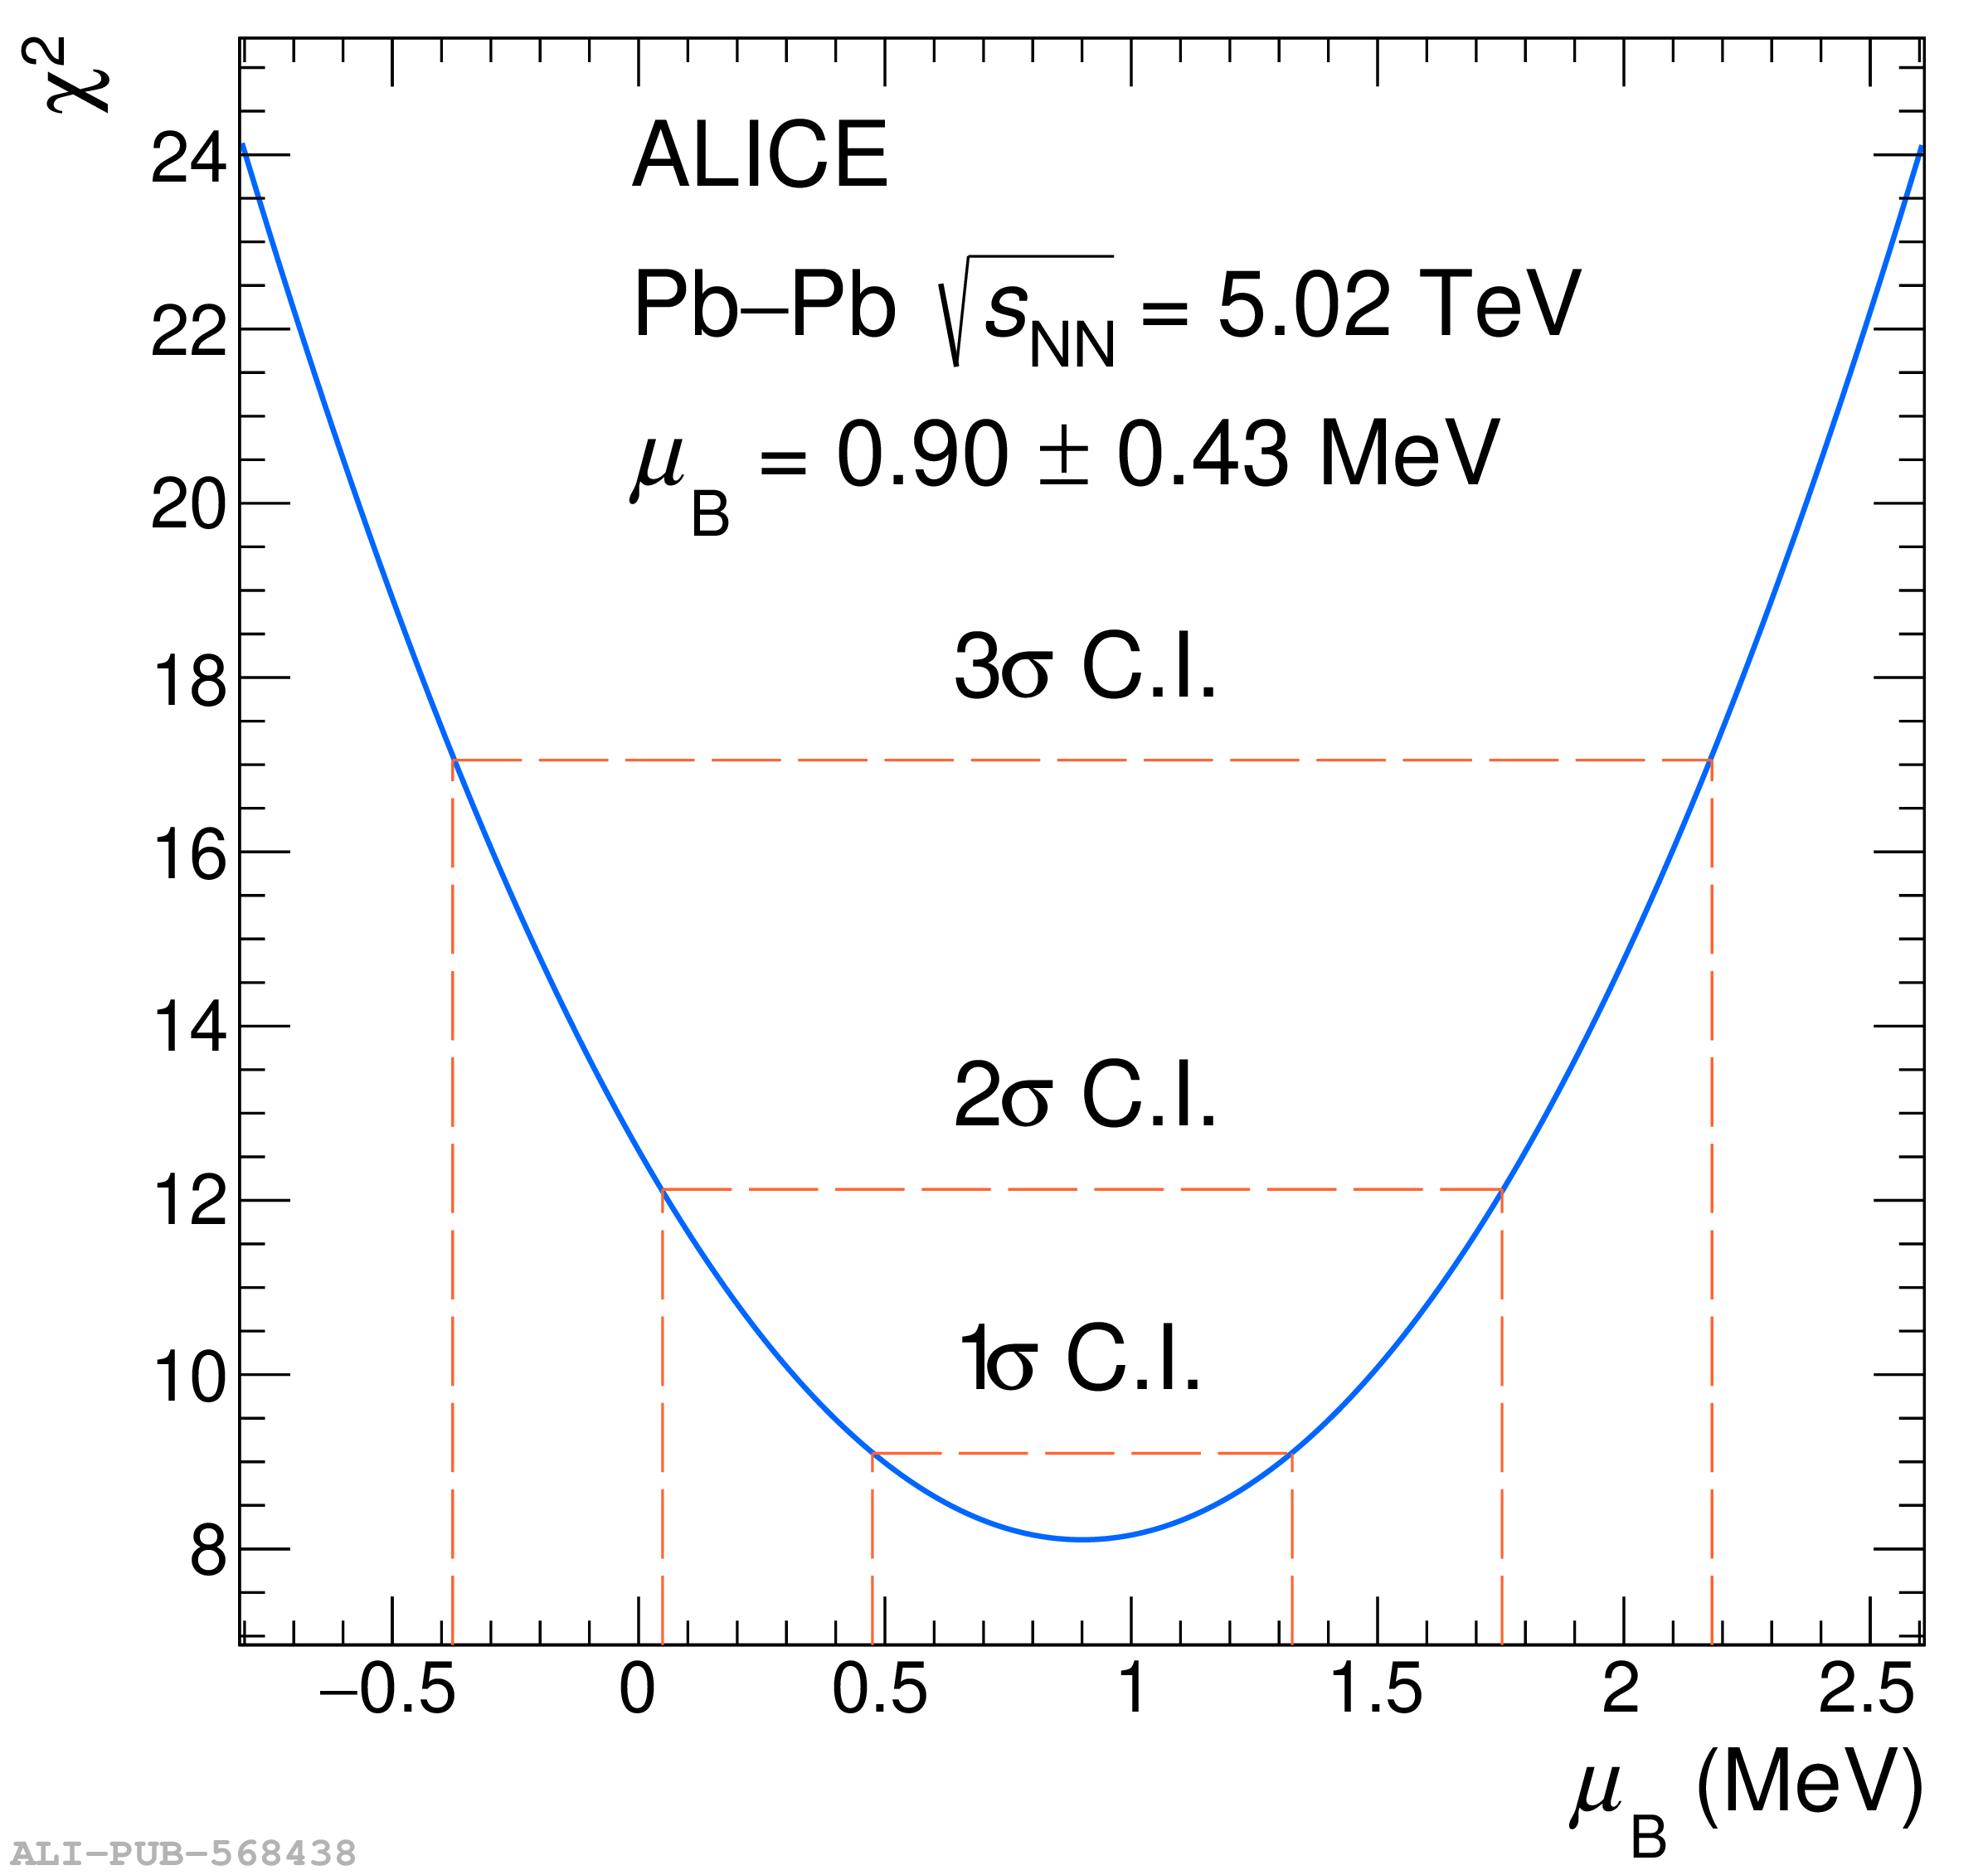
Figure A.3
Profiles of the $\chi^{2}$ variable minimized in the fit of $\mu_B$ (left) and $\mu_Q$ (right) obtained with the Thermal-FIST model . The values obtained from the minimization, as well as the $1\sigma$, $2\sigma$, and $3\sigma$ confidence intervals, are reported in the figures. | 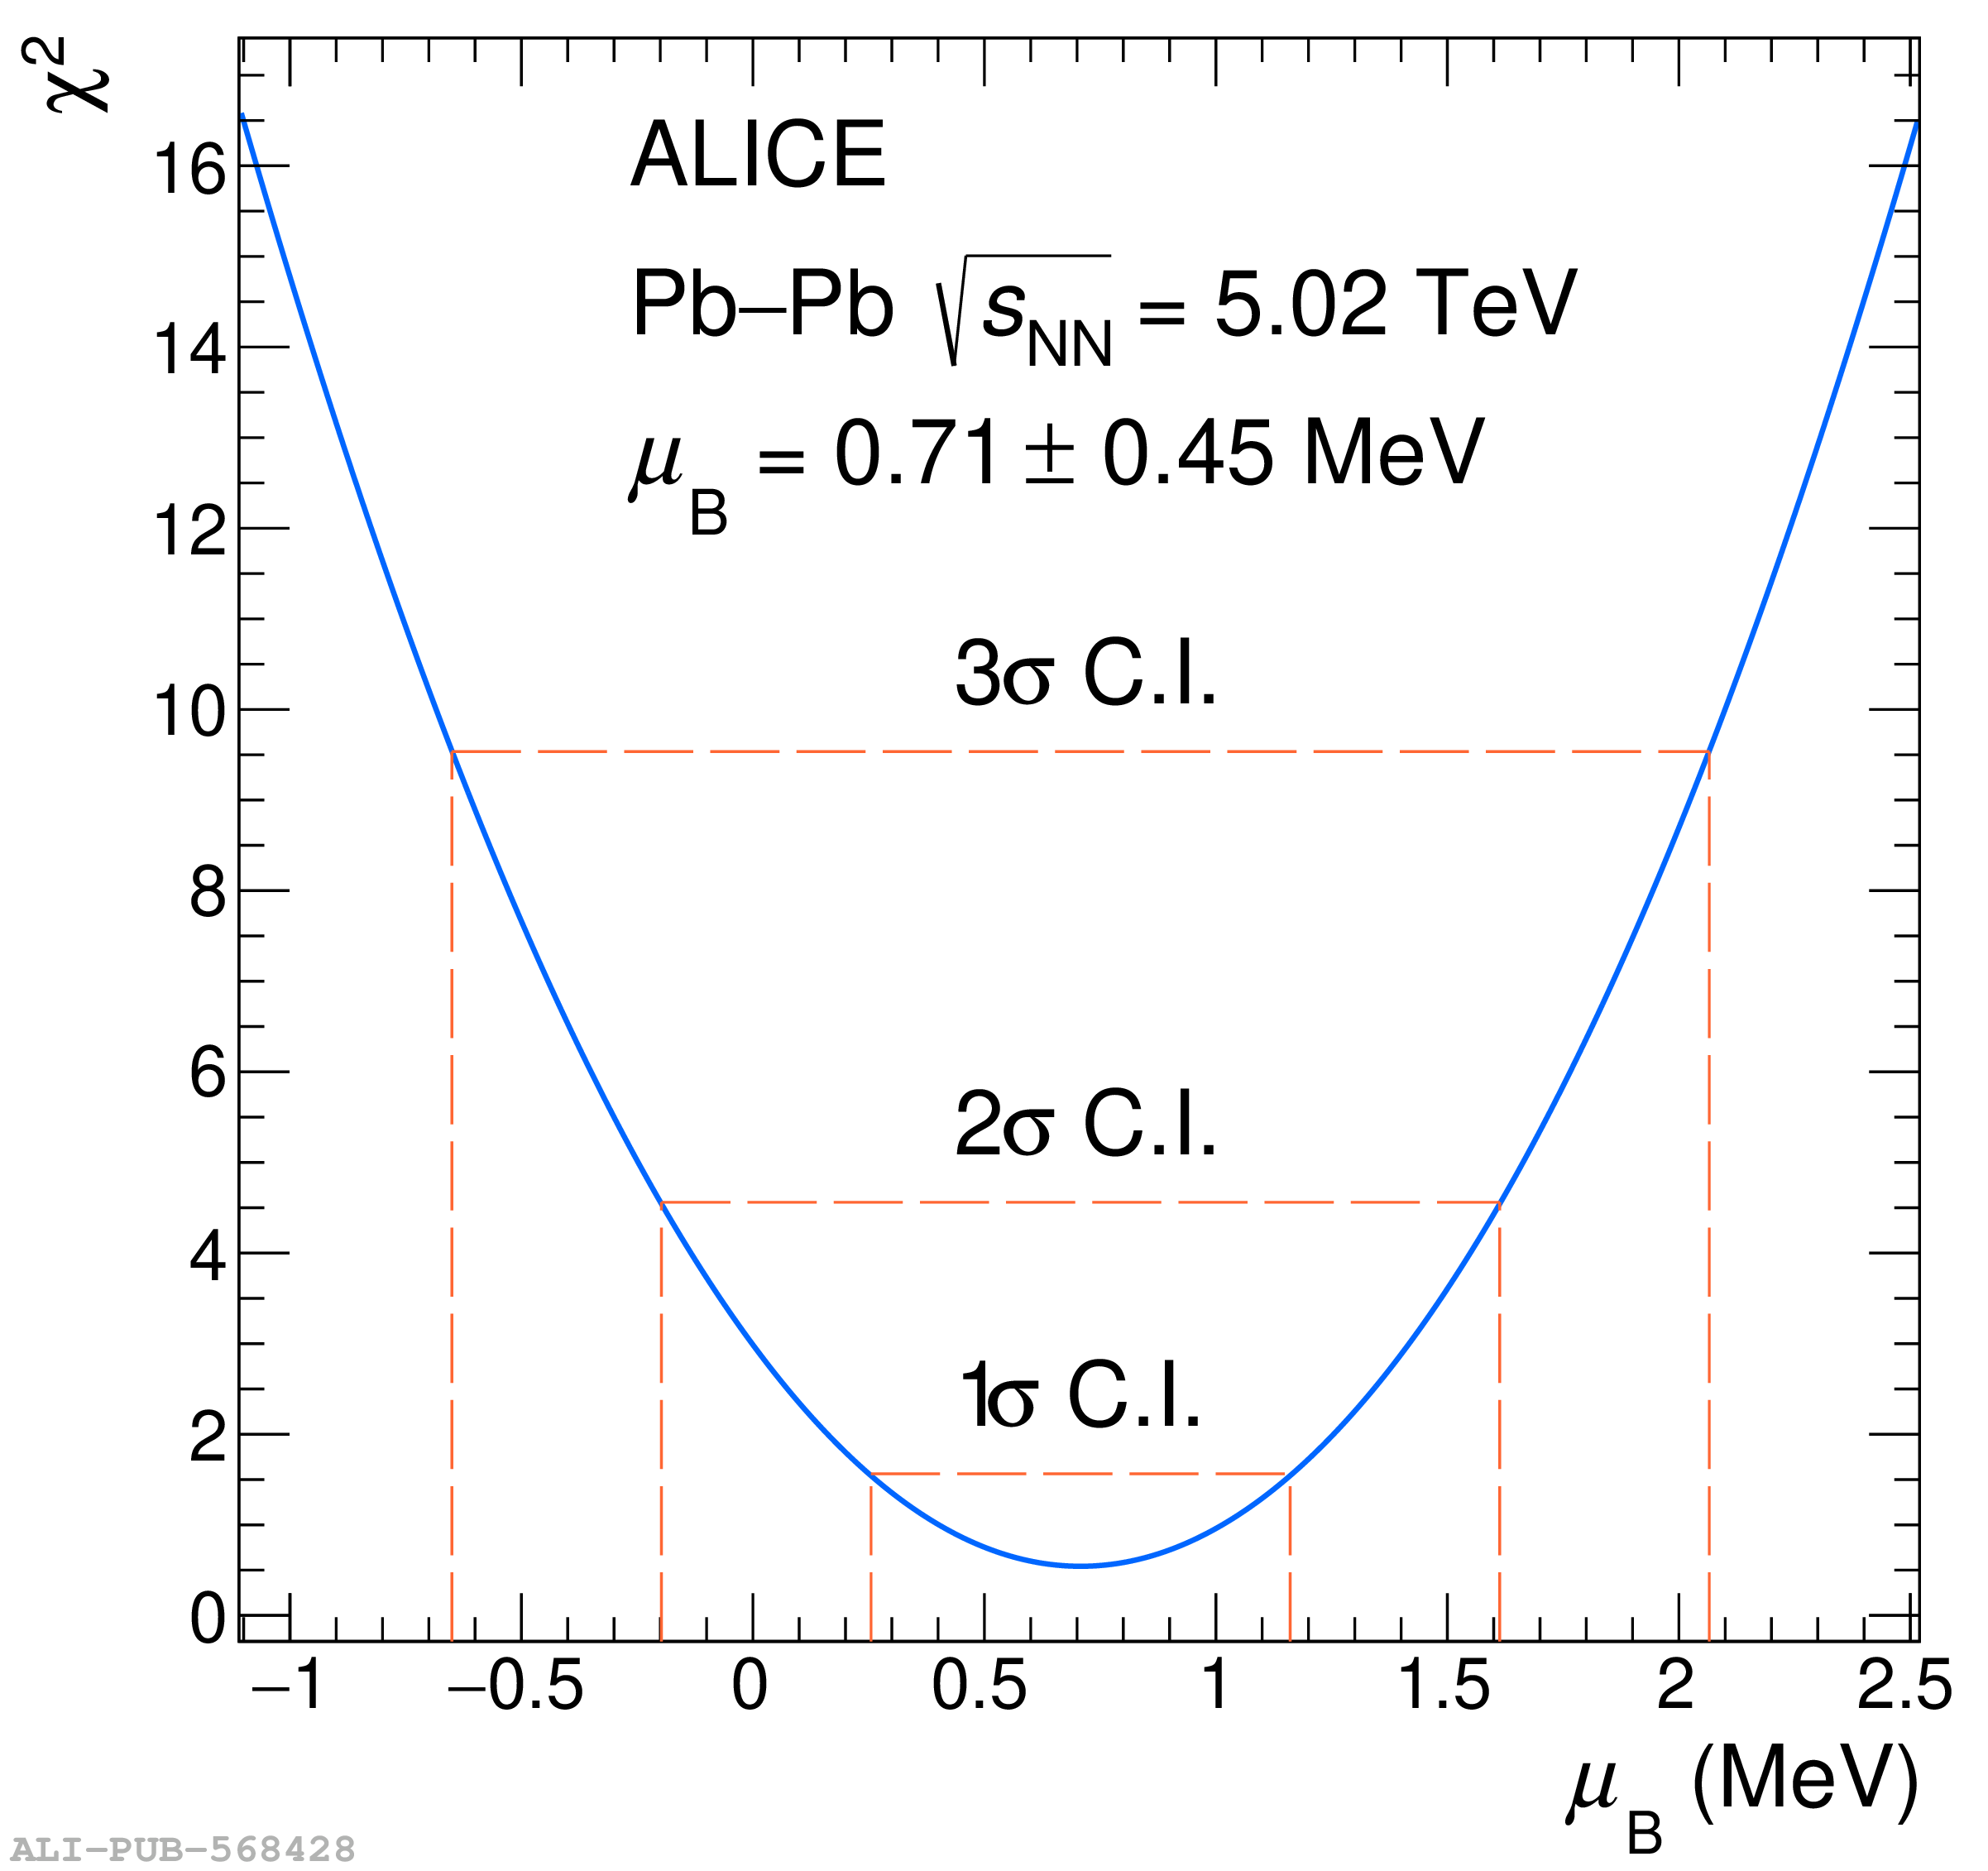 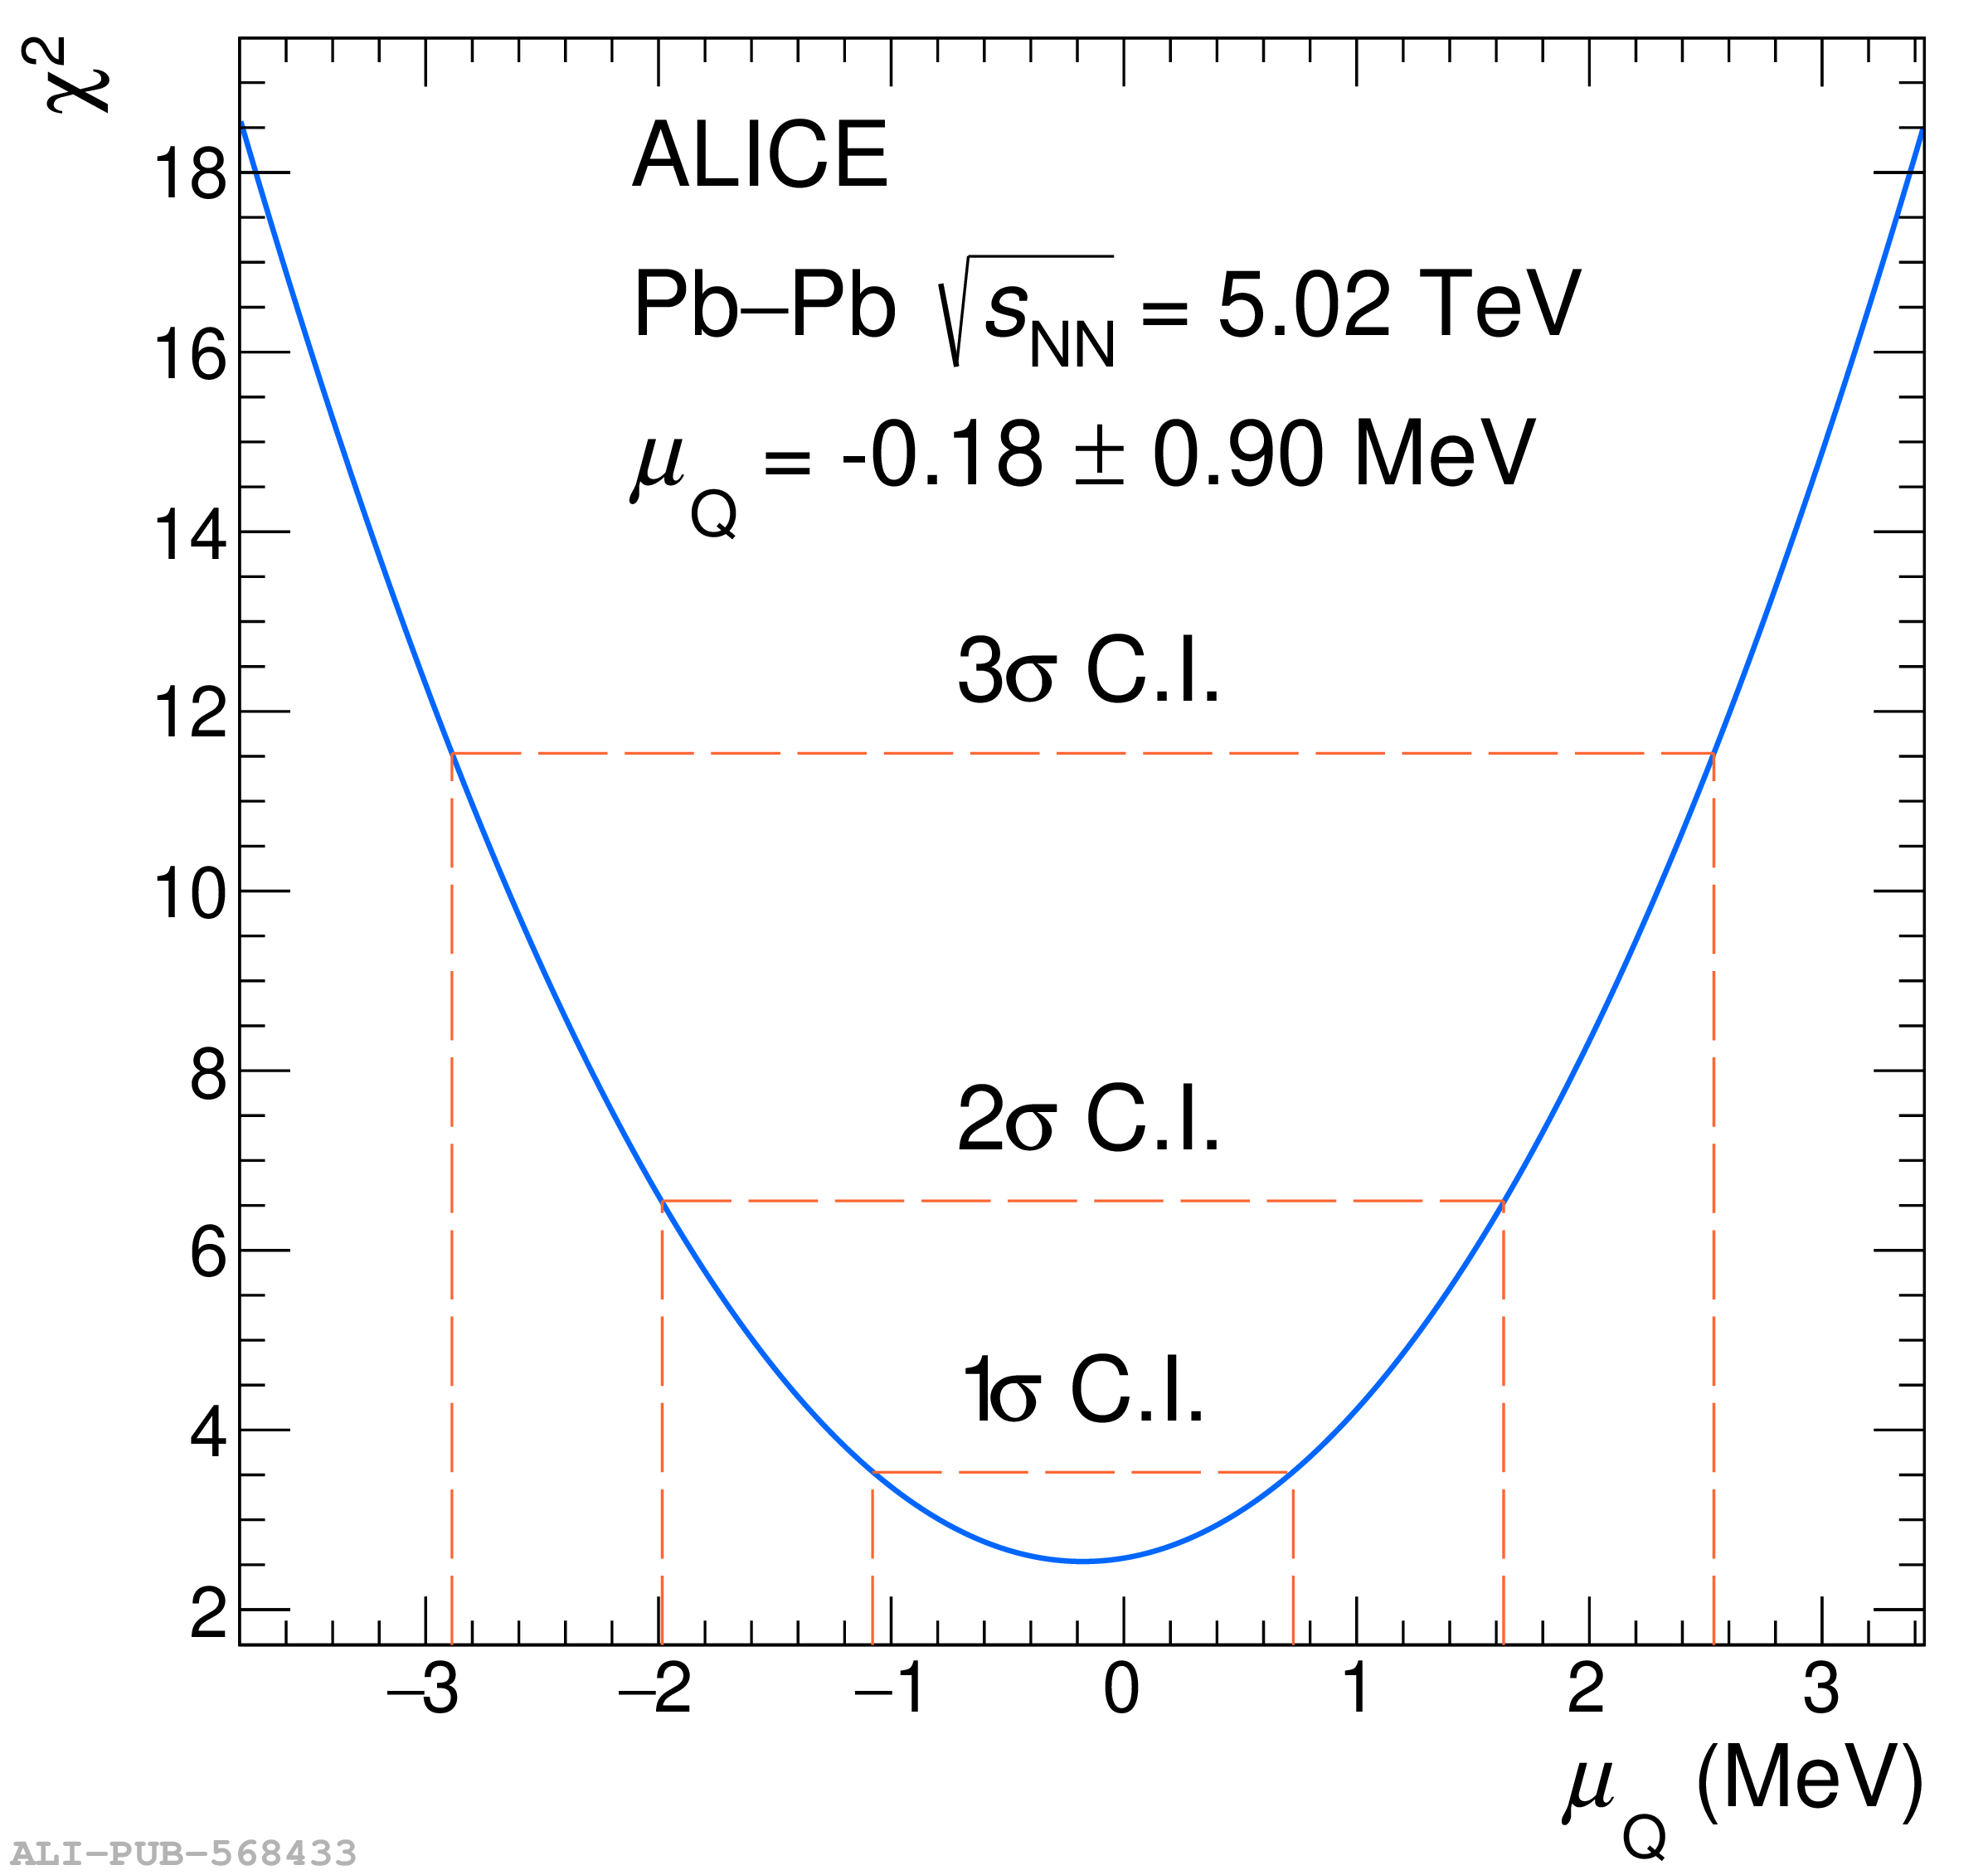 |