Upper panels: statistical hadronization model fits to the measured antiparticle-to-particle yield ratios in different centrality intervals. Error bars show the sum in quadrature of statistical and centrality-uncorrelated systematic uncertainties. When not visible, error bars are hidden by the marker. Lower panels: pull distribution, defined as the difference between data and fit values, normalized to the uncertainty in the data. | 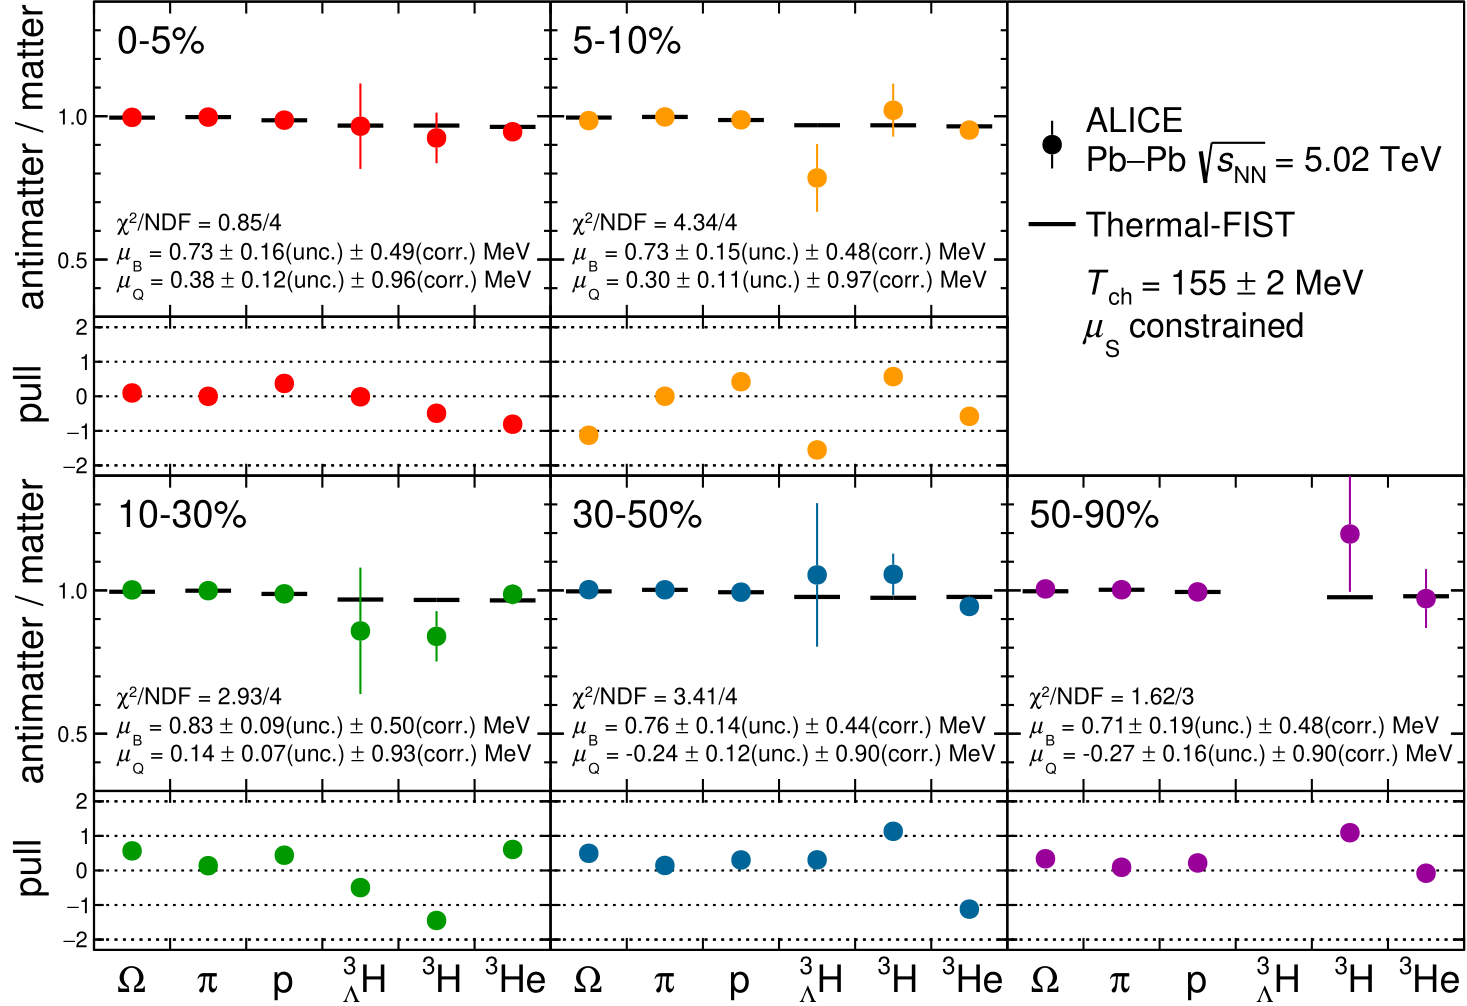 |