Differential cross section of coherent ${\rm K^+K^-}$ photoproduction as a function $\it{M_\mathrm{KK}}$ in Pb$-$Pb UPCs at $\sqrt{s_{\rm NN}}$ = 5.02 TeV in $|y_\mathrm{KK}|\ <\ 0.8$. The lines and boxes along the data points represent statistical and systematic uncertainties, respectively. The green solid line presents the best fit result of $|B_{\rm{KK}}/A_{\phi}|=0.28$ $({\rm GeV}/c^2)^{-1/2}$ and $\varphi$ = 0.06 rad together with the 1$\sigma$ bounds of the fit in a green band. The blue dashed curve shows the best fit with $|B_{\pi\pi}/A_{\rho}|=0.54$ $({\rm GeV}/c^2)^{-1/2}$ and $\varphi$ = 1.46 rad (the best-fit values for $\rho$ plus direct $\pi^+\pi^-$) . The black dotted line represents the curves under the hypothesis of $|B_{\rm{KK}}/A_{\phi}|=0$, showing only the $\phi (1020)\rightarrow {\rm K^+K^-}$ contribution. The grey band indicates the impact of the systematic uncertainty from the $\phi (1020)$ meson cross section, showing a 25% variation. | 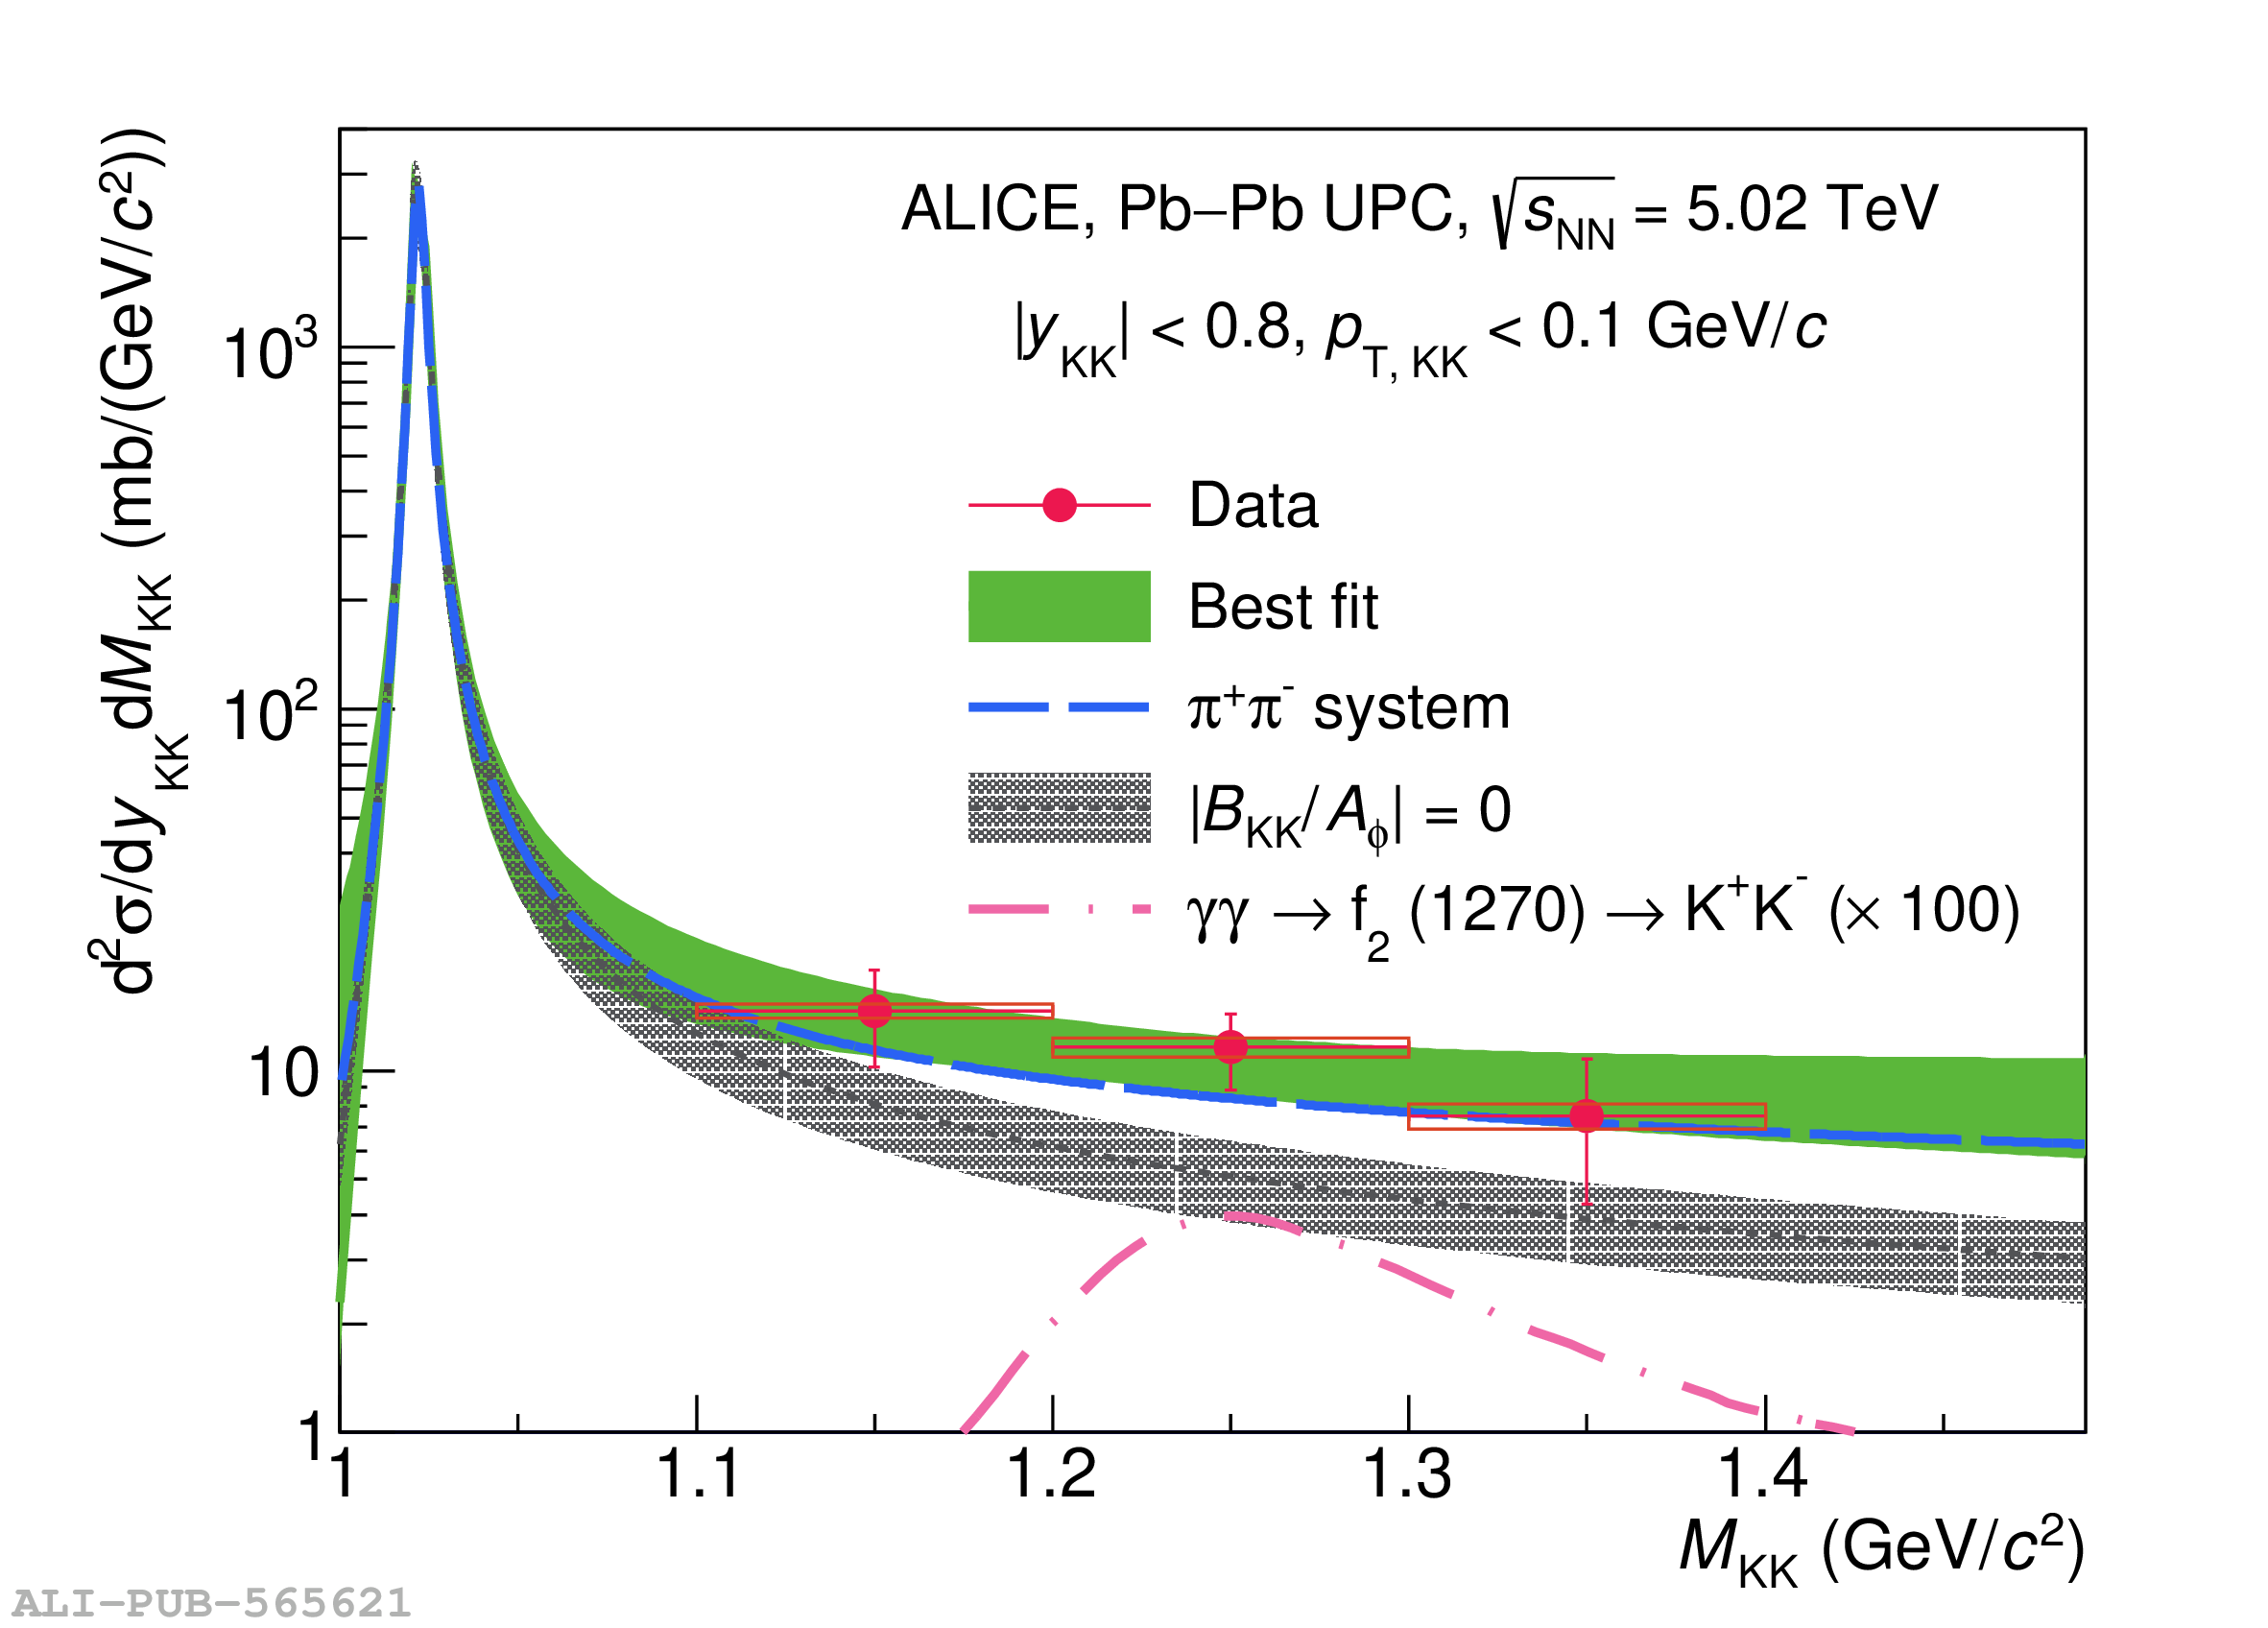 |