K$^{+}$K$^{-}$ pairs may be produced in photonuclear collisions, either from the decays of photoproduced $\phi (1020)$ mesons, or directly as non-resonant K$^{+}$K$^{-}$ pairs. Measurements of K$^{+}$K$^{-}$ photoproduction probe the couplings between the $\phi (1020)$ and charged kaons with photons and nuclear targets. The kaon$-$proton scattering occurs at energies far above those available elsewhere. We present the first measurement of coherent photoproduction of K$^{+}$K$^{-}$ pairs on lead ions in ultra-peripheral collisions using the ALICE detector, including the first investigation of direct K$^{+}$K$^{-}$ production. There is significant K$^{+}$K$^{-}$ production at low transverse momentum, consistent with coherent photoproduction on lead targets. In the mass range $1.1 <~ M_{\rm{KK}} <~ 1.4$ GeV/$c^2$ above the $\phi (1020)$ resonance, for rapidity $|y_{\rm{KK}}|<~0.8$ and $p_{\rm T,KK} <~ 0.1$ GeV/$c$, the measured coherent photoproduction cross section is $\mathrm{d}\sigma/\mathrm{d}y$ = 3.37 $\pm\ 0.61$ (stat.) $\pm\ 0.15 $ (syst.) mb. The center-of-mass energy per nucleon of the photon-nucleus (Pb) system $W_{\gamma \mathrm{Pb, n}}$ ranges from 33 to 188 GeV, far higher than previous measurements on heavy-nucleus targets. The cross section is larger than expected for $\phi (1020)$ photoproduction alone. The mass spectrum is fit to a cocktail consisting of $\phi (1020)$ decays, direct K$^{+}$K$^{-}$ photoproduction, and interference between the two. The confidence regions for the amplitude and relative phase angle for direct K$^{+}$K$^{-}$ photoproduction are presented.
Phys. Rev. Lett. 132 (2024) 222303
HEP Data
e-Print: arXiv:2311.11792 | PDF | inSPIRE
CERN-EP-2023-248
Figure group
Figure 1
Differential cross section as a function of $\it{p}_{\rm{T, KK}}^{\rm{2}}$ for exclusive ${\rm K^+ K^-}$ photoproduction in Pb$-$Pb UPCs at $\sqrt{s_{\rm{NN}}}$= 5.02 TeV and $|y_{\rm{KK}}|<0.8$. The vertical lines and boxes across the data points represent statistical and systematic uncertainties, respectively. The dashed blue line and band are the result of a fit to an exponential with the fixed slope parameter $b=428\ \pm\ 6\ ({\rm stat.})\ \pm\ 15\ ({\rm syst.})$ $({\rm GeV}/c)^{-2}$, from a previous result on $\rho^{0}$ production (see the text for details). The inset shows two curves from STARlight with and without interference between the two photon directions . | 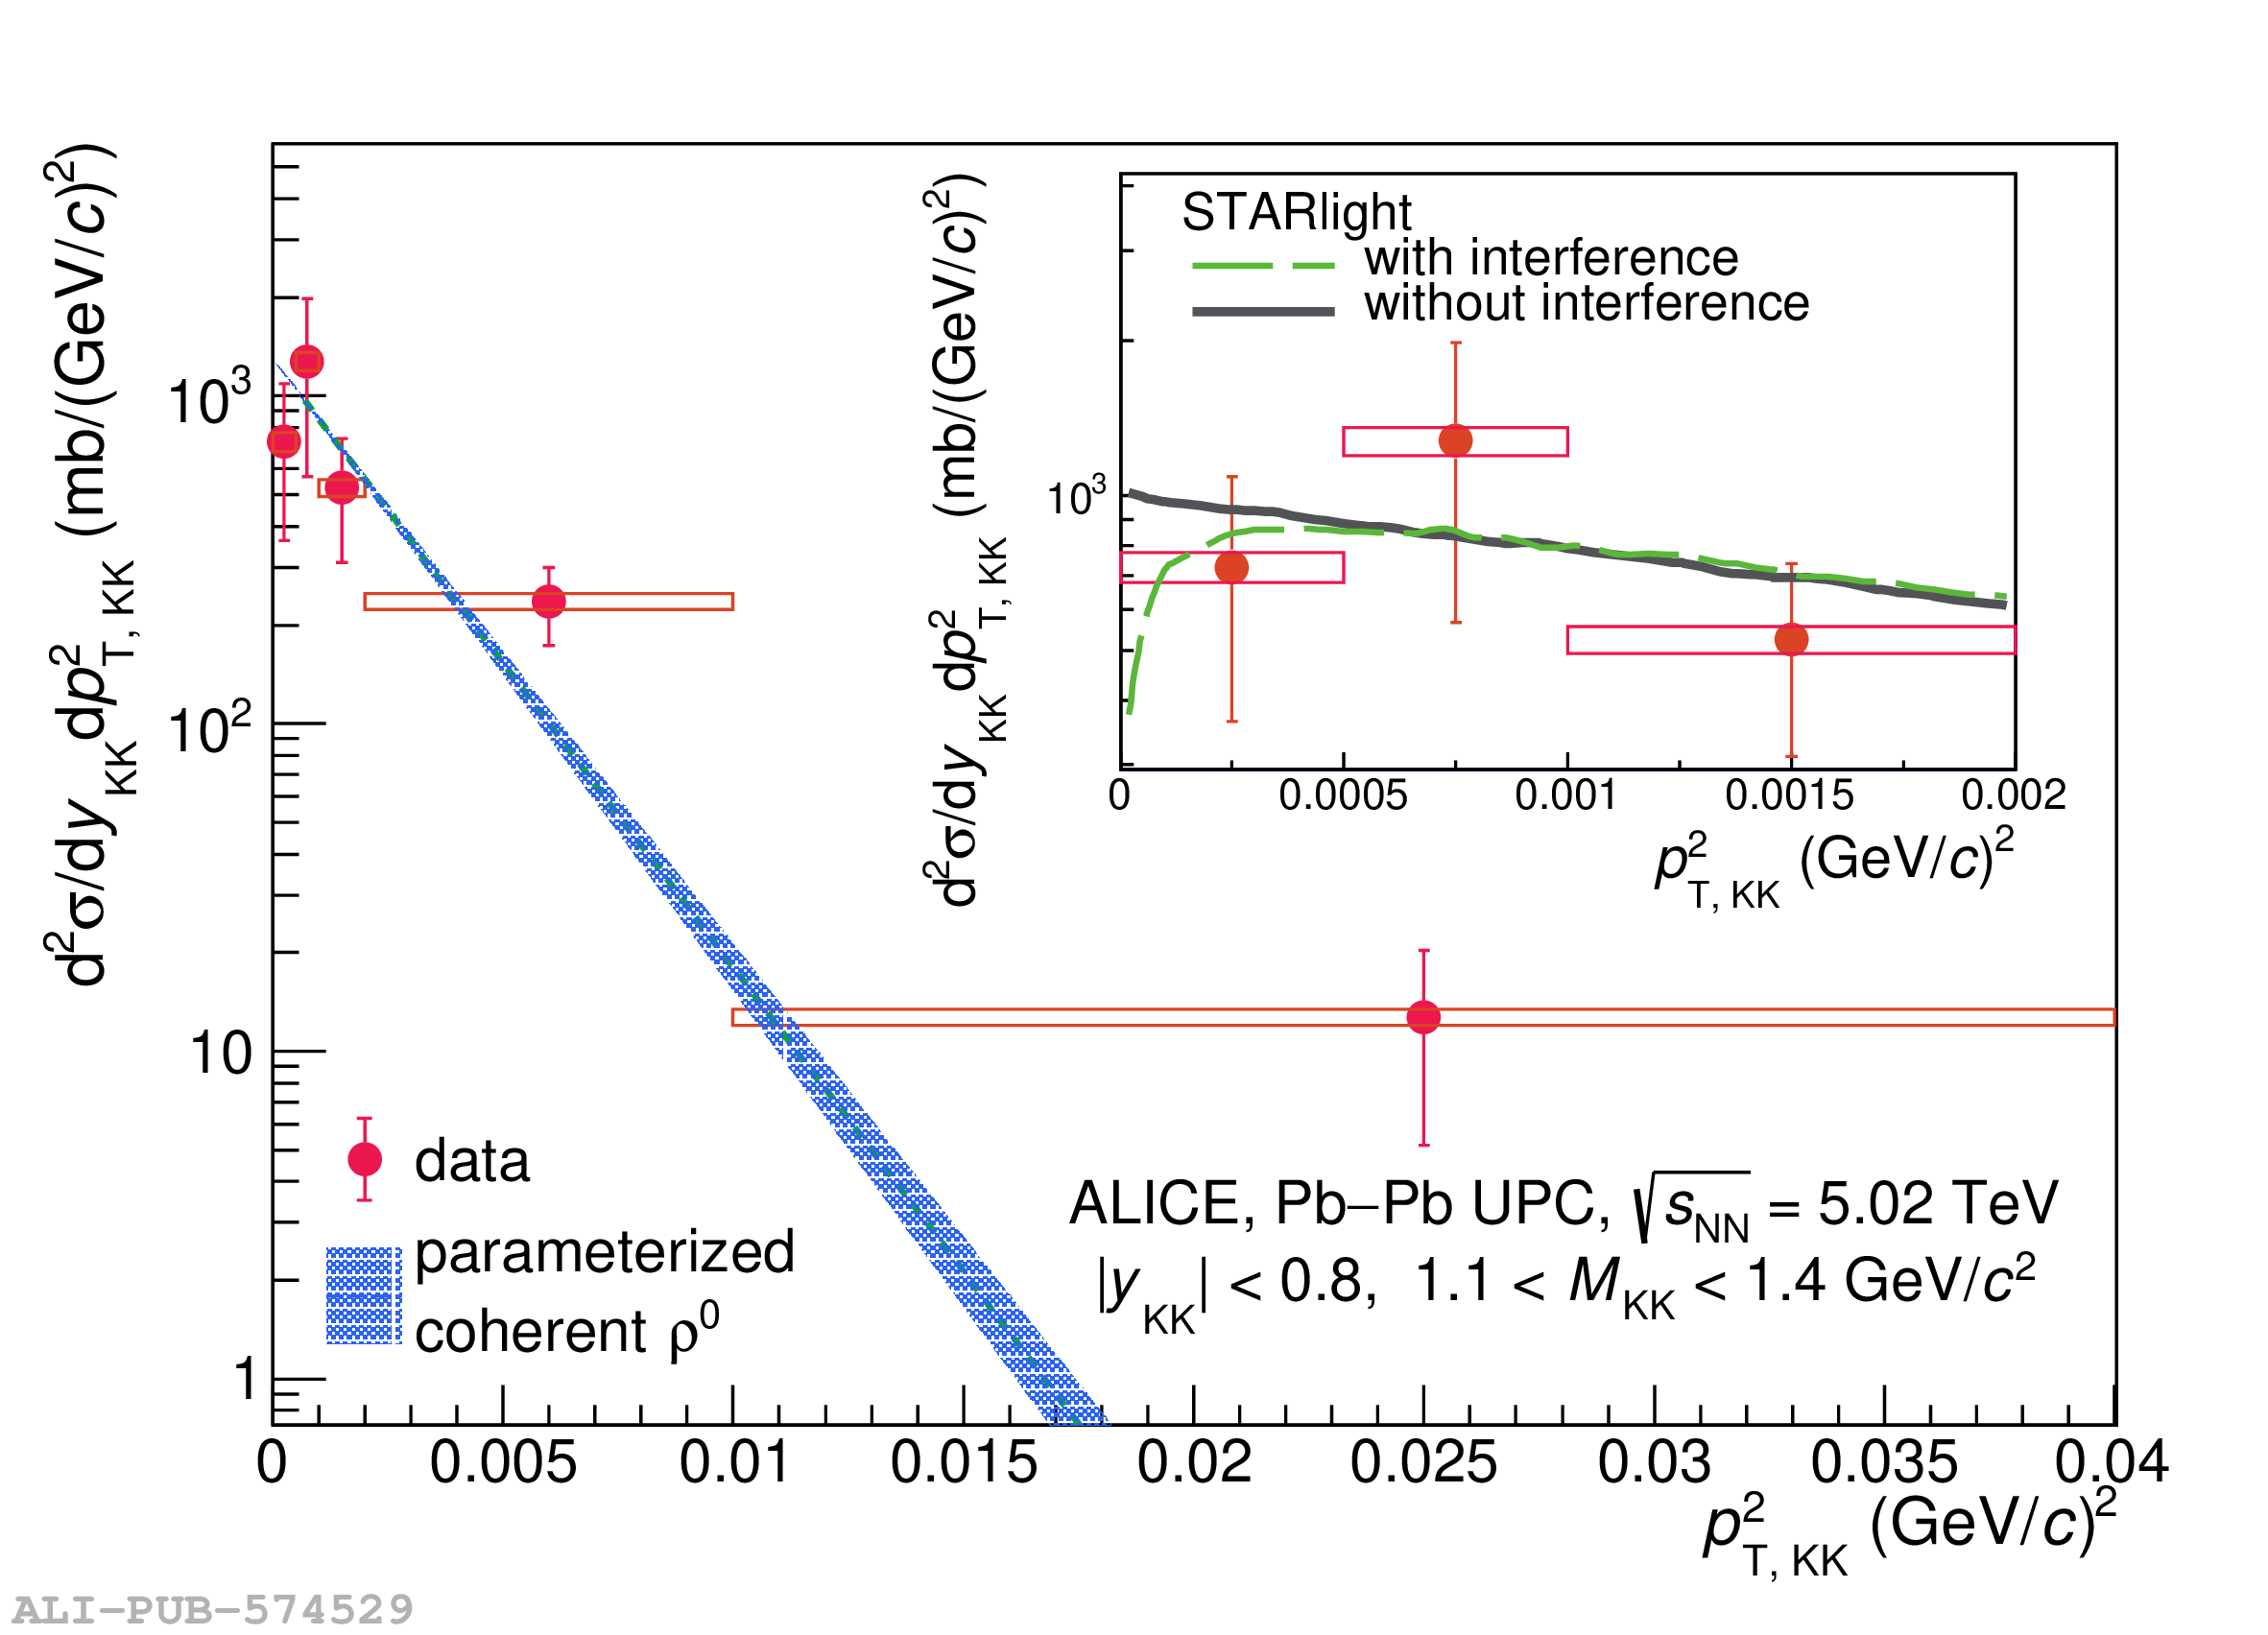 |
Figure 2
Differential cross section of coherent ${\rm K^+ K^-}$ photoproduction as a function $\it{M_\mathrm{KK}}$ in Pb$-$Pb UPCs at $\snn$ = 5.02 TeV in $|y_\mathrm{KK}|\ <\ 0.8$. The vertical lines and boxes along the data points represent statistical and systematic uncertainties, respectively. The green solid line presents the best fit result of $|B_{\rm{KK}}/A_{\phi}|=0.28\;({\rm GeV}/c^2)^{-1/2}$ and $\varphi$ = 0.06 rad together with the 1$\sigma$ bounds of the fit in a green band. The blue dashed curve shows the best fit with $|B_{\pi\pi}/A_{\rho}|=0.54\;({\rm GeV}/c^2)^{-1/2}$ and $\varphi$ = 1.46 rad (the best-fit values for $\rho$ plus direct $\pi^+\pi^-$) . The black dotted line represents the curves under the hypothesis of $|B_{\rm{KK}}/A_{\phi}|=0$, showing only the $\phi (1020)\rightarrow {\rm K^+ K^-}$ contribution. The gray band indicates the impact of the systematic uncertainty from the $\phi (1020)$ meson cross section, showing a 25$\%$ variation. |  |
Figure 3
Confidence regions for the relative fraction of direct ${\rm K^+ K^-}$ contribution with respect to the amplitude of $\phi (1020) \rightarrow$ ${\rm K^+ K^-}$ ($|B_{\rm{KK}}/A_{\phi}|$) and the relative phase angle between $\phi(1020)\rightarrow {\rm K^+ K^-}$ and direct ${\rm K^+ K^-}$ ($\varphi$). The best fit is shown as a red dot at $|B_{\rm{KK}}/A_{\phi}|=0.28\; ({\rm GeV}/c^2)^{-1/2}$ and $\varphi = $ 0.06 rad found with $\chi^{2}/\rm{ndf_{best\ fit}} = 0.3$, while a pink square at the $|B_{\pi\pi}/A_{\rho}|=0.54\ \pm\ 0.01$ (stat.) $\pm\ 0.02 $ (syst.) $({\rm GeV}/c^2)^{-1/2}$ and relative phase angle $\varphi = 1.46\ \pm\ 0.11$ (stat.) $\pm\ 0.07 $ (syst.) rad indicates the best-fit values for $\rho$ plus direct $\pi^+\pi^-$. The green solid line and blue dashed line represent the boundary of 68% and 95% confidence regions, respectively. | 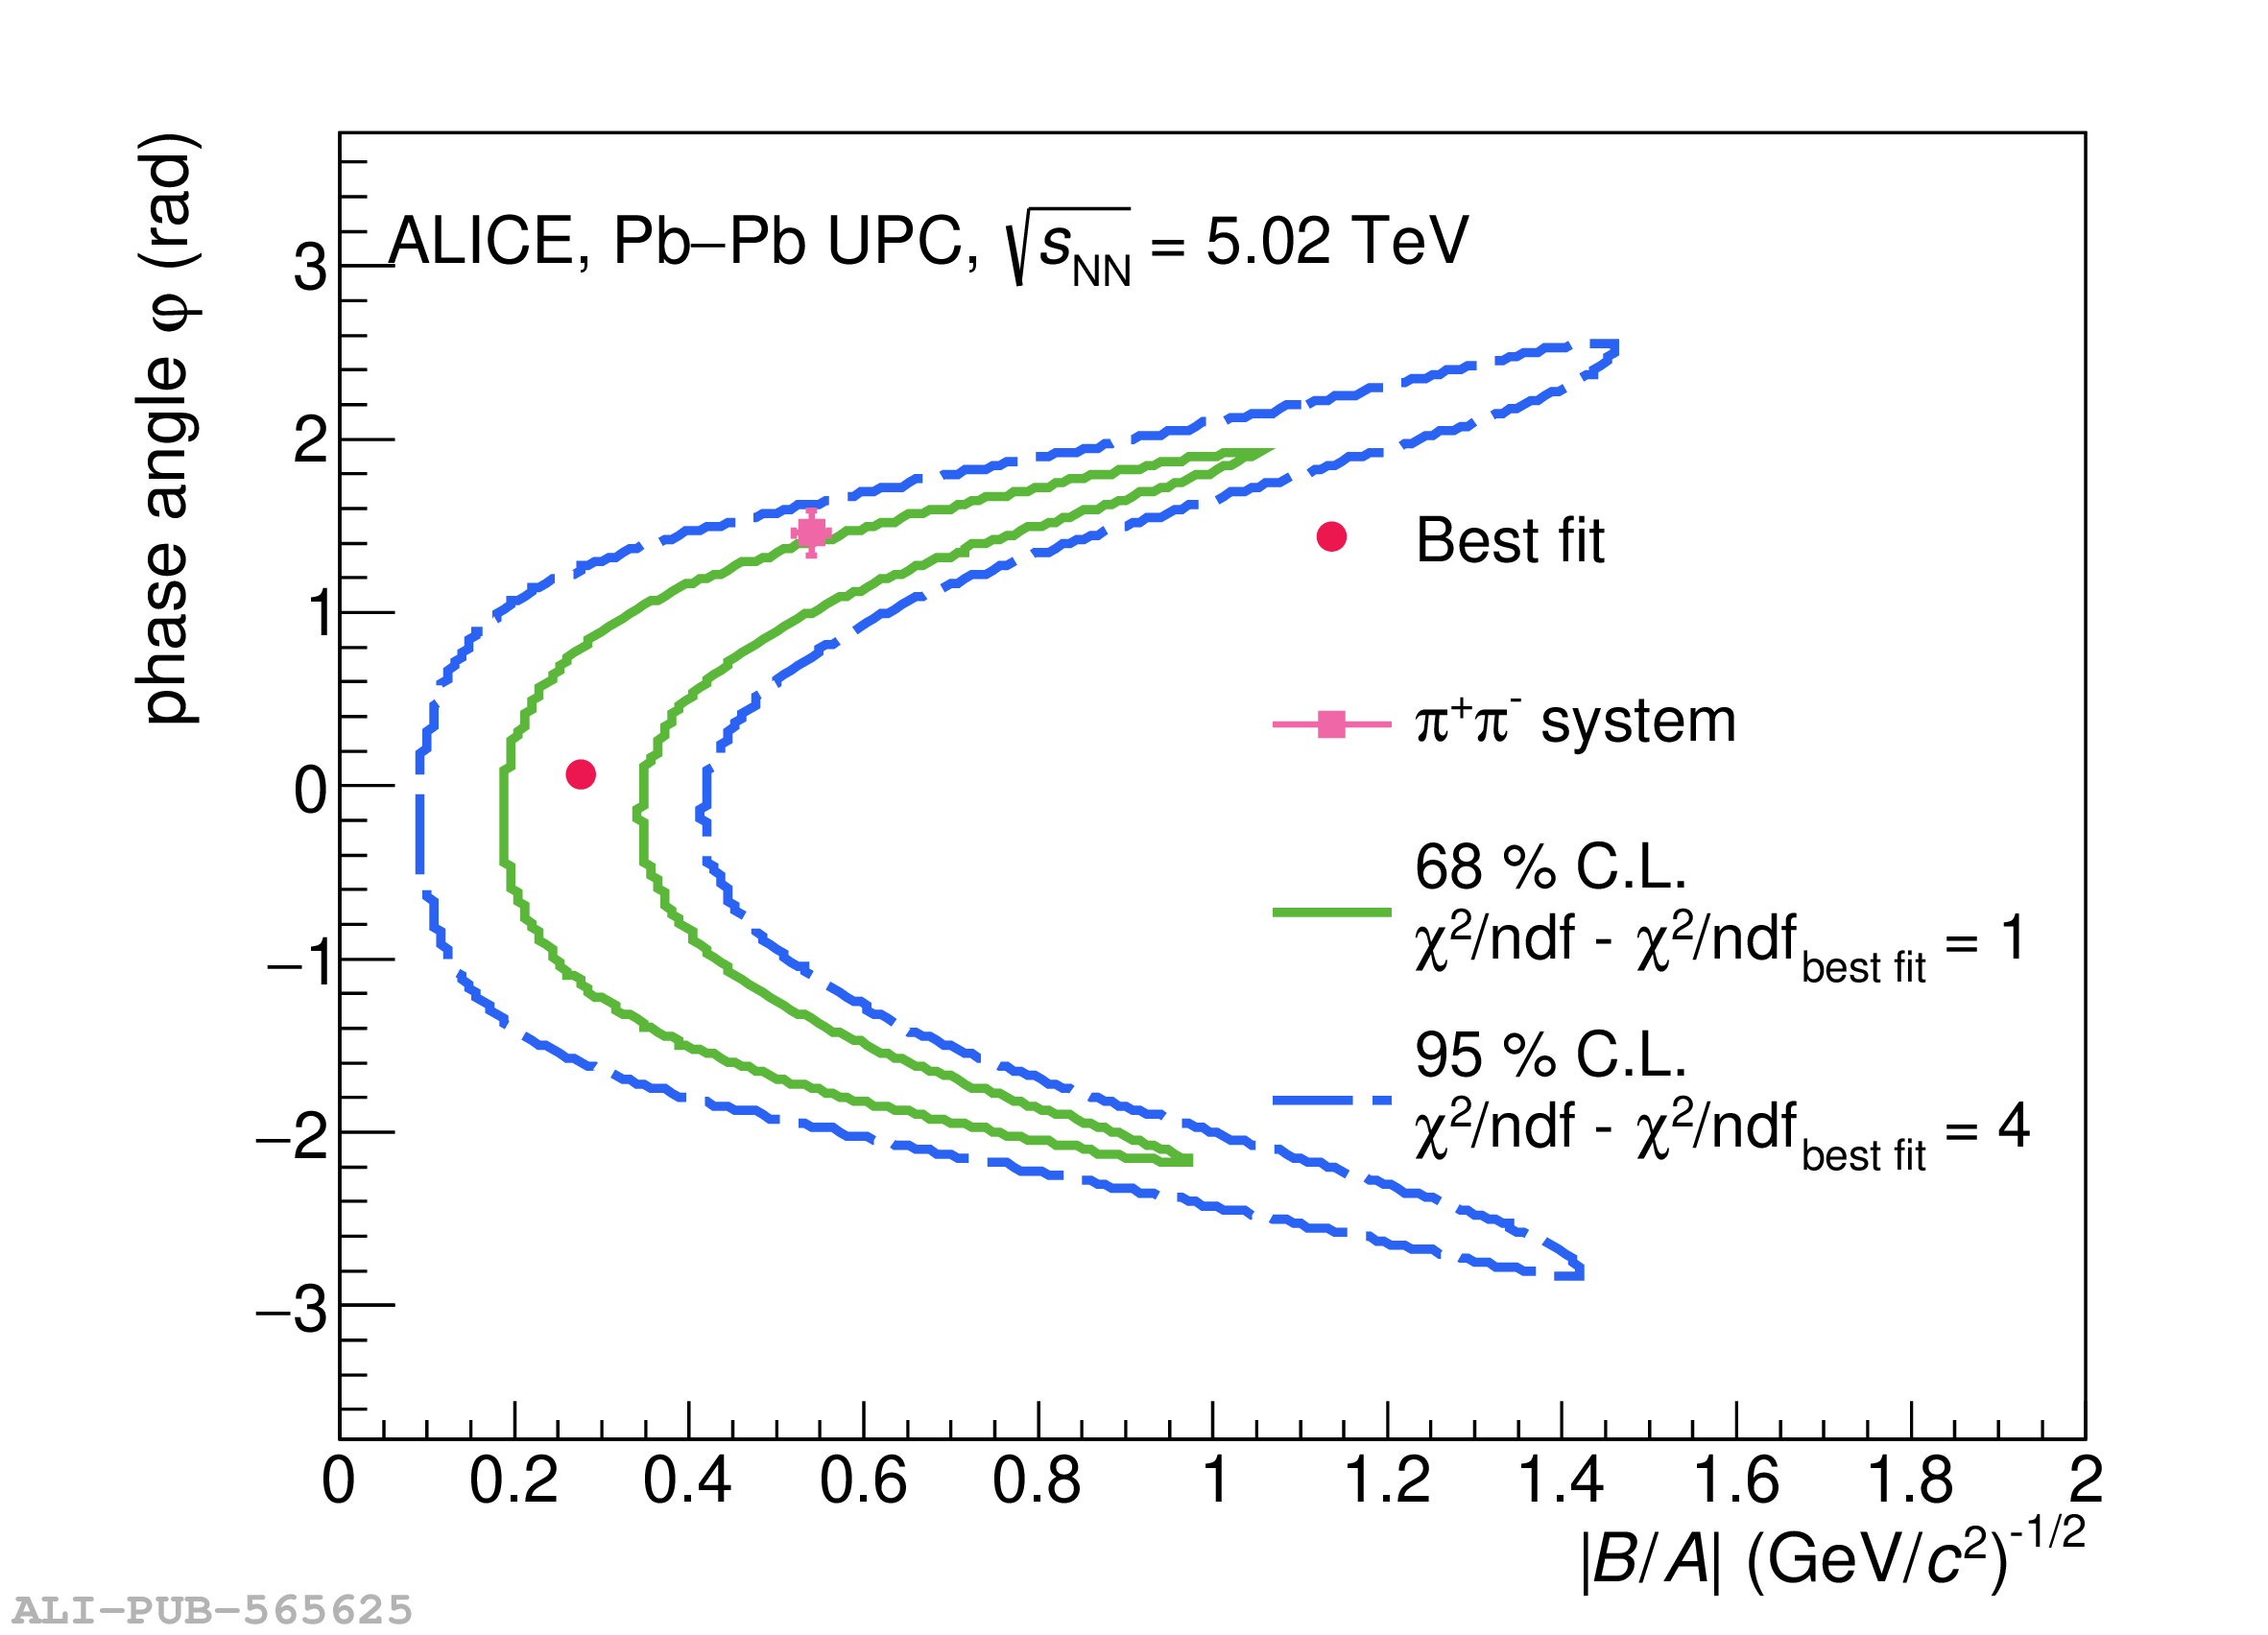 |