p/\PI, \LA/$K$ and \XI/\PHI ratios for different \SOPT classes are obtained for $0-1\%$ events measured by the \tracklet Lower panels show the ratio to \SOPT-integrated event selection Statistical and total systematic uncertainties are shown by bars and boxes, respectively. The curves represent different model predictions of the same measurement. | 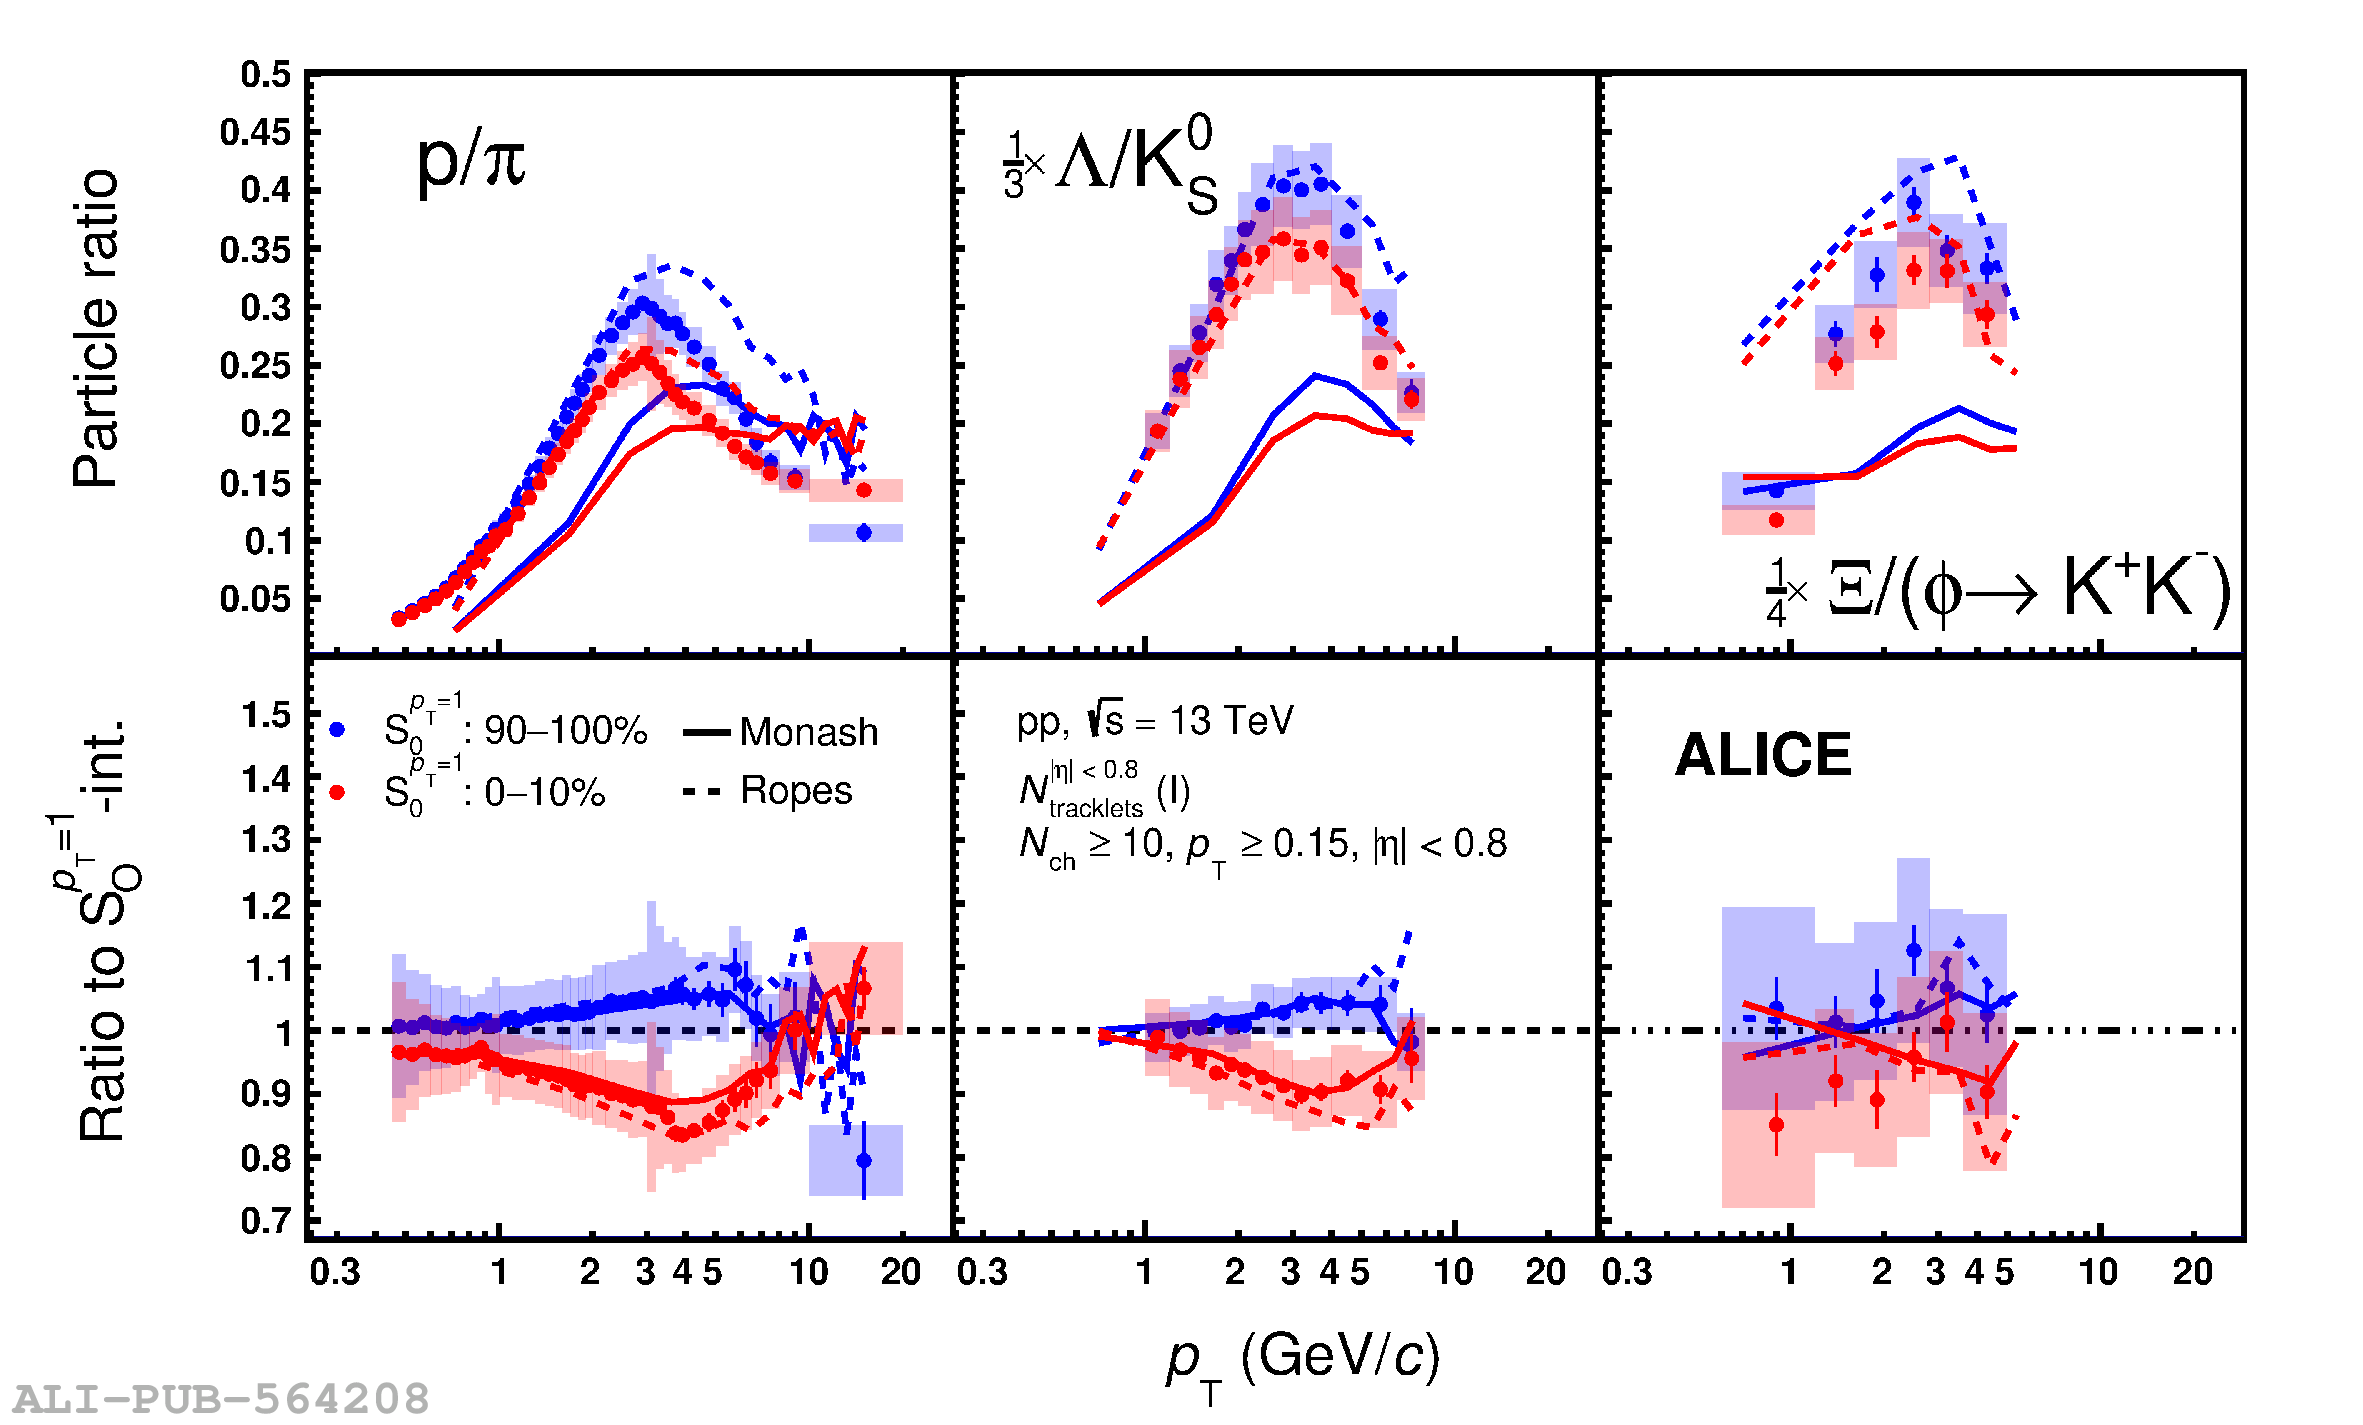 |