Top panels show hadron-to-\PI ratios for 0--1\% \SOPT classes selected for the 0--1\% \tracklet multiplicity events. Figure \ref{Fig:CombRatioPyEx} and Fig. \ref{Fig:CombRatioHerEx} both contain the same experimental data, but the vertical ranges are modified to accommodate the model predictions. Bottom panels present the hadron-to-\PI double ratios of \SOPT classes relative to \SOPT integrated high-multiplicity events. Statistical and systematic uncertainties are shown by bars and boxes, respectively. Data are compared with PYTHIA 8.2 Monash predictions, and the PYTHIA 8.2 rope hadronization framework. The large fluctuations present in the Herwig 7.2 predictions are due to statistical limitations. | 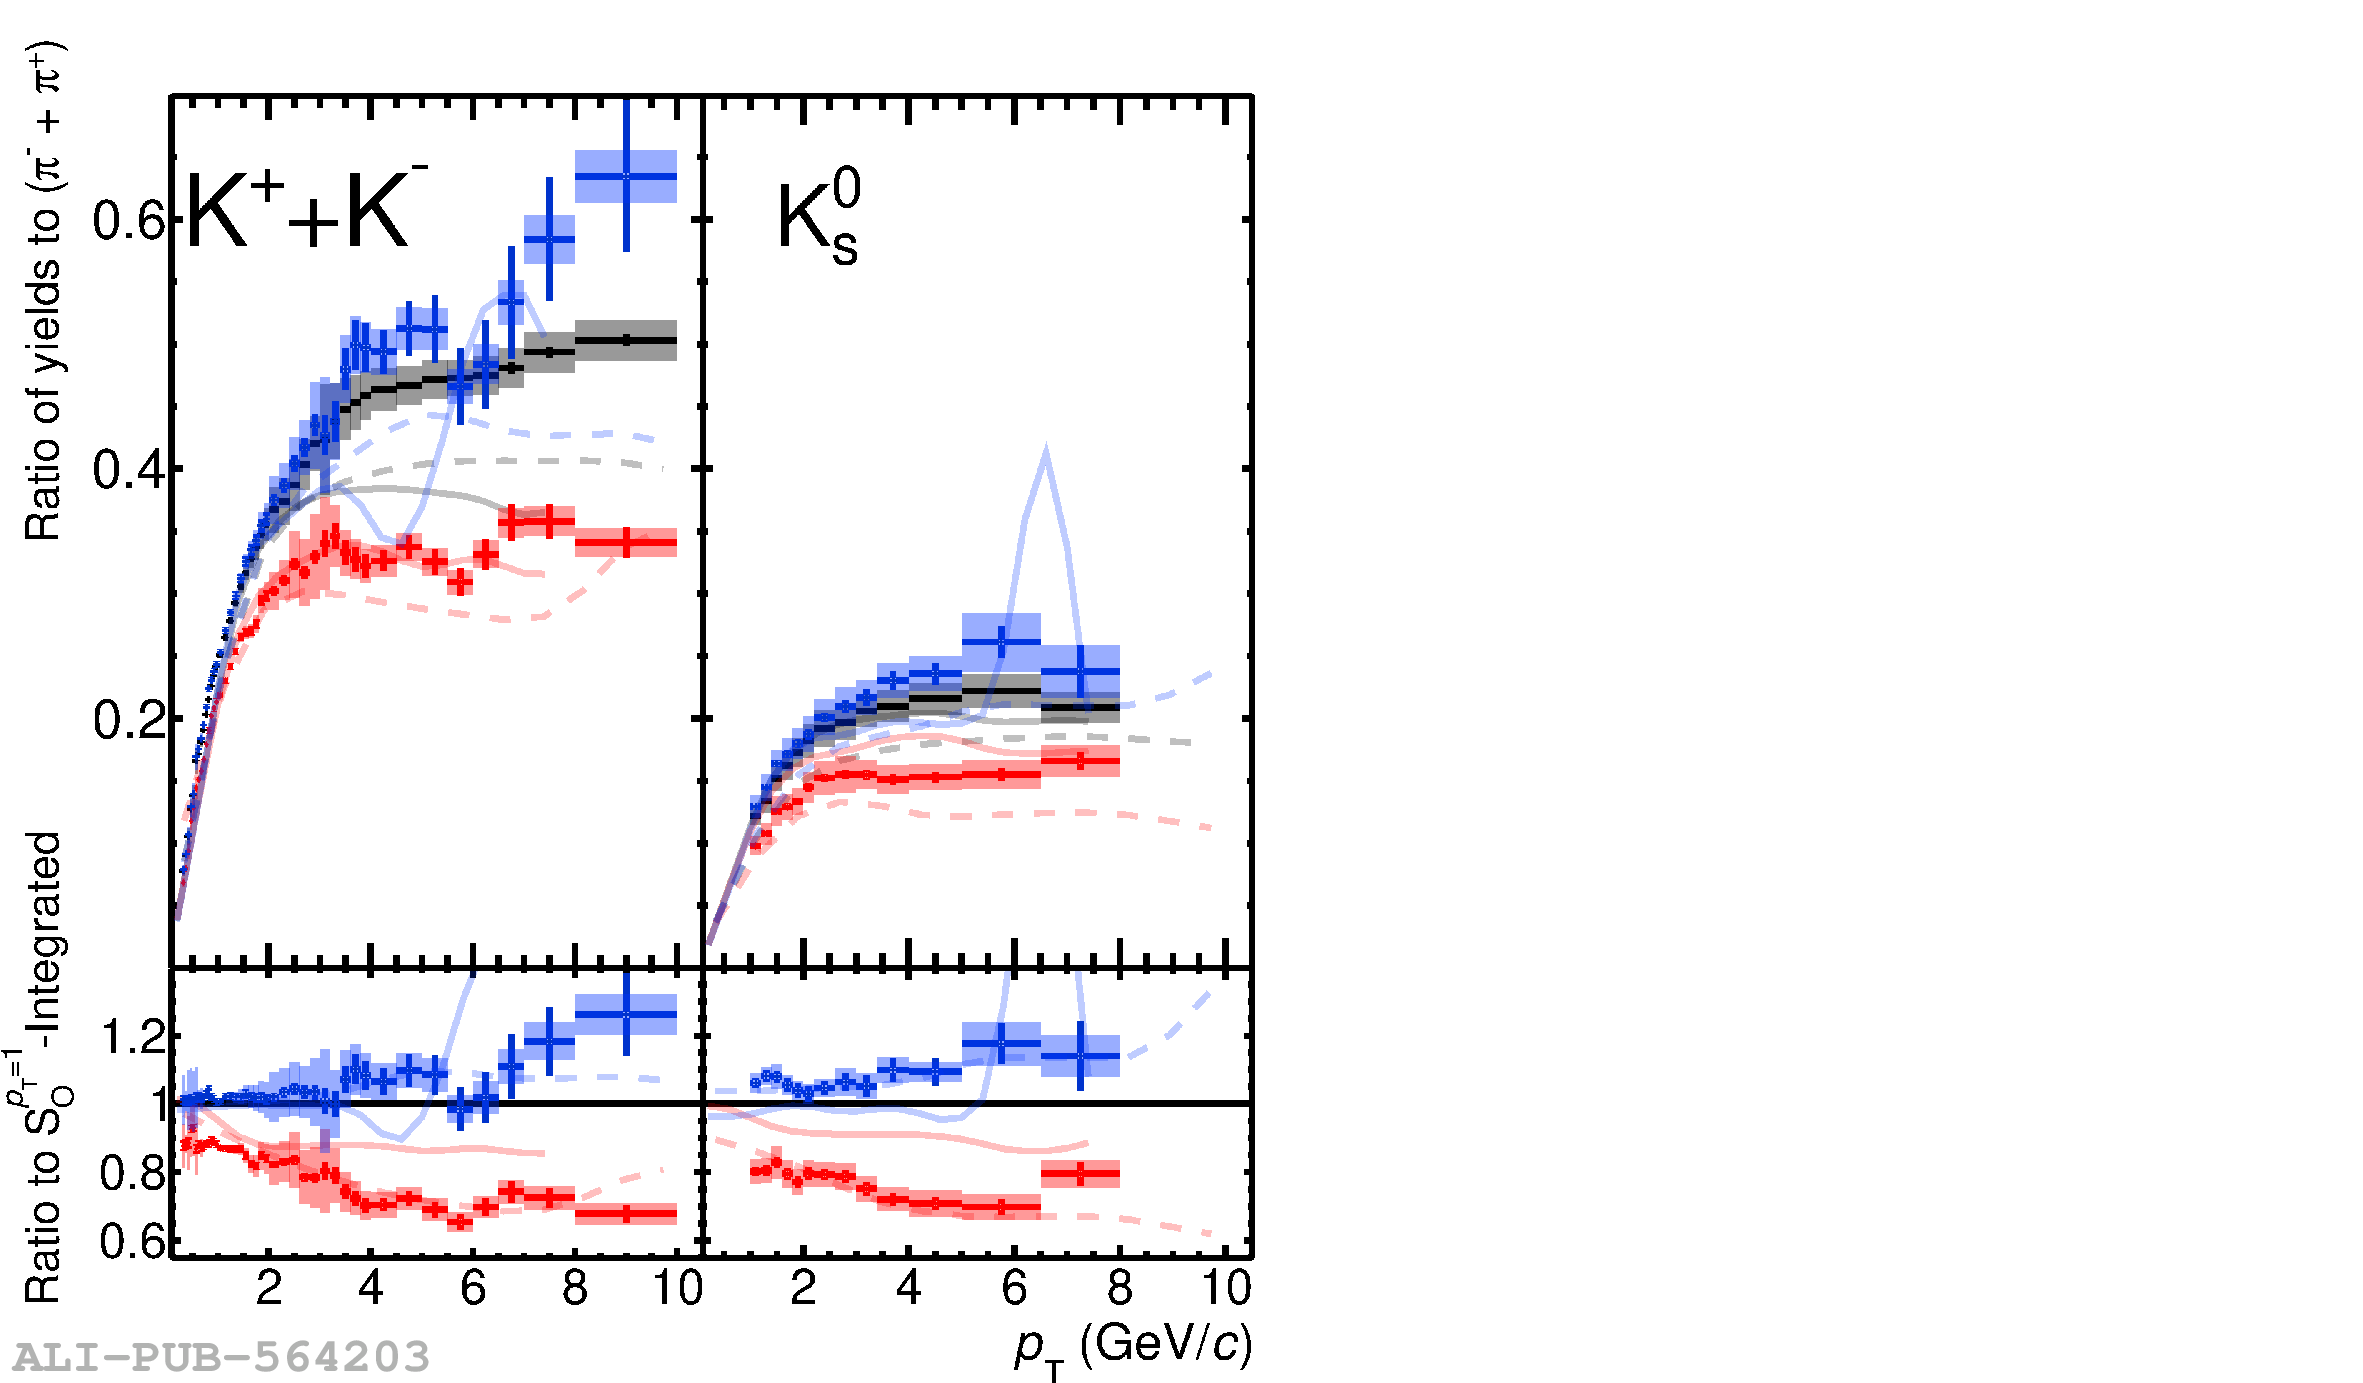 |