Transverse momentum distribution of \pikp, \KSTAR, \PHI, \KOs, \LA and \XI for \SOPT classes selected for events at high-multiplicity, determined by events in the top 1\% of \tracklet. The lower panels present the ratio between the \SOPT-integrated and \SOPT-differential events. Statistical and total systematic uncertainties are shown by error bars and boxes, respectively. Fig. \ref{Fig:CombSpectraA} and Fig. \ref{Fig:CombSpectraB} both show the same experimental data. The curves represent Herwig 7.2 and EPOS-LHC predictions of the same measurement. | 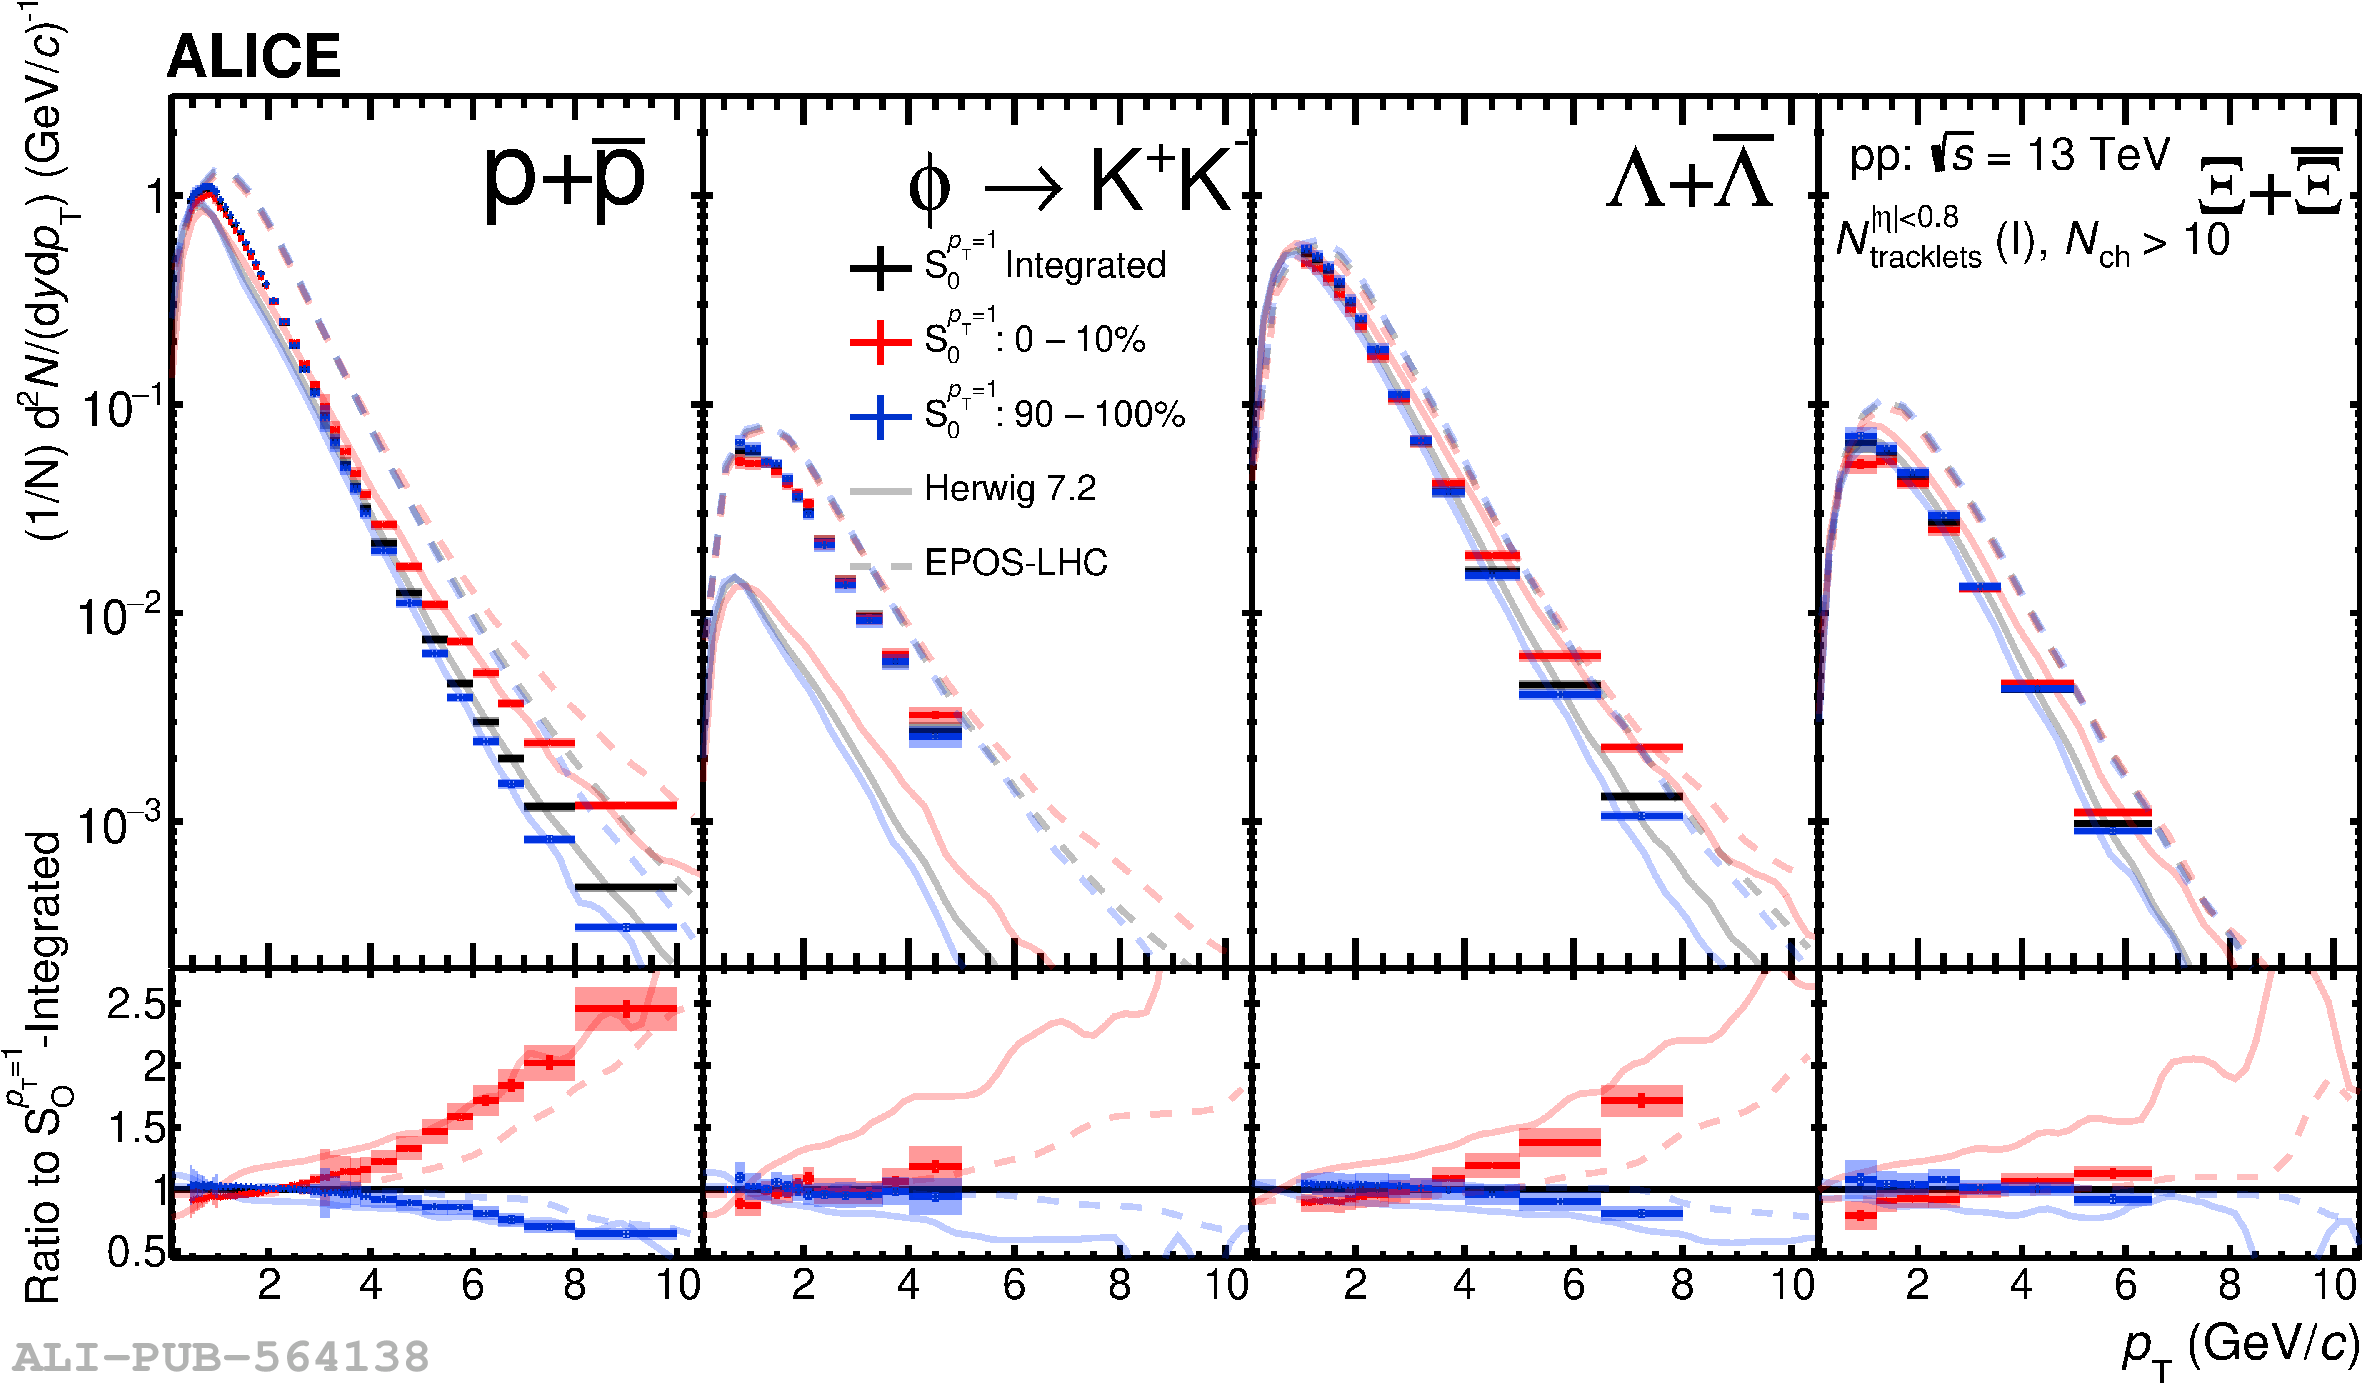 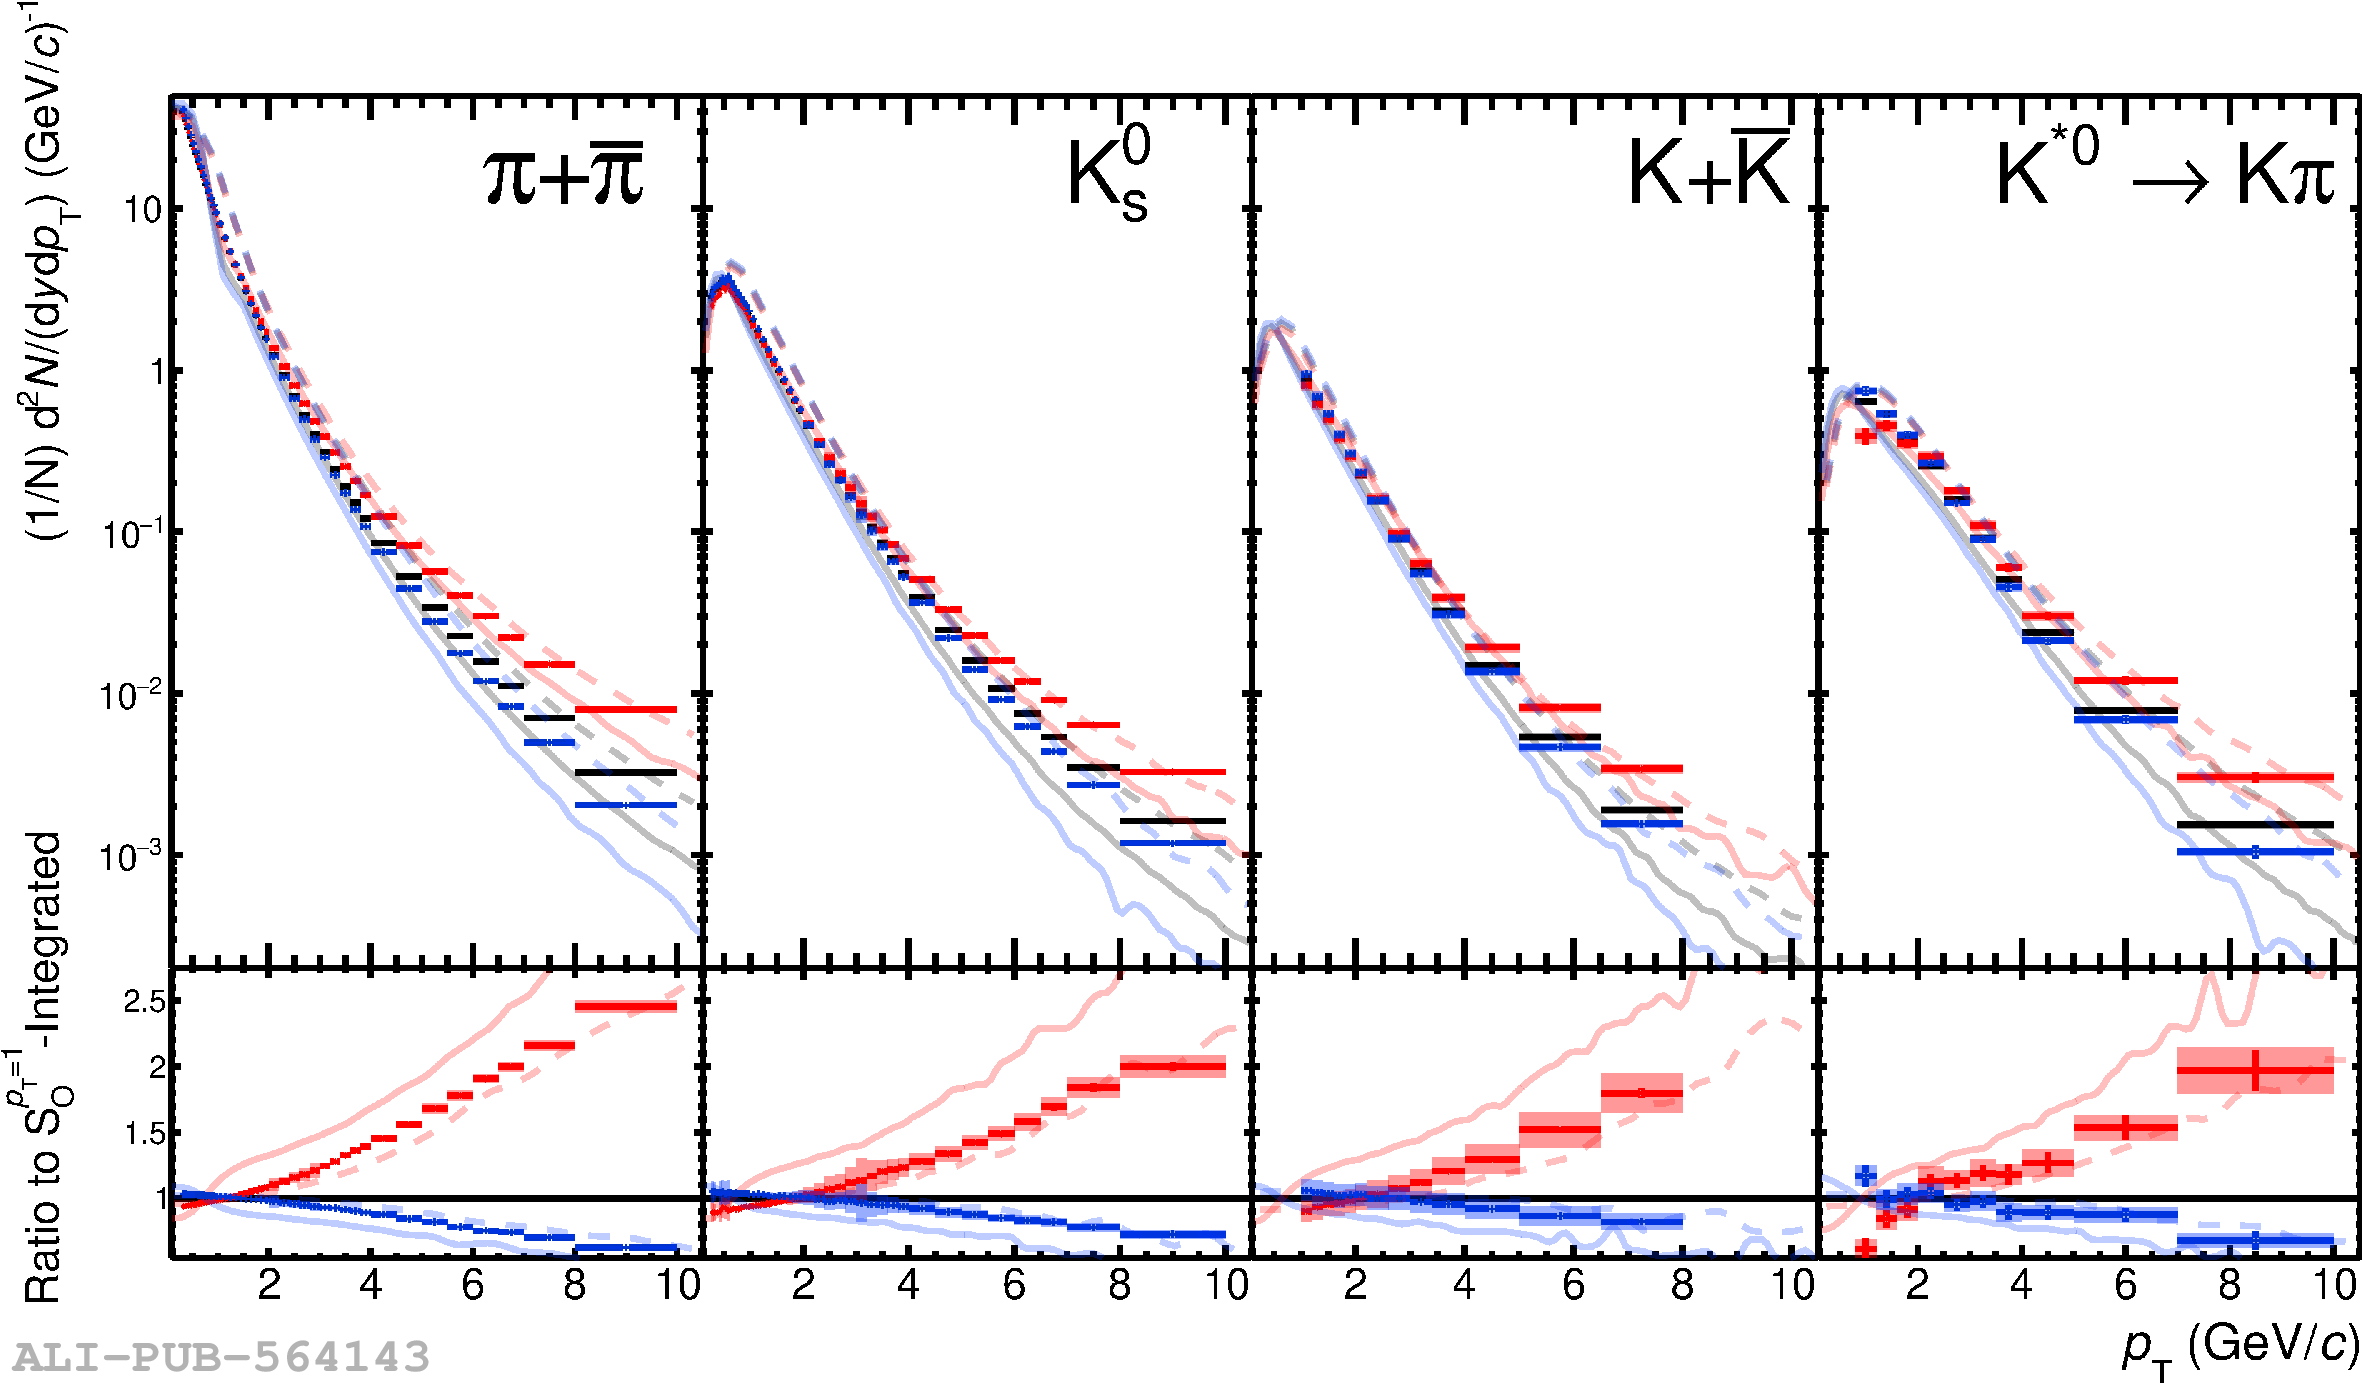 |