Correlation between $\langle p_{\rm{T}}\rangle$ and $\langle \rm{d}N_{\pi}/\rm{d}y \rangle$ as a function of \SOPT, in the 0--10\% and 0--1\% V0M and \tracklet multiplicity classes. The total systematic uncertainties are represented by empty boxes. The statistical uncertainty is smaller than the reported marker sizes. | 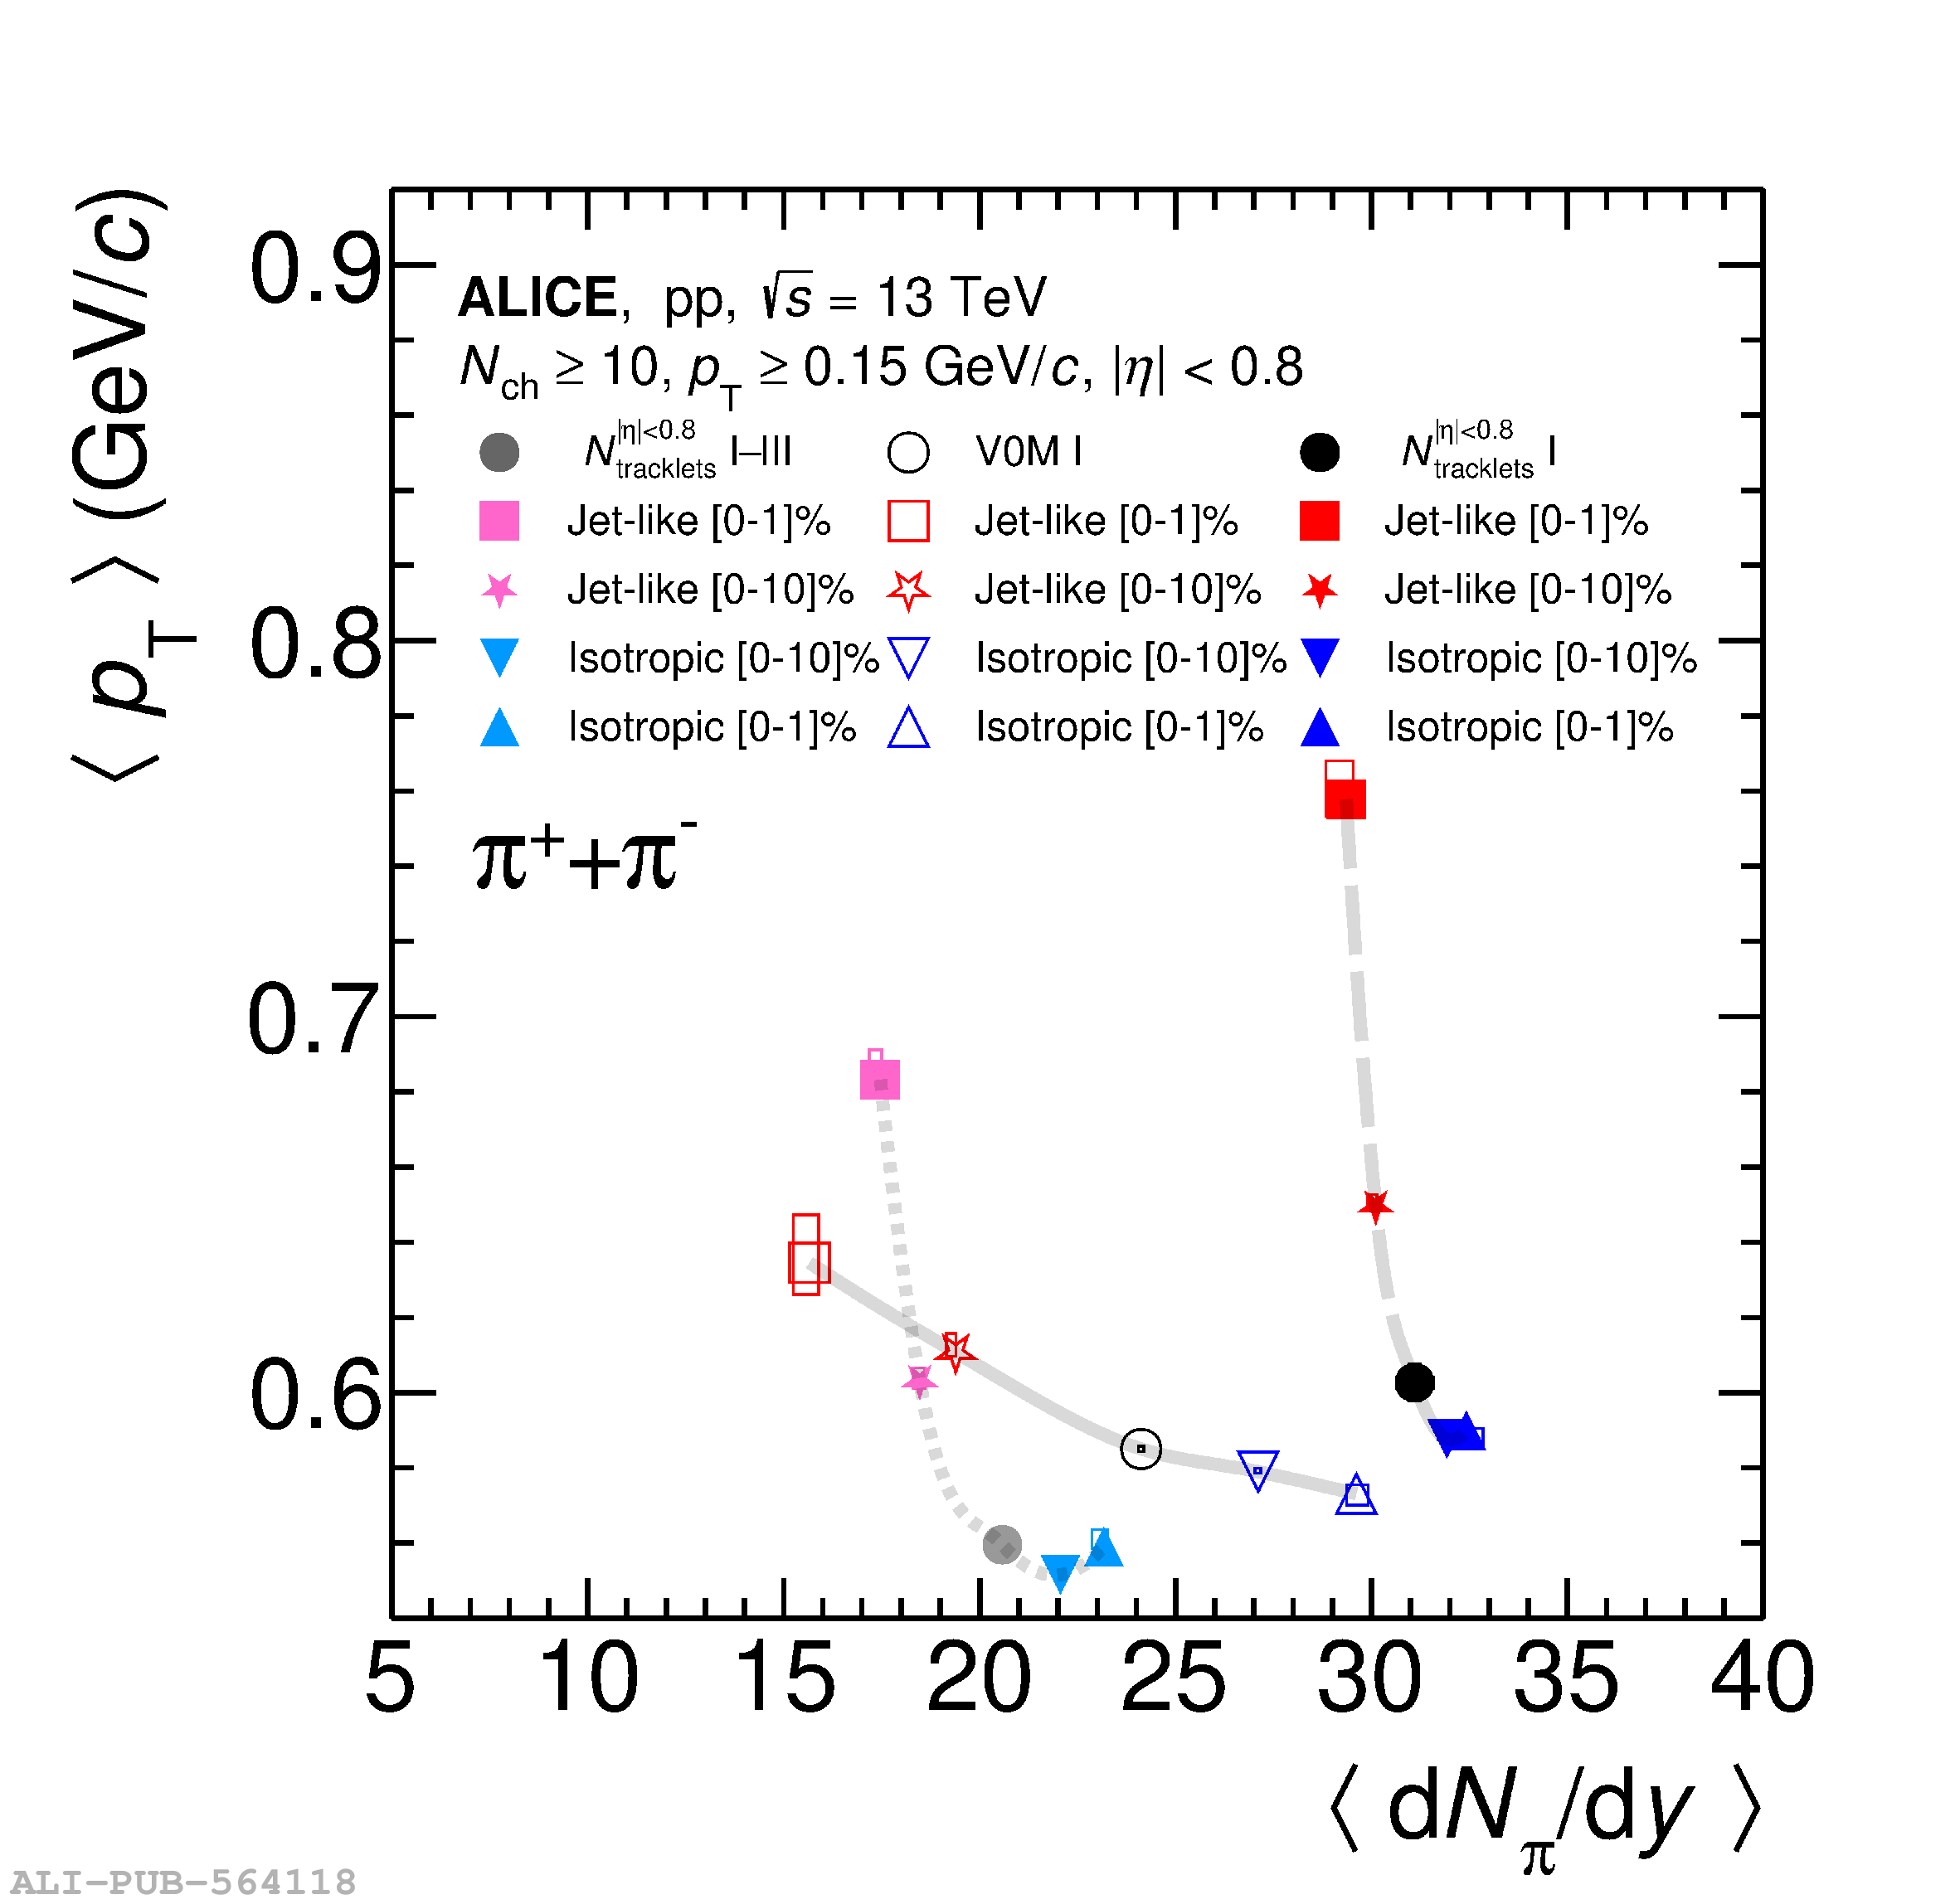 |