Comparison of PYTHIA8 Monash prediction for NS and AS per-trigger yields (first row) and widths (third row) in the two $\pt^{\rm{e}}$ ranges $4 < \pt^{\rm e} < 7$ \GeVc and $7 < \pt^{\rm e} < 16$ \GeVc for electrons from charm- and beauty-hadron decays, as a function of $\pt^{\rm{assoc}}$ in pp collisions. The ratios to c, b $\rightarrow$ e yields and widths are shown in the second and fourth rows, respectively. The statistical uncertainties are shown as vertical lines. | 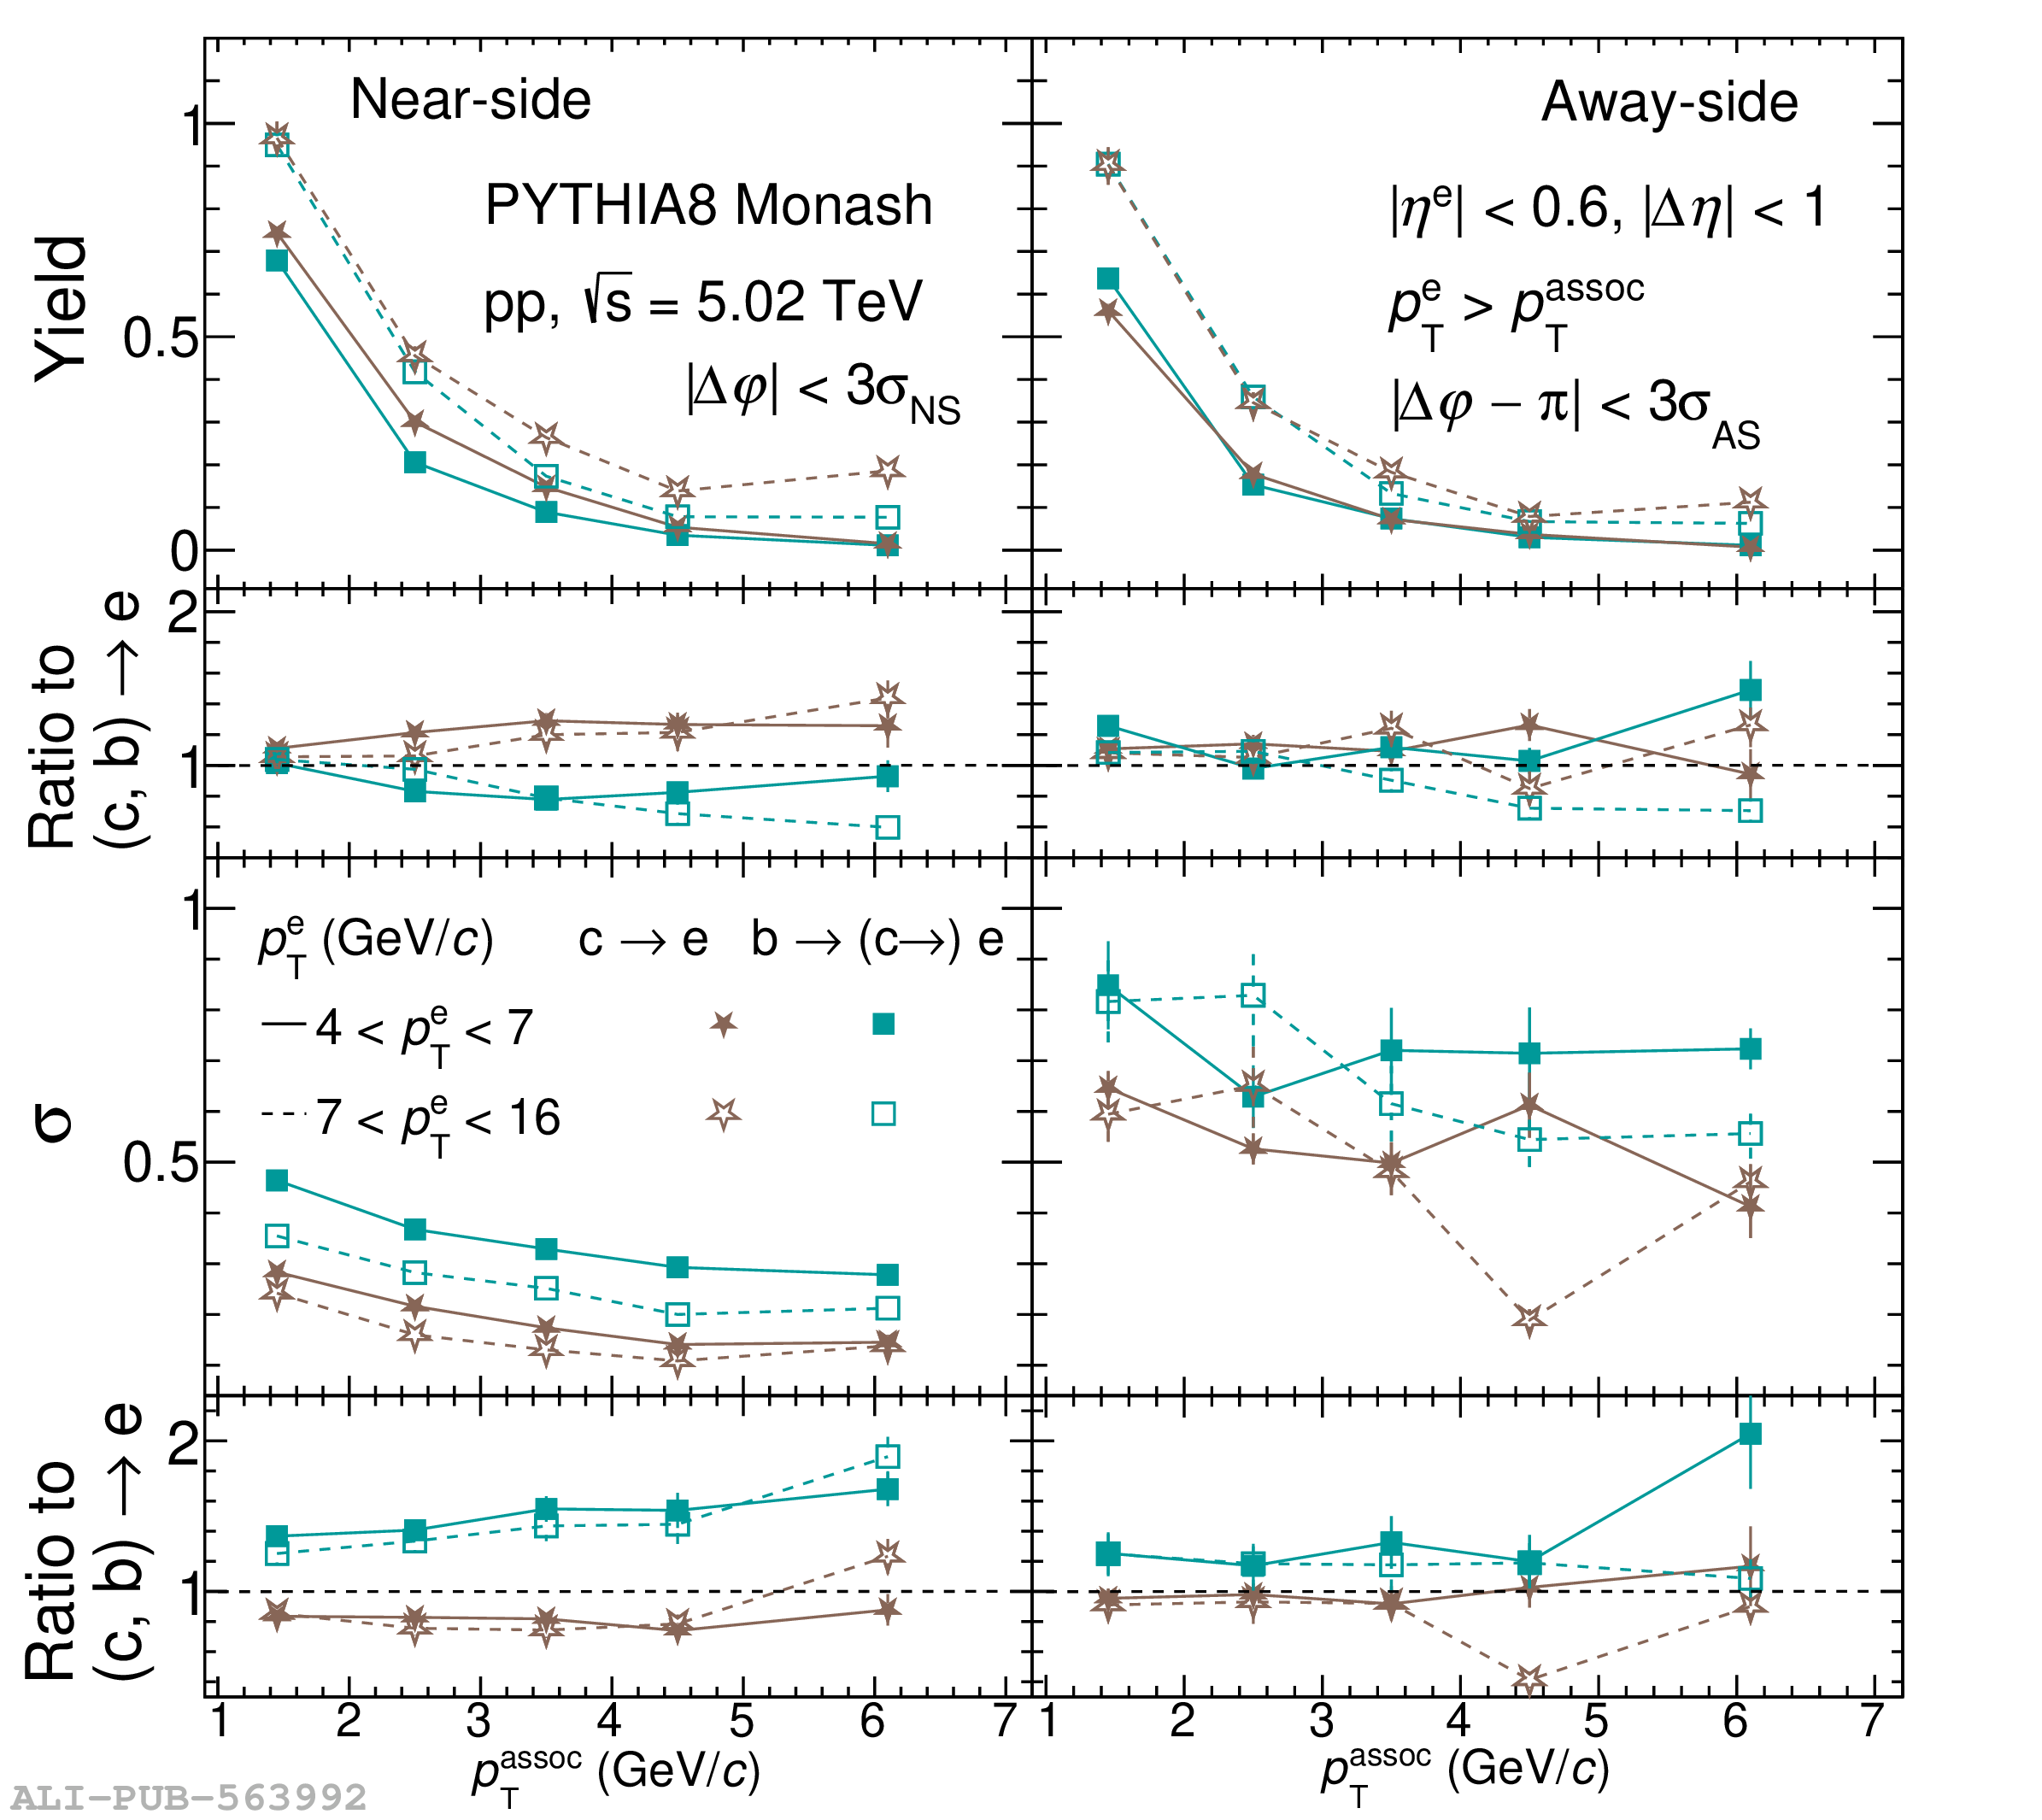 |