The azimuthal ($\Delta\varphi$) correlation distributions between heavy-flavor decay electrons and associated charged particles are measured in pp and p$-$Pb collisions at $\sqrt{s_{\rm{NN}}} = 5.02$ TeV. Results are reported for electrons with transverse momentum $4<~p_{\rm T}<~16$ GeV/$c$ and pseudorapidity $|\eta|<~0.6$. The associated charged particles are selected with transverse momentum $1<~p_{\rm T}<~7$ GeV/$c$, and relative pseudorapidity separation with the leading electron $|\Delta\eta| <~ 1$. The correlation measurements are performed to study and characterize the fragmentation and hadronization of heavy quarks. The correlation structures are fitted with a constant and two von Mises functions to obtain the baseline and the near- and away-side peaks, respectively. The results from p$-$Pb collisions are compared with those from pp collisions to study the effects of cold nuclear matter. In the measured trigger electron and associated particle kinematic regions, the two collision systems give consistent results. The $\Delta\varphi$ distribution and the peak observables in pp and p$-$Pb collisions are compared with calculations from various Monte Carlo event generators.
Eur. Phys. J. C 83 (2023) 741
HEP Data
e-Print: arXiv:2303.00591 | PDF | inSPIRE
CERN-EP-2023-024
Figure group
Figure 1
The azimuthal-correlation distribution for $4 < p_{\rm T}^{\rm e} < 12$ GeV/$c$ fitted with a constant function for the baseline (green line) and von Mises functions for AS and NS peaks (grey curves) for different associated $\pt$ ranges in pp collisions at $\sqrt{s}= 5.02$ TeV (top panels) and p-Pb collisions at $\sqrt{s_{\rm NN}}= 5.02$ TeV (bottom panels). The statistical (uncorrelated systematic) uncertainties are shown as vertical lines (empty boxes). The uncertainties of the baseline estimation are shown as solid boxes at $\Delta\varphi \sim -2$ rad. | 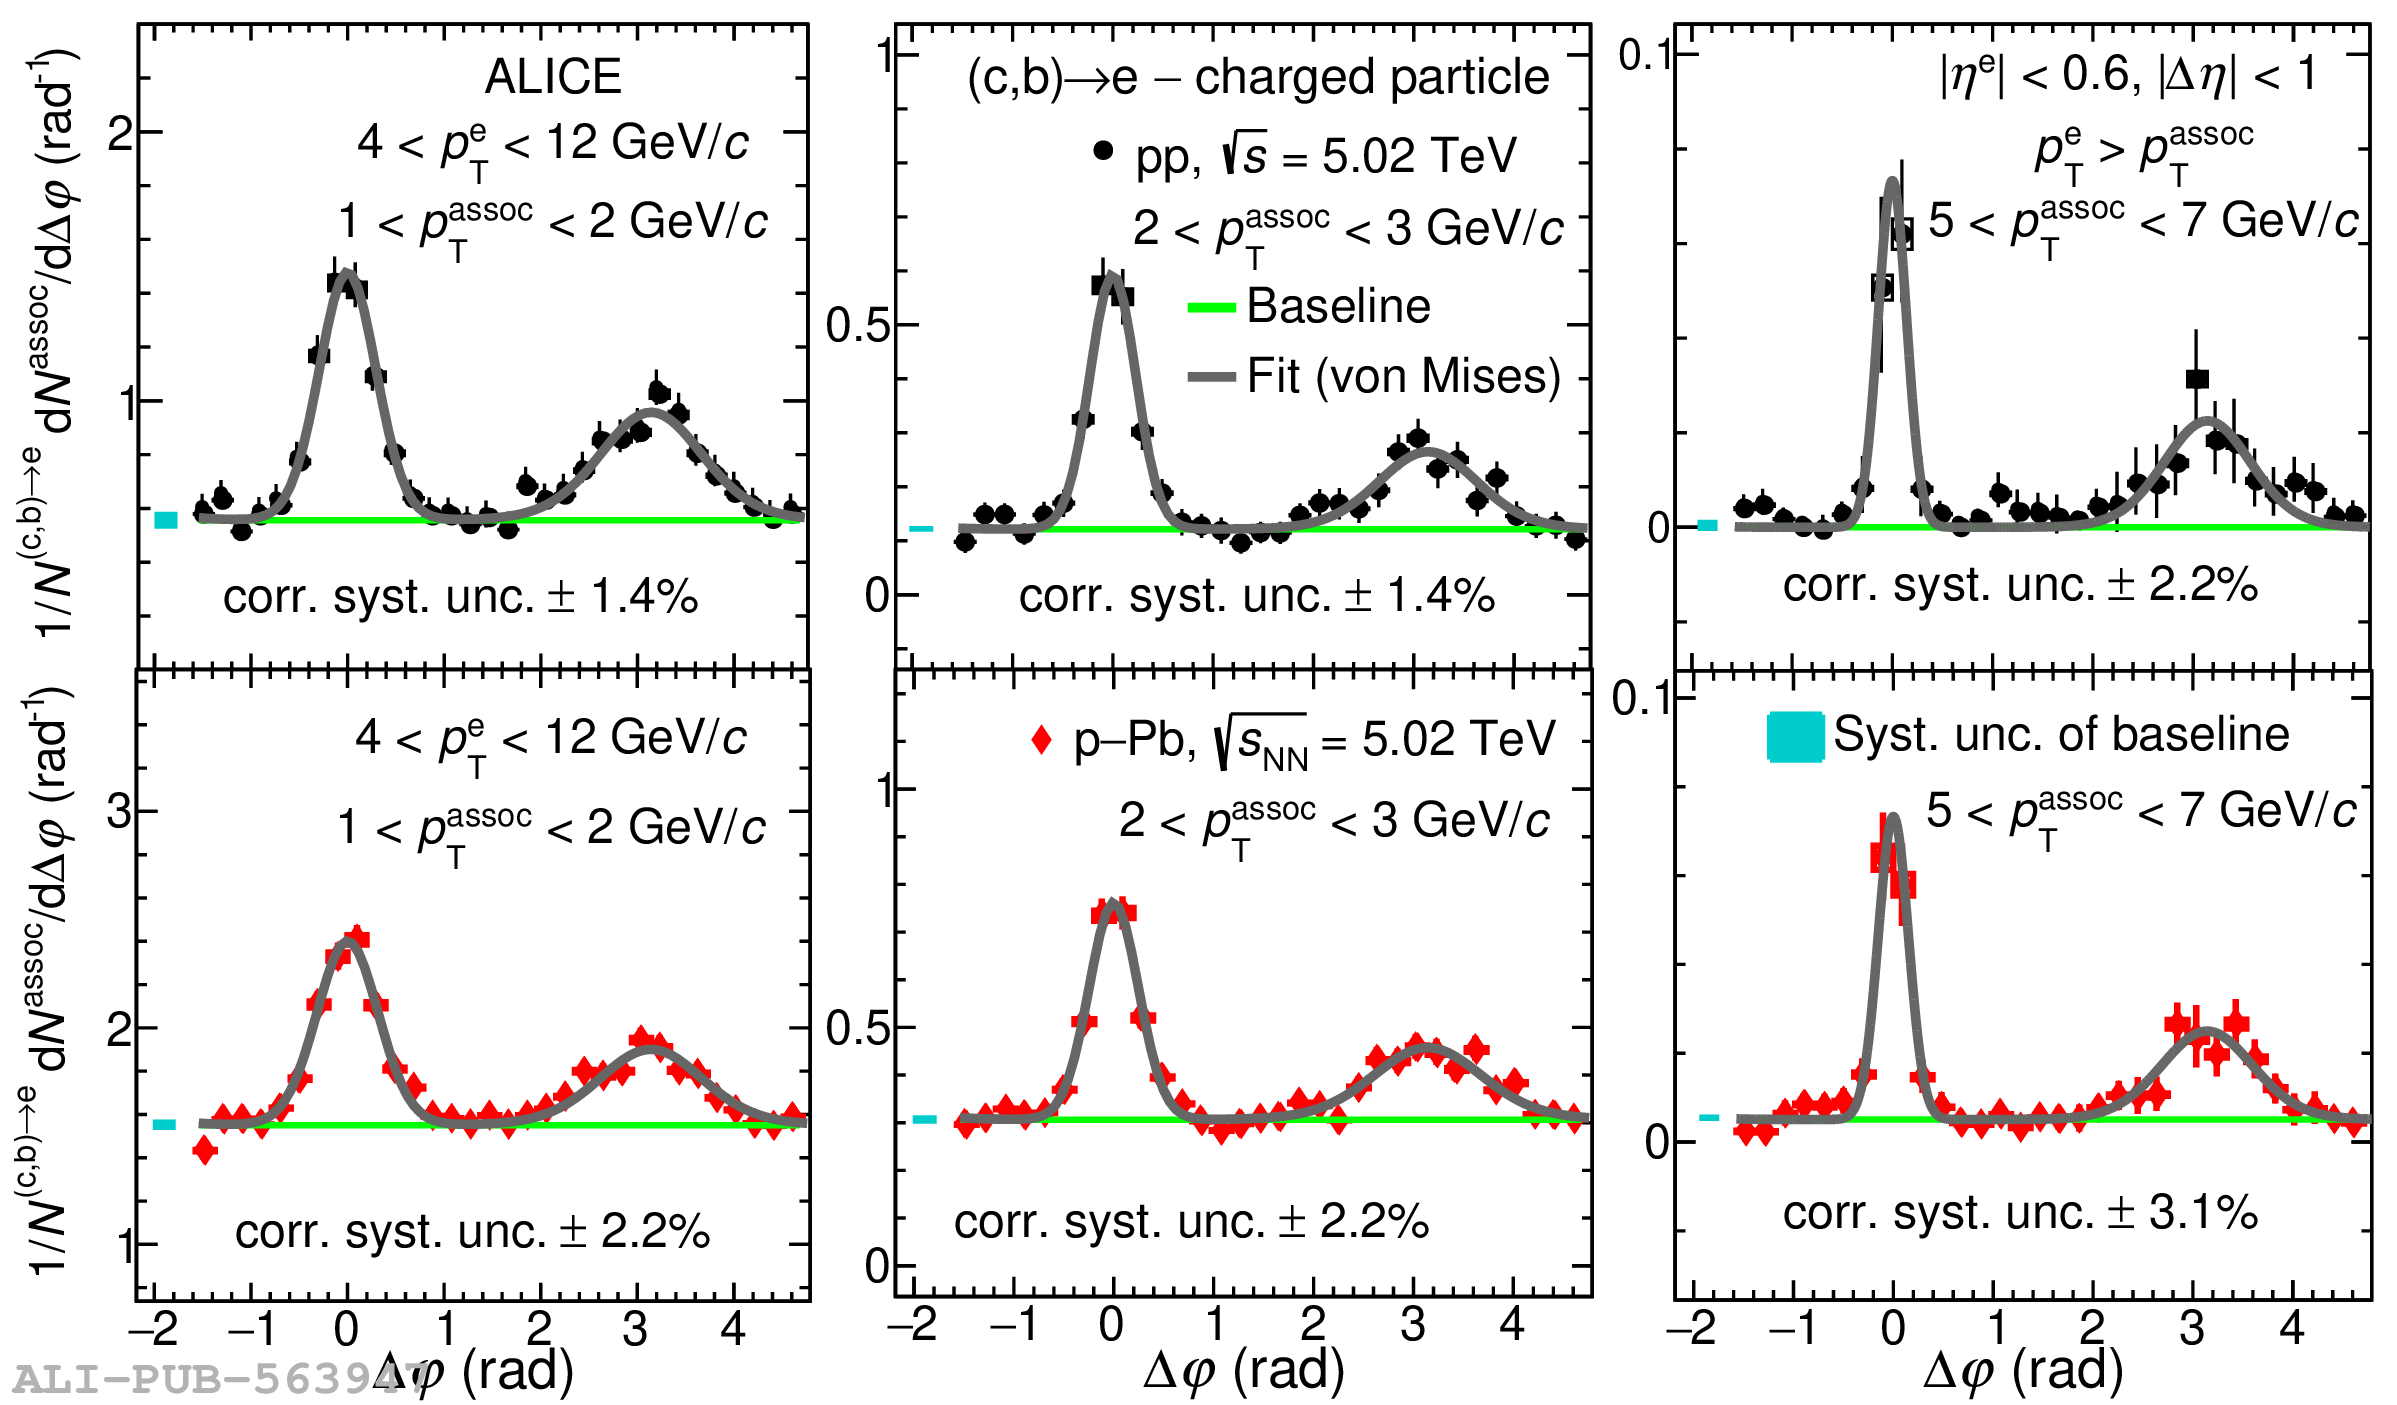 |
Figure 2
Comparison of azimuthal-correlation distribution after baseline subtraction for $4 < p_{\rm T}^{\rm e} < 12$ GeV/$c$ and for different associated $\pt$ ranges in pp collisions at $\sqrt{s} = 5.02$ TeV and p-Pb collisions at $\sqrt{s_{\rm{NN}}} = 5.02$ TeV. The statistical (uncorrelated systematic) uncertainties are shown as vertical lines (empty boxes). The uncertainties of the baseline estimation are shown as solid boxes at $\Delta \varphi \sim -2$ rad. | 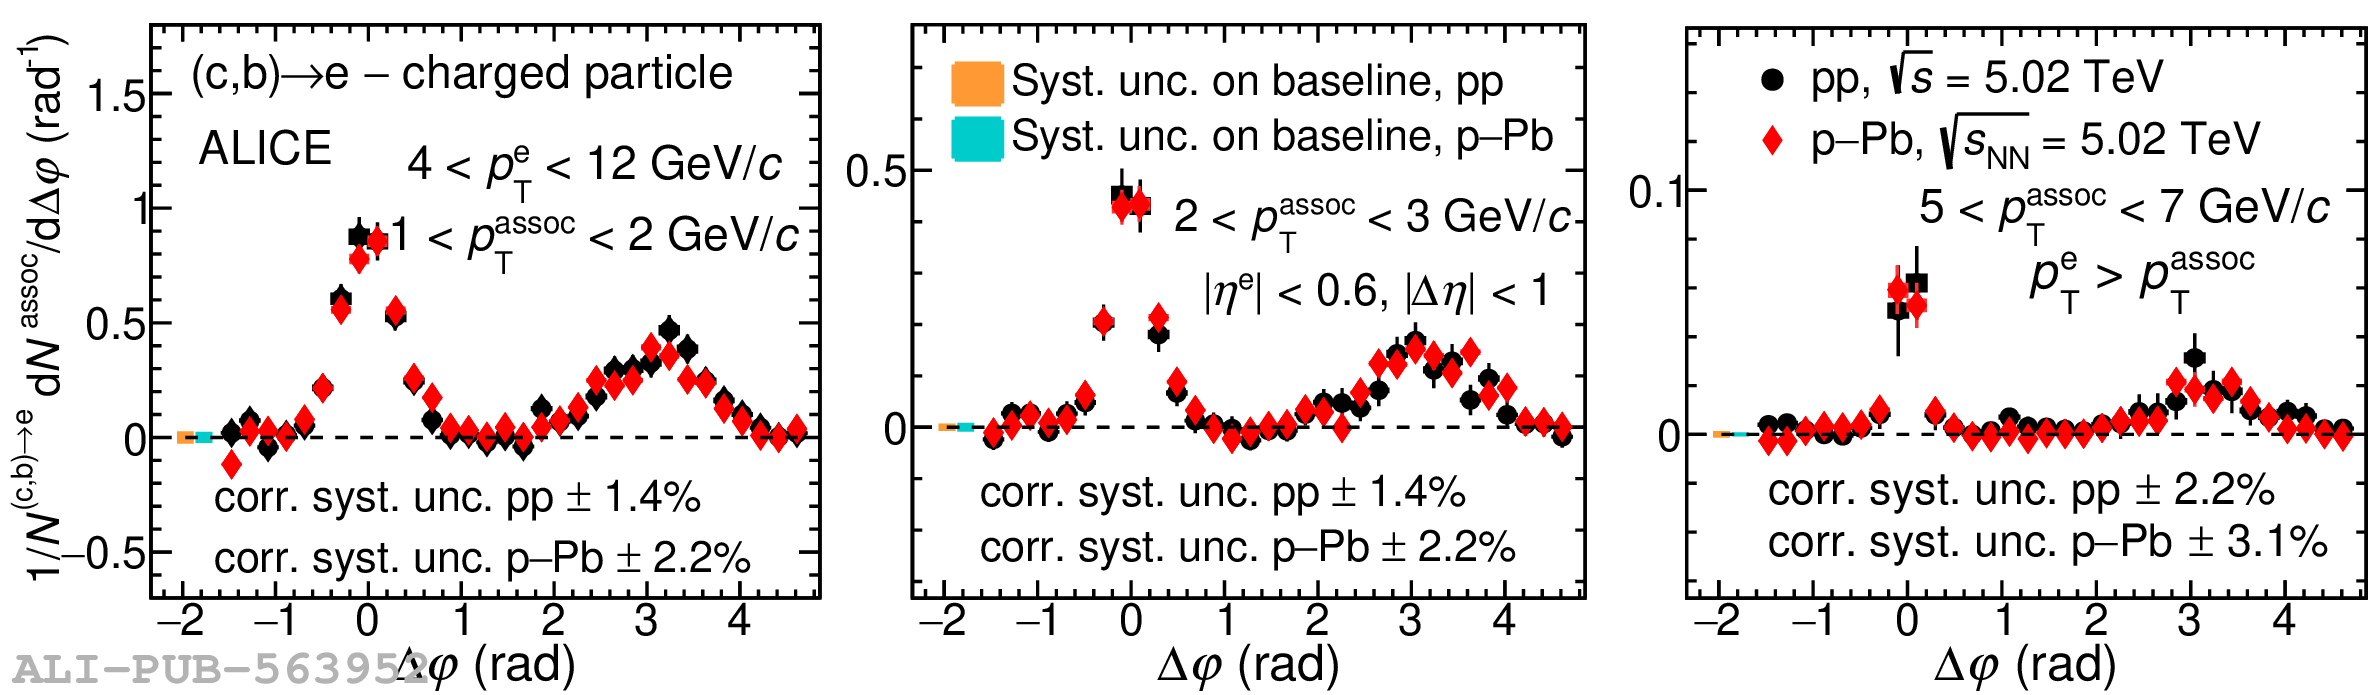 |
Figure 3
Comparison of near- and away-side per-trigger yields (first row) and widths (third row) as a function of $p_{\rm T}^{\rm{assoc}}$ for $4 < p_{\rm T}^{\rm e} < 12$ GeV/$c$ in pp collisions at $\sqrt{s} = 5.02$ TeV and p-Pb collisions at $\sqrt{s_{\rm{NN}}} = 5.02$ TeV. The ratios between pp and p-Pb yields and widths are shown in the second and fourth row, respectively. The statistical (systematic) uncertainties are shown as vertical lines (empty boxes). | 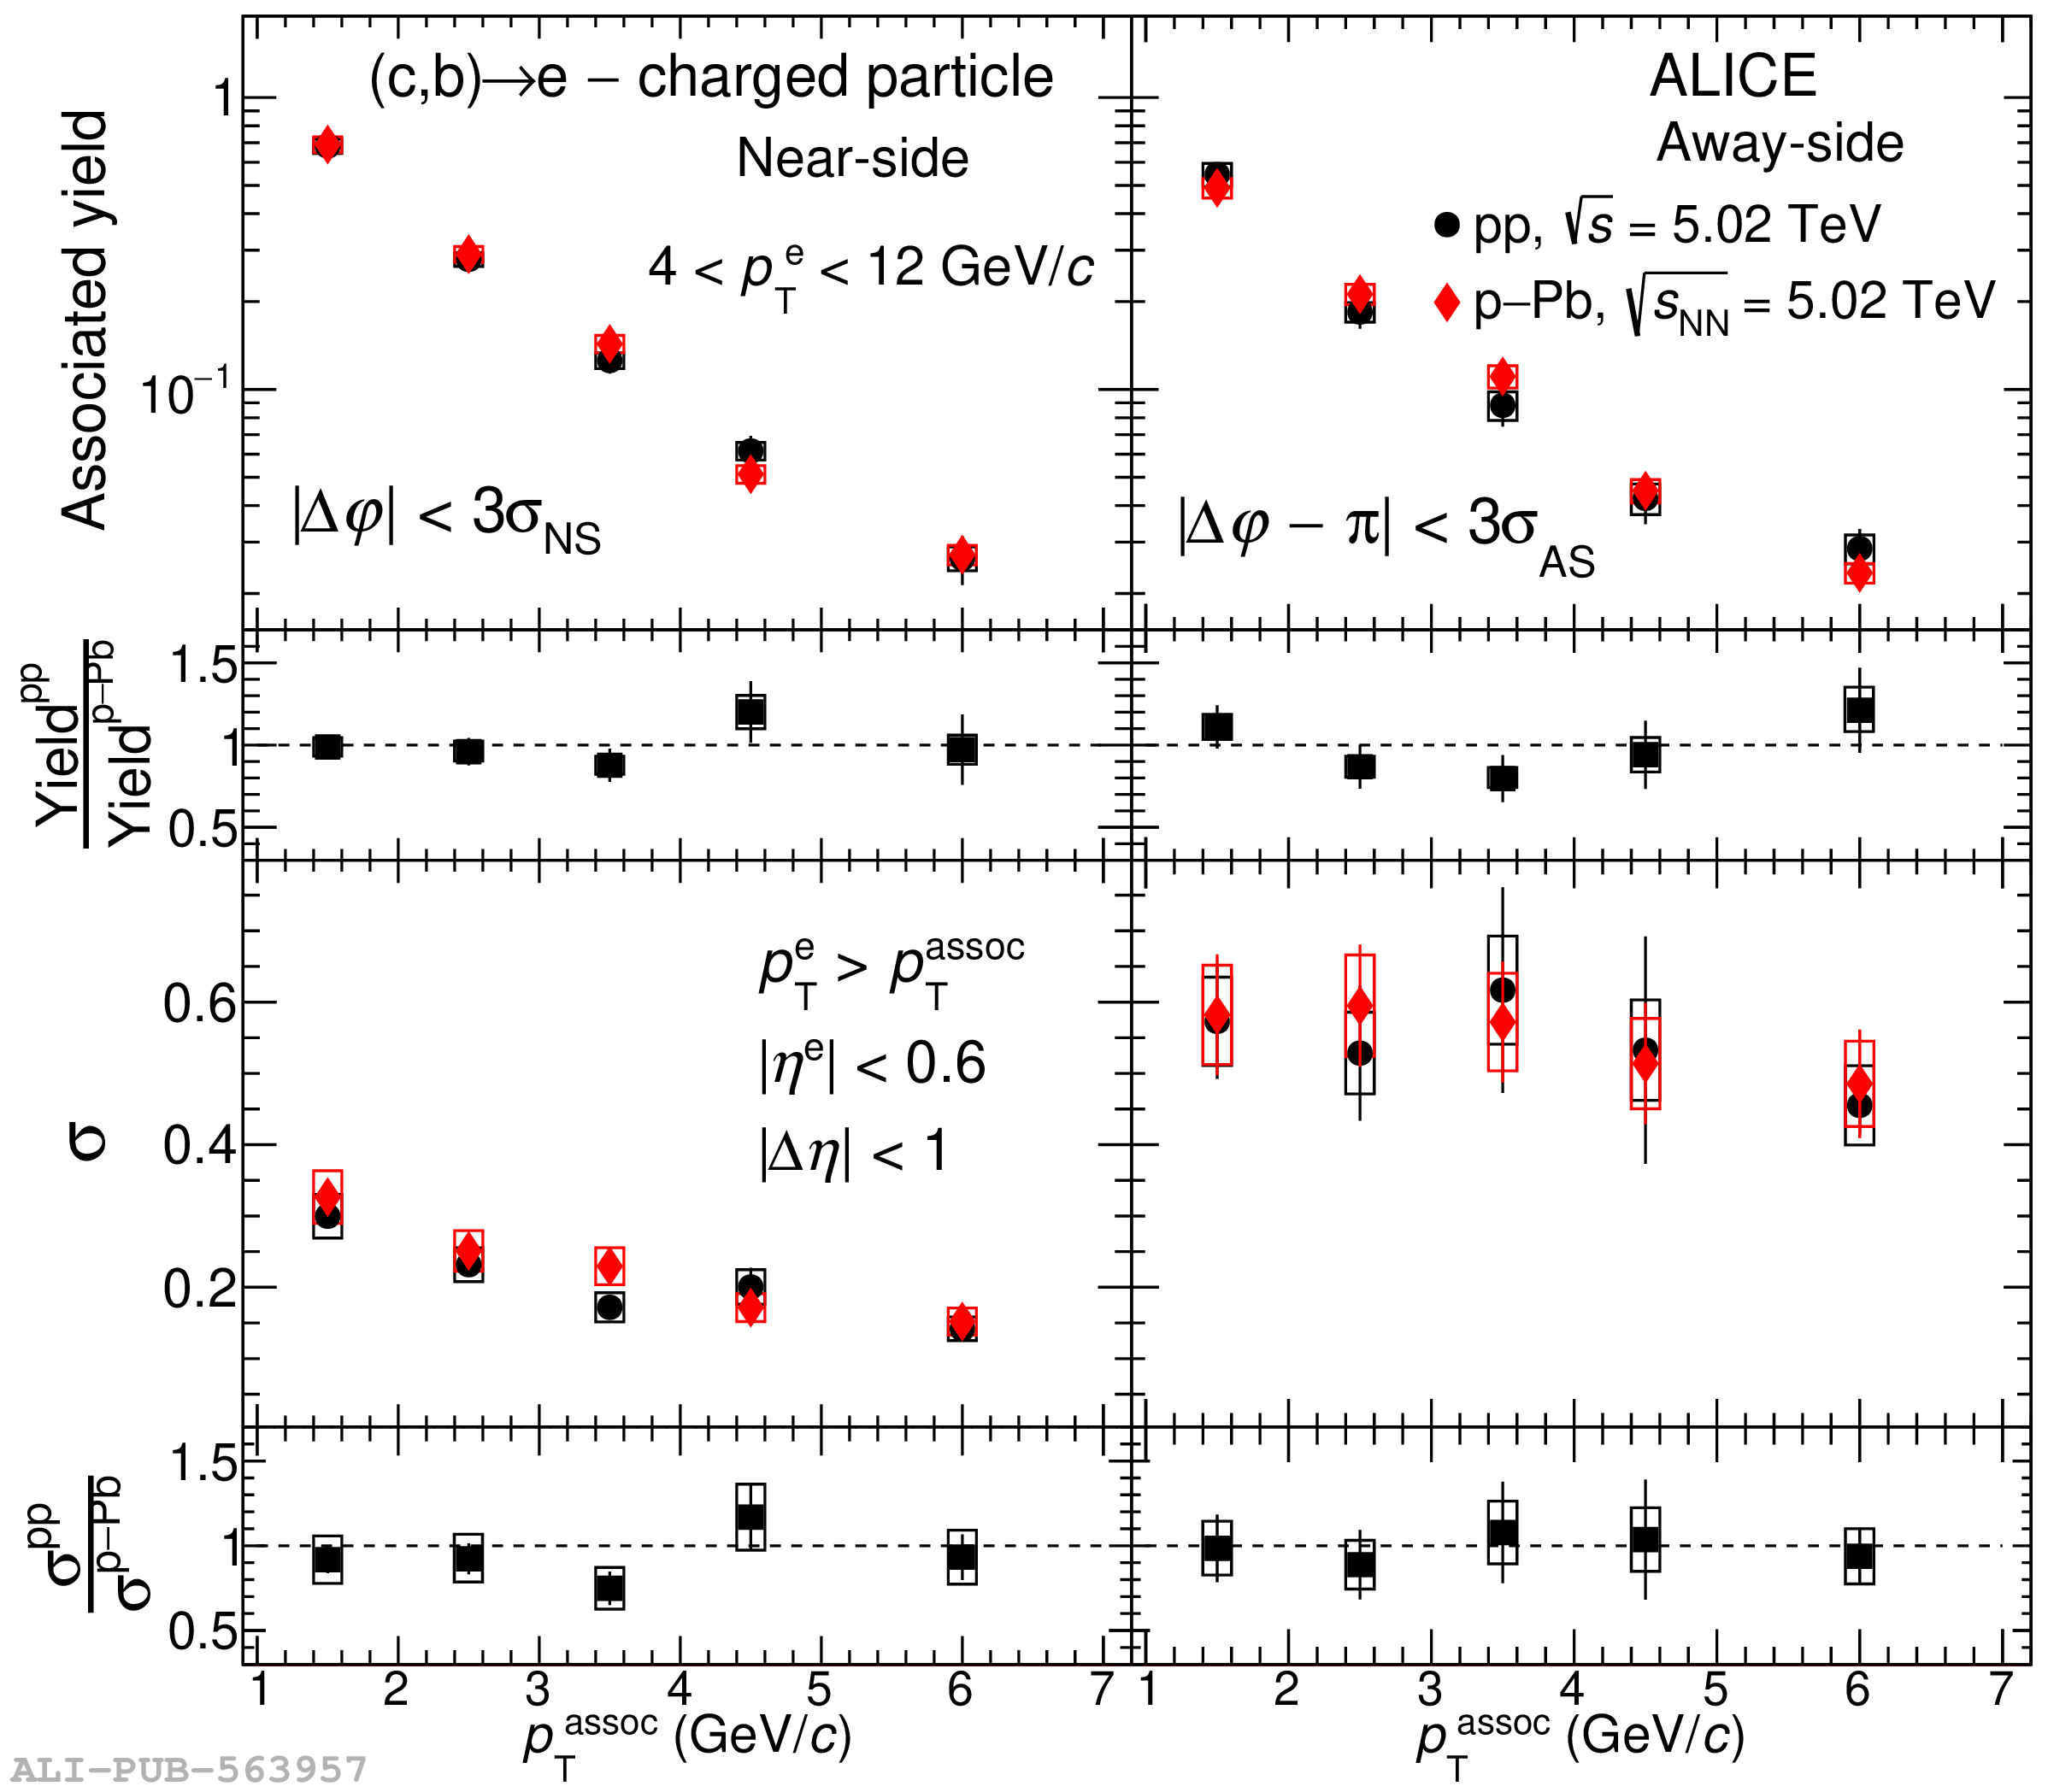 |
Figure 4
Comparison of the azimuthal-correlation distribution with model predictions after baseline subtraction for $4 < p_{\rm T}^{\rm e} < 12$ GeV/$c$ in different $p_{\rm T}^{\rm{assoc}}$ ranges in pp collisions at $\sqrt{s} = 5.02$ TeV. The statistical (uncorrelated systematic) uncertainties are shown as vertical lines (empty boxes). The uncertainties of the baseline are shown as solid boxes near $\Delta \varphi \sim 0$ rad. |  |
Figure 5
Comparison of the azimuthal-correlation distribution with model predictions after baseline subtraction for $4 < p_{\rm T}^{\rm e} < 12$ GeV/$c$ in different $p_{\rm T}^{\rm{assoc}}$ ranges in p-Pb collisions at $\sqrt{s_{\rm{NN}}} = 5.02$ TeV. The statistical (uncorrelated systematic) uncertainties are shown as vertical lines (empty boxes). The uncertainties of the baseline are shown as solid boxes near $\Delta \varphi \sim 0$ rad. | 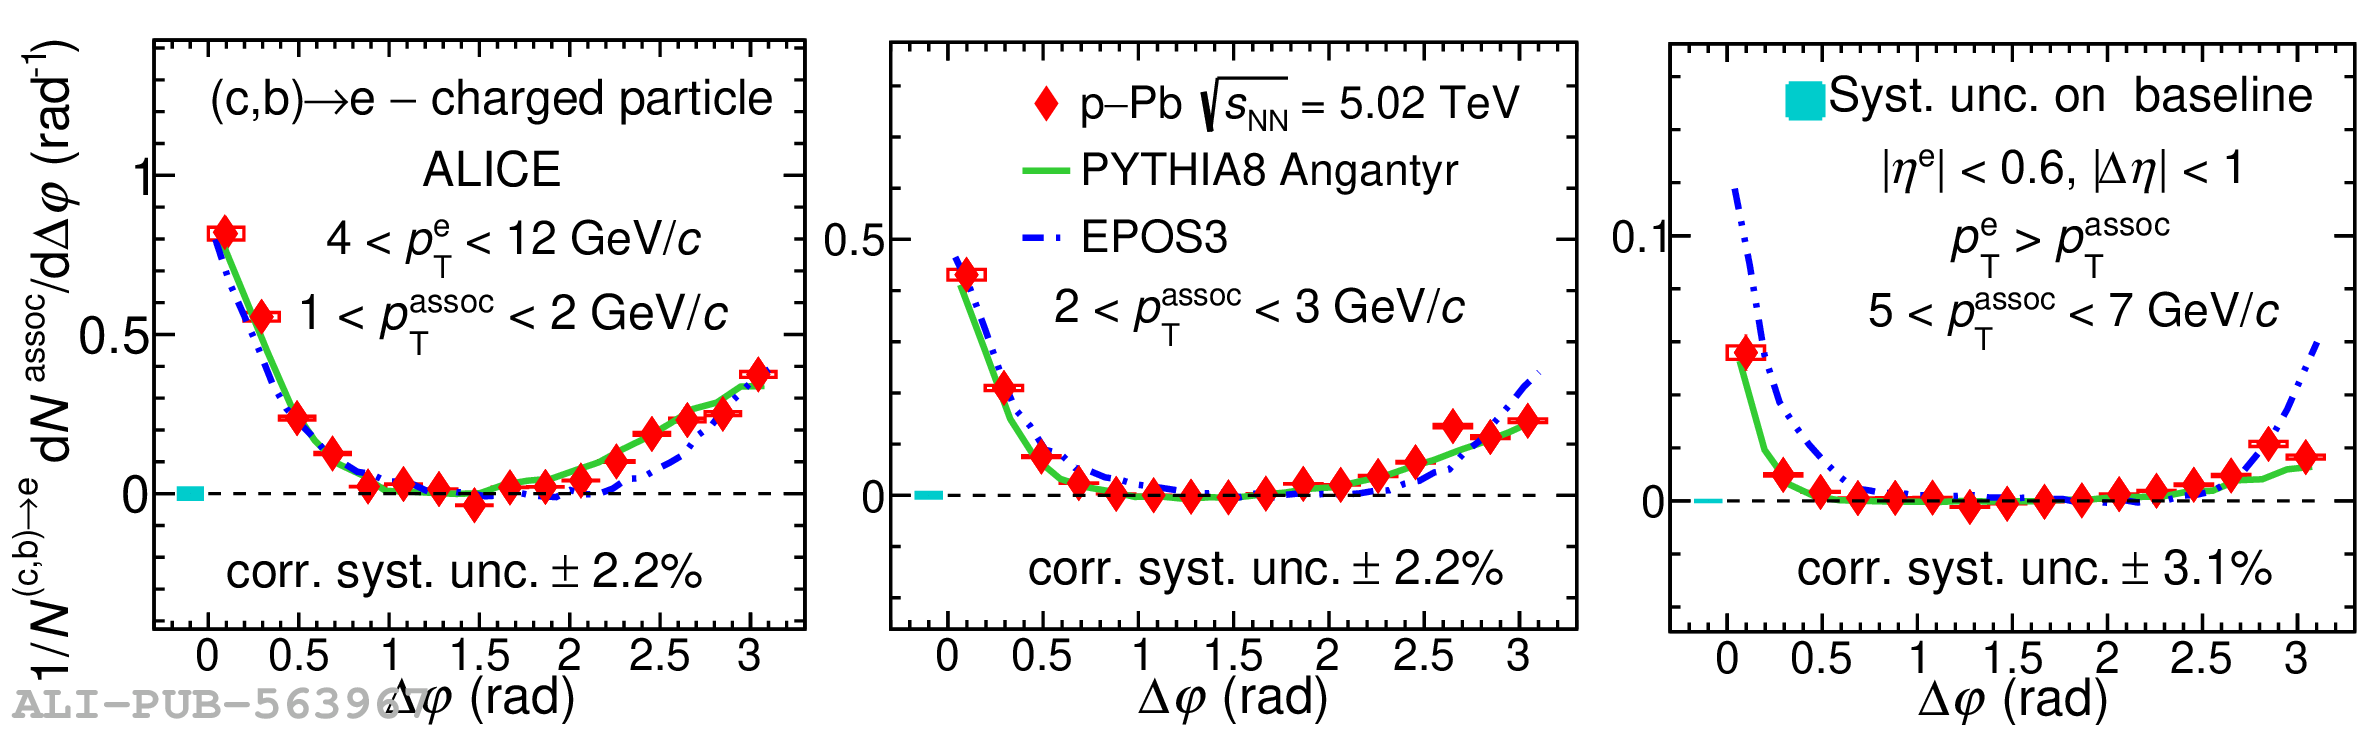 |
Figure 6
Near- and away-side per-trigger yields (first row) and widths (third row) as a function of $p_{\rm T}^{\rm{assoc}}$ for $4 < p_{\rm T}^{\rm e} < 12$ GeV/$c$ compared with predictions from PYTHIA8 Monash tune and EPOS3 in pp collisions at $\sqrt{s} = 5.02$ TeV. The ratios between model predictions and data are shown in the second and fourth row for the yields and widths, respectively. The statistical (systematic) uncertainties are shown as vertical lines (empty boxes). | 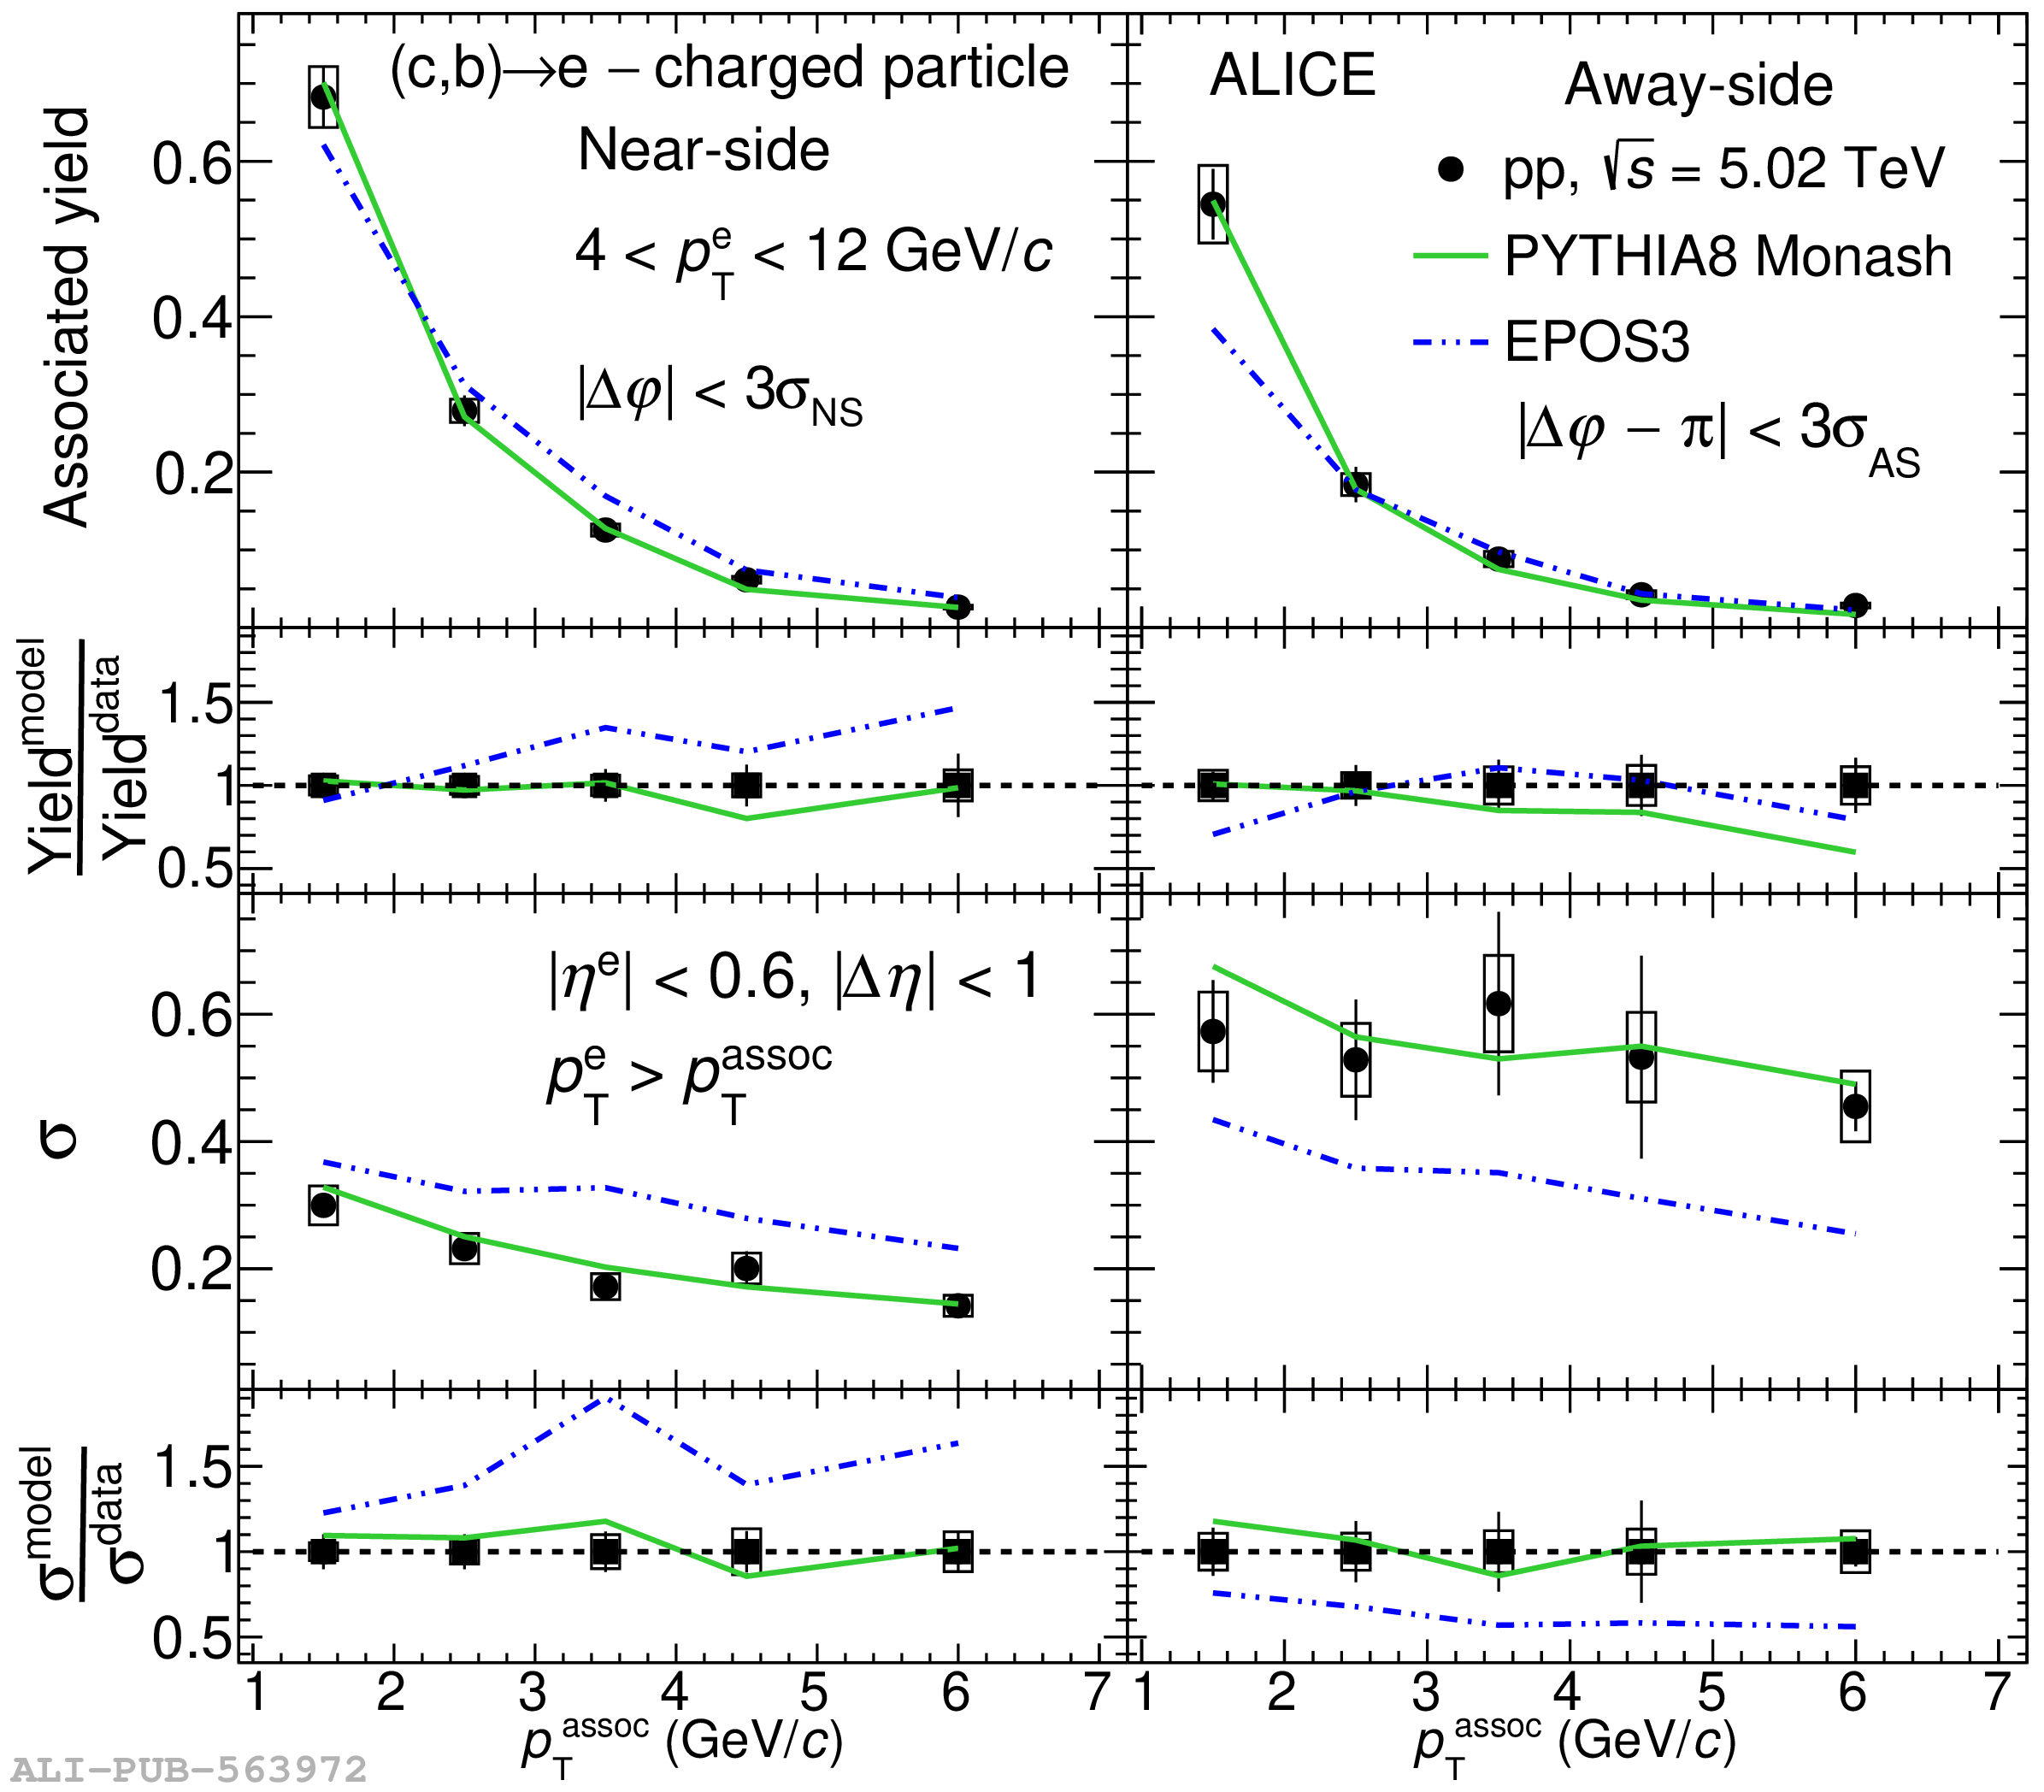 |
Figure 7
Near- and away-side per-trigger yields (first row) and widths (third row) as a function of $p_{\rm T}^{\rm{assoc}}$ for $4 < p_{\rm T}^{\rm e} < 12$ GeV/$c$ compared with predictions from PYTHIA8 Angantyr and EPOS3 in p-Pb collisions at $\sqrt{s_{\rm{NN}}} = 5.02$ TeV. The ratios between model predictions and data are shown in the second and fourth row for the yields and widths, respectively. The statistical (systematic) uncertainties are shown as vertical lines (empty boxes). | 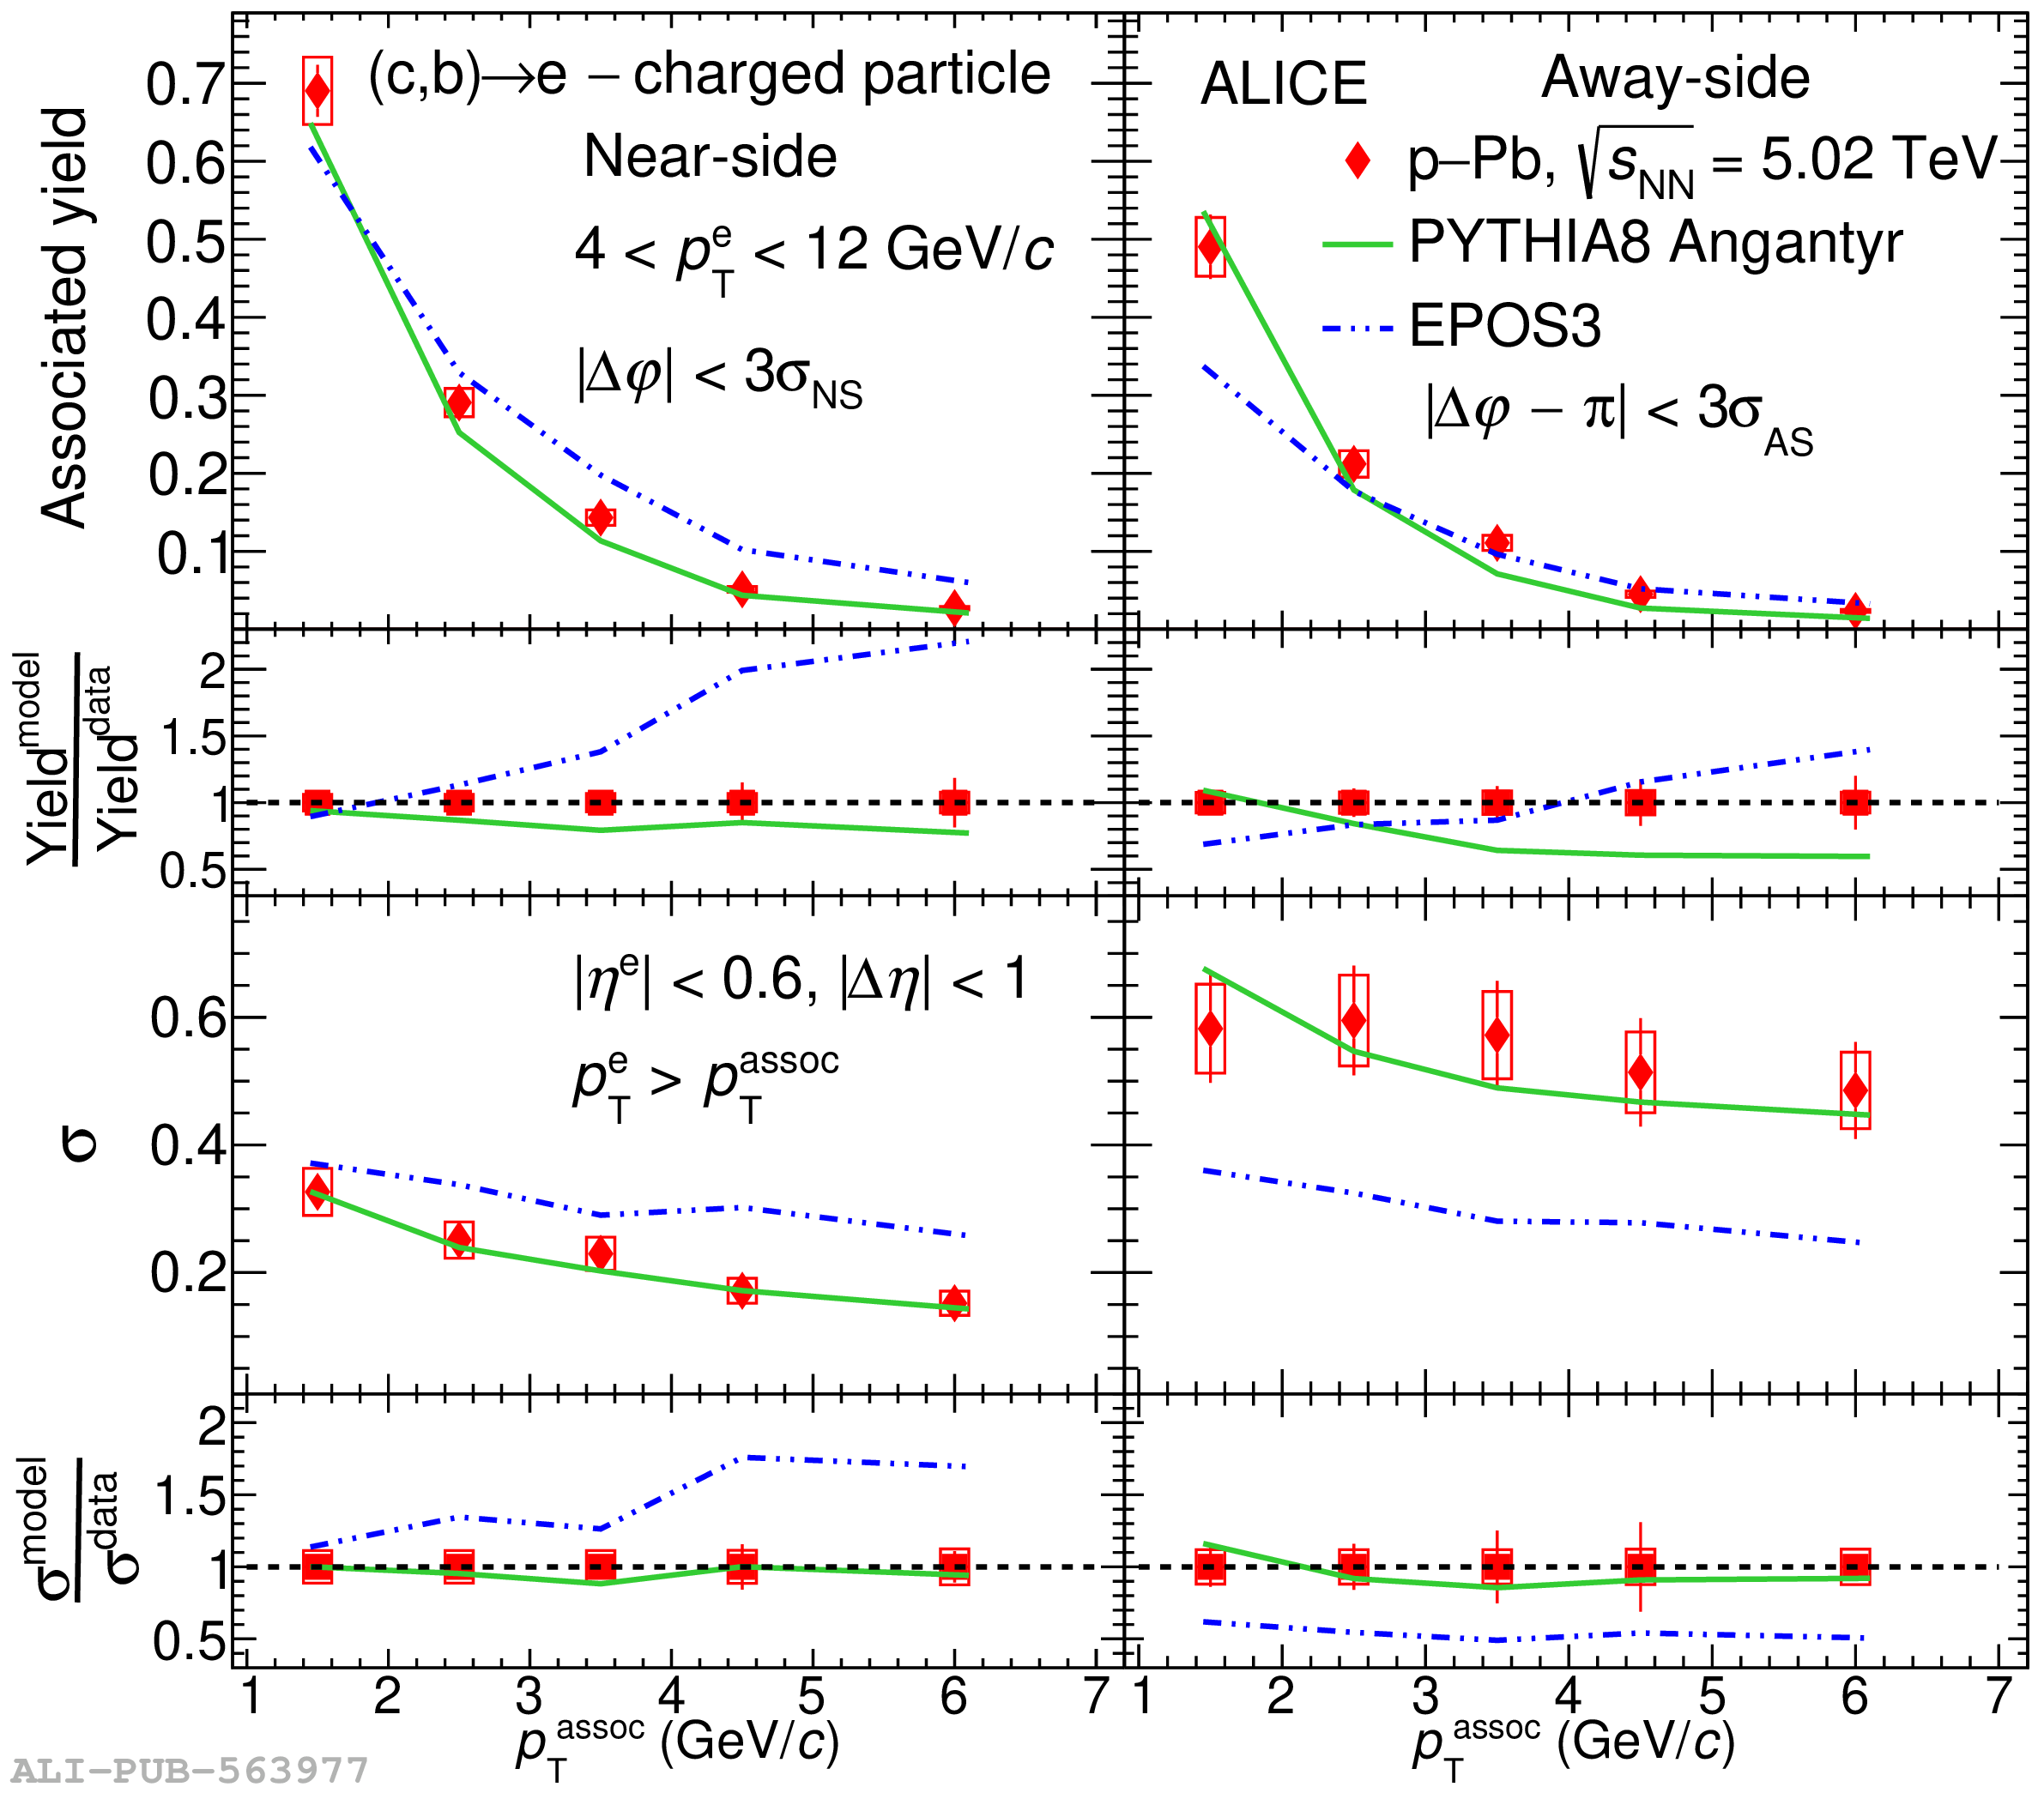 |
Figure 8
Comparison of NS and AS per-trigger yields (first row) and widths (third row) for two $p_{\rm T}^{\rm{e}}$ ranges $4 < p_{\rm T}^{\rm e} < 7$ GeV/$c$ and $7 < p_{\rm T}^{\rm e} < 16$ GeV/$c$, as a function of $p_{\rm T}^{\rm{assoc}}$ in pp collisions. The ratios between the $7 < p_{\rm T}^{\rm e} < 16$ GeV/$c$ and $4 < p_{\rm T}^{\rm e} < 7$ GeV/$c$ yields and widths are shown in the second and fourth rows, respectively. The data are compared with PYTHIA8 Monash and EPOS3 predictions. The statistical (systematic) uncertainties are shown as vertical lines (empty boxes). |  |
Figure 9
Comparison of NS and AS per-trigger yields (first row) and widths (third row) for two $p_{\rm T}^{\rm{e}}$ ranges $4 < p_{\rm T}^{\rm e} < 7$ GeV/$c$ and $7 < p_{\rm T}^{\rm e} < 16$ GeV/$c$, as a function of $p_{\rm T}^{\rm{assoc}}$ in p-Pb collisions. The ratios between the $7 < p_{\rm T}^{\rm e} < 16$ GeV/$c$ and $4 < p_{\rm T}^{\rm e} < 7$ GeV/$c$ yields and widths are shown in the second and fourth rows, respectively. The data are compared with PYTHIA8 Angantyr and EPOS3 predictions. The statistical (systematic) uncertainties are shown as vertical lines (empty boxes). | 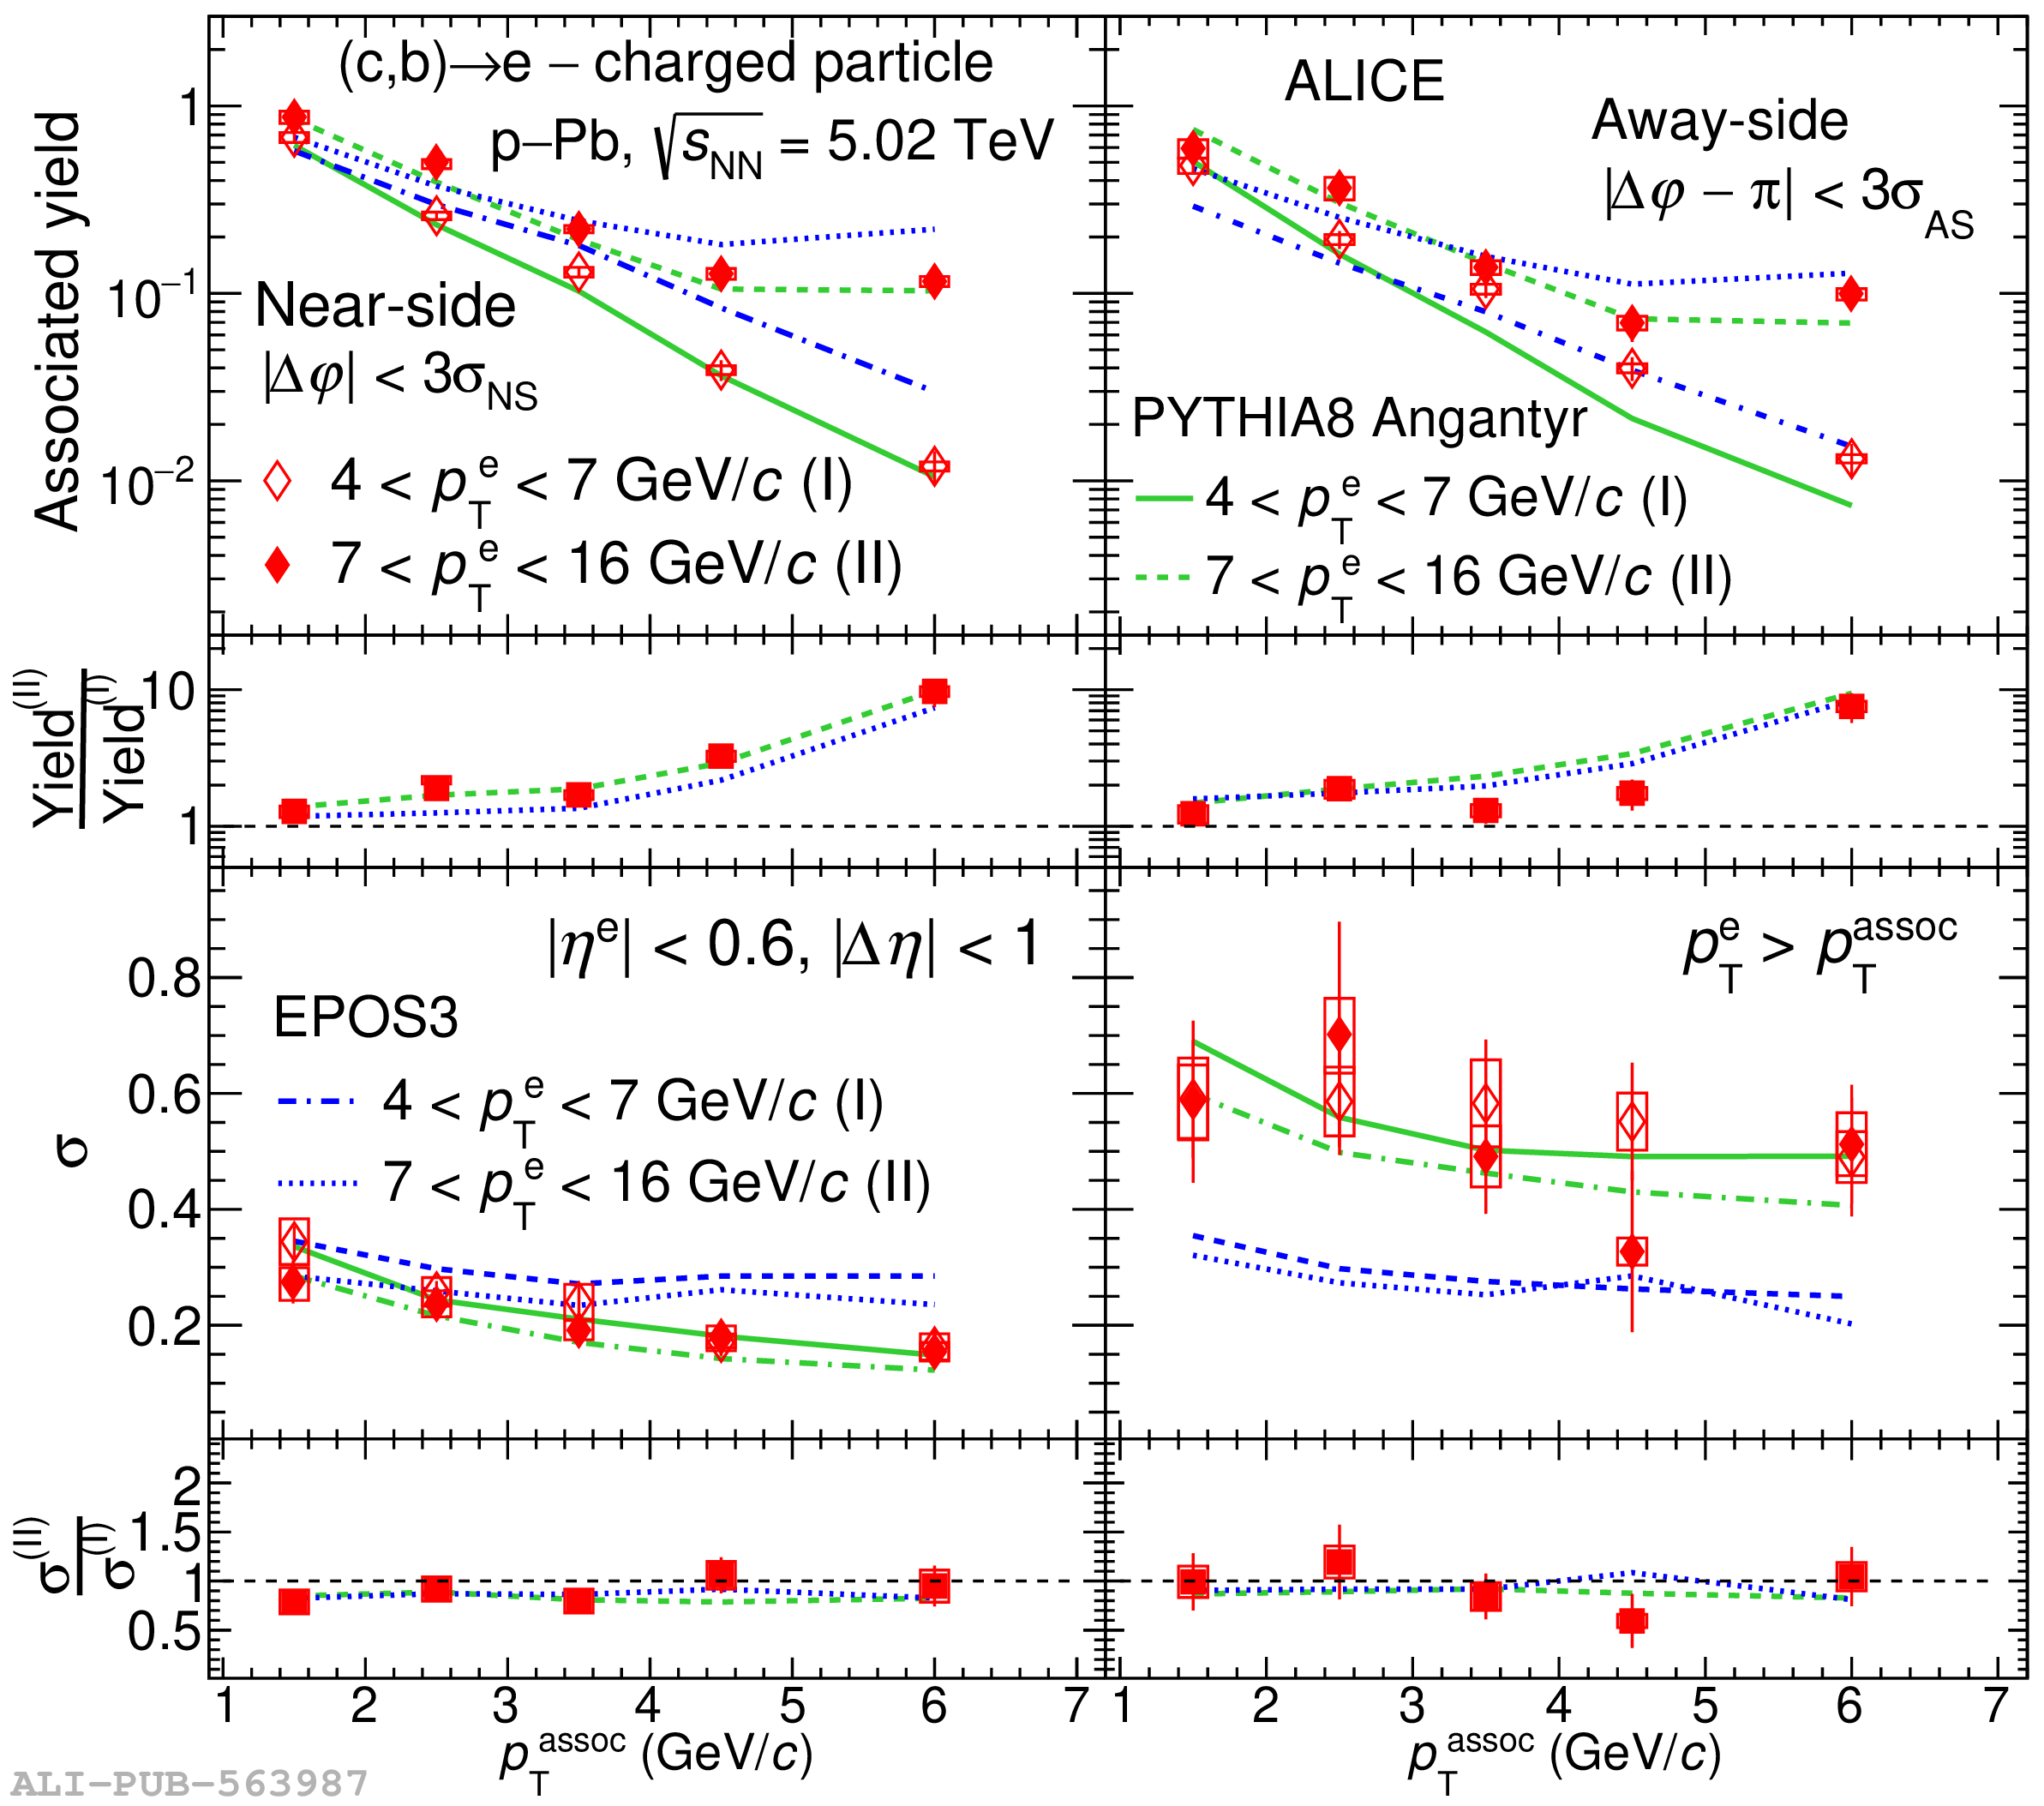 |
Figure 10
Comparison of PYTHIA8 Monash prediction for NS and AS per-trigger yields (first row) and widths (third row) in the two $p_{\rm T}^{\rm{e}}$ ranges $4 < p_{\rm T}^{\rm e} < 7$ GeV/$c$ and $7 < p_{\rm T}^{\rm e} < 16$ GeV/$c$ for electrons from charm- and beauty-hadron decays, as a function of $p_{\rm T}^{\rm{assoc}}$ in pp collisions. The ratios to c, b $\rightarrow$ e yields and widths are shown in the second and fourth rows, respectively. The statistical uncertainties are shown as vertical lines. | 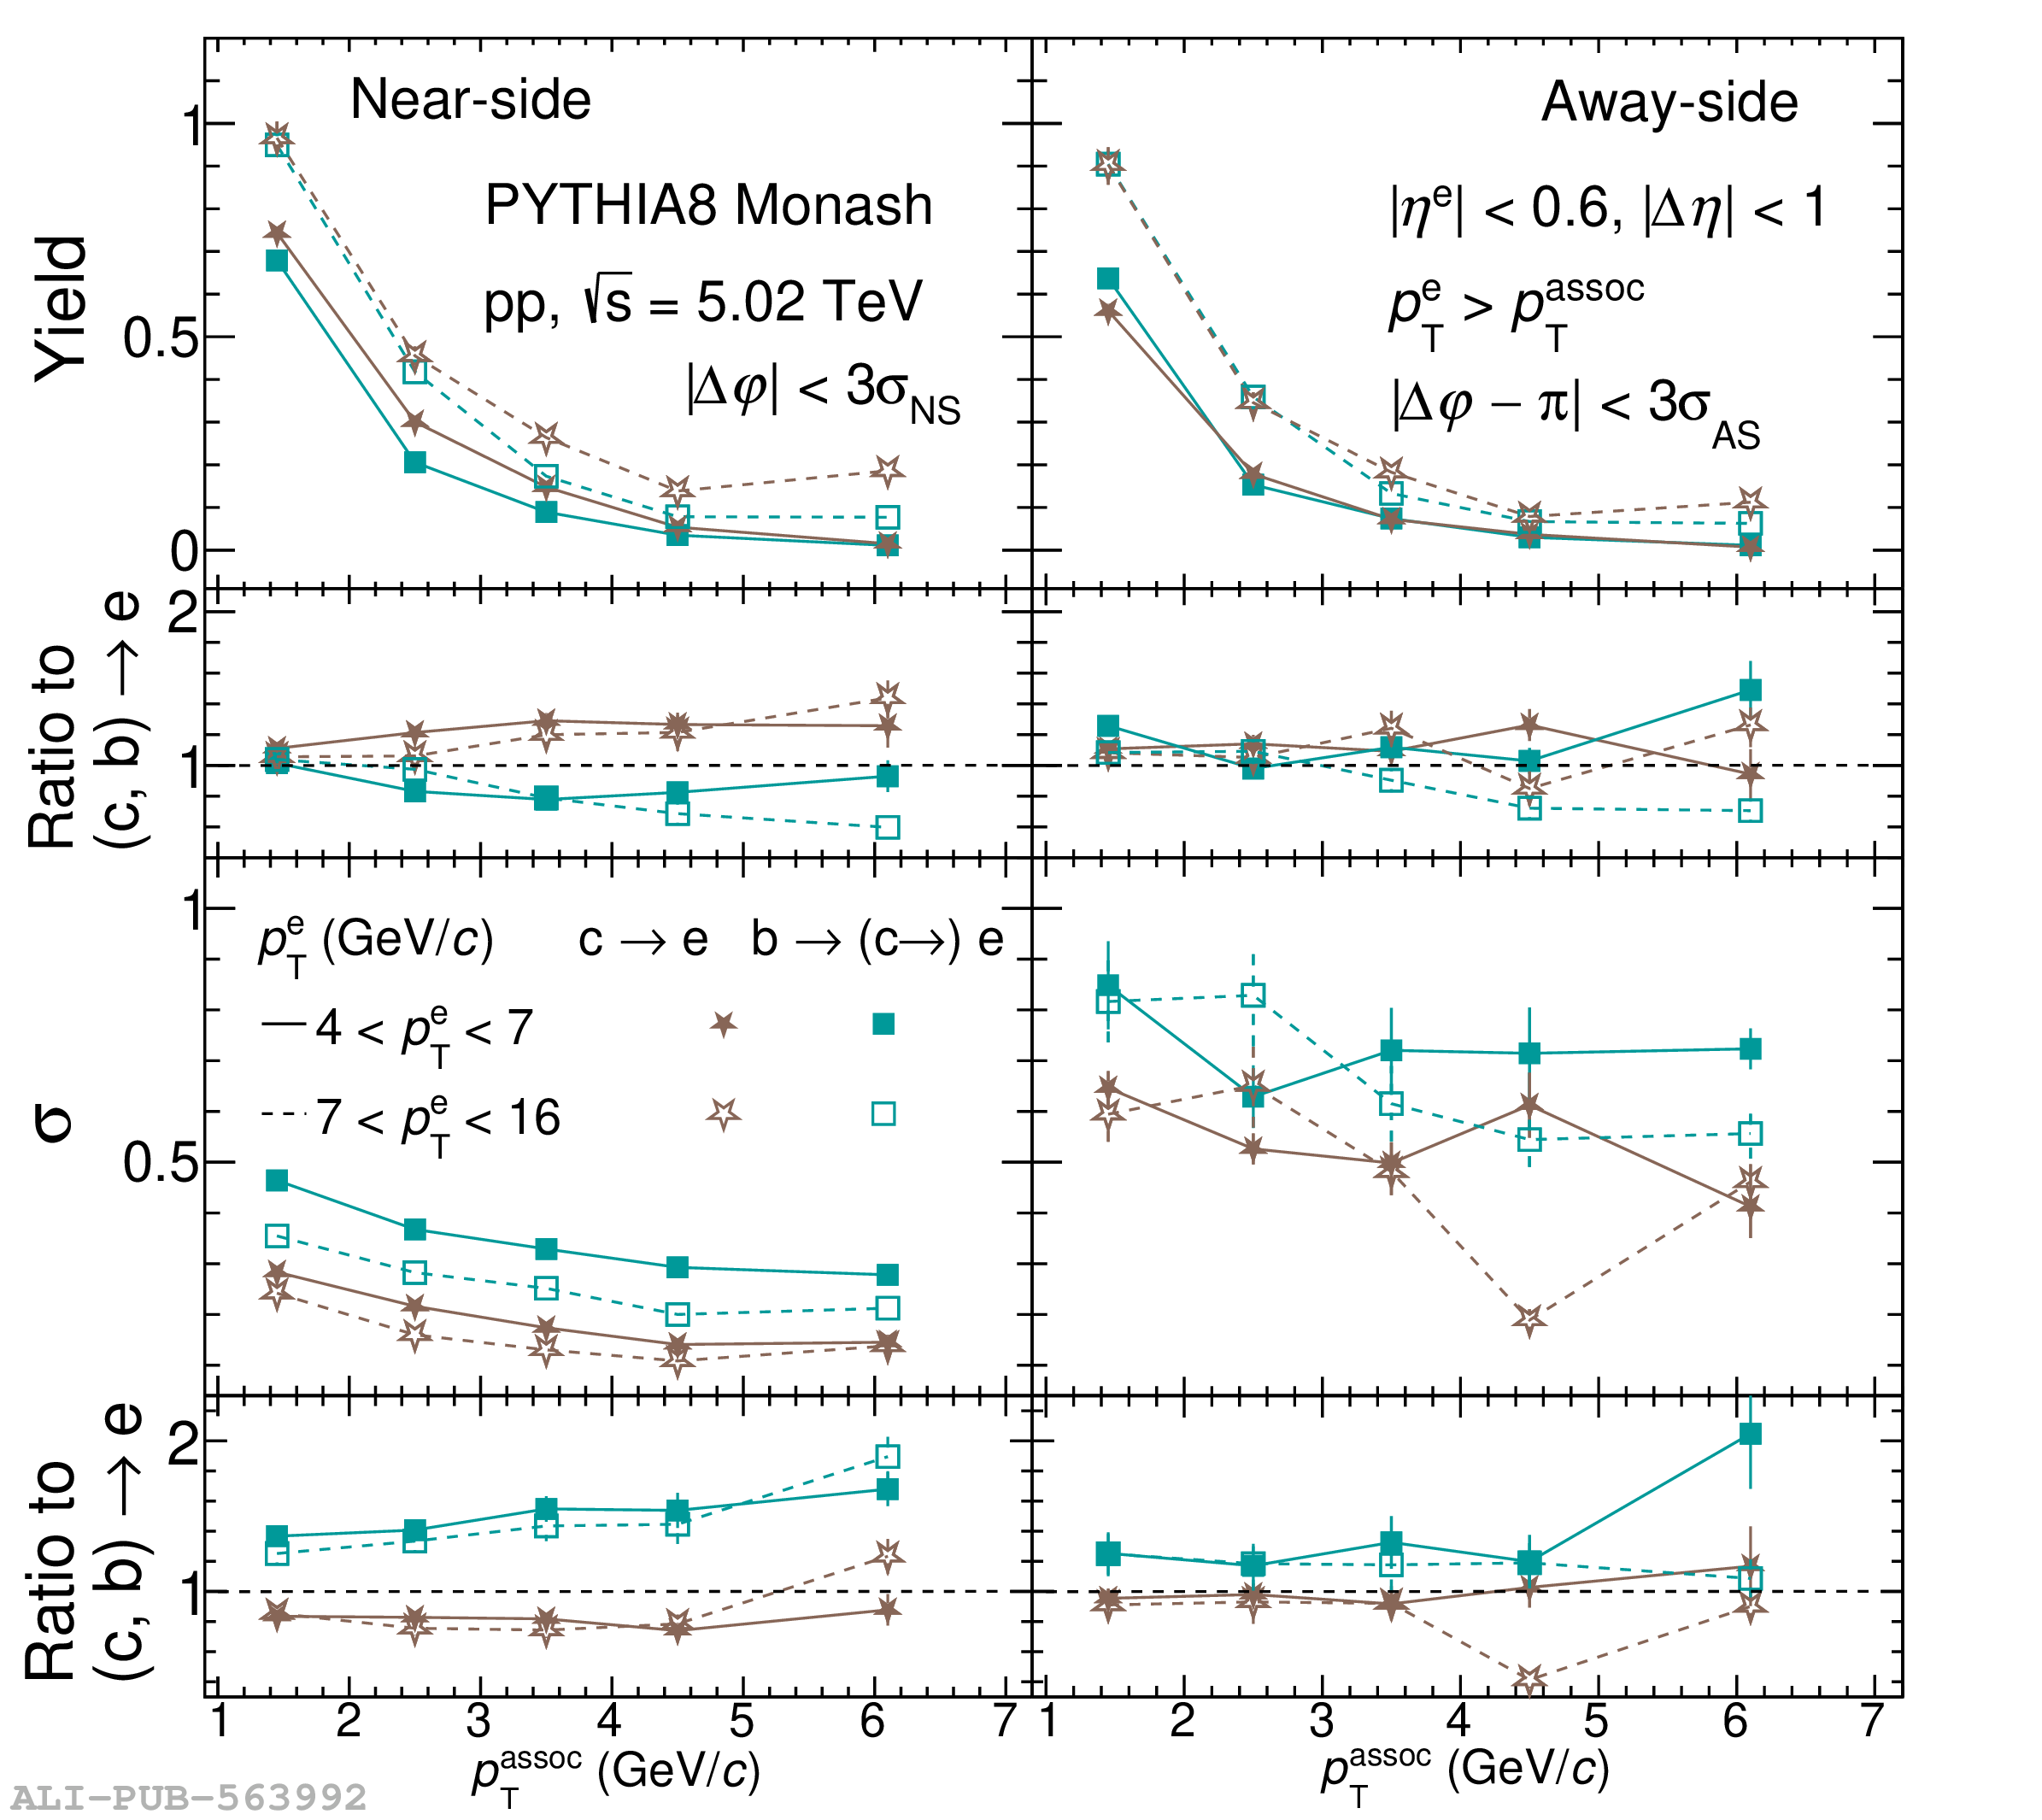 |
Figure A.2
Azimuthal-correlation distributions after baseline subtraction for two $p_{\rm T}^{\rm e}$ intervals, $4 < p_{\rm T}^{\rm e} < 7$ GeV/$c$ and $7 < p_{\rm T}^{\rm e} < 16$ GeV/$c$, and for different associated $\pt$ ranges within $1 < p_{\rm T}^{\rm{assoc}} < 7$ GeV/$c$ compared with predictions from PYTHIA8 Monash and EPOS3 in pp collisions at $\sqrt{s} =$ 5.02 TeV. The statistical (systematic) uncertainties are shown as vertical lines (empty boxes). The uncertainties of the baseline are shown as solid boxes at $\Delta \varphi \sim 0$ rad. | 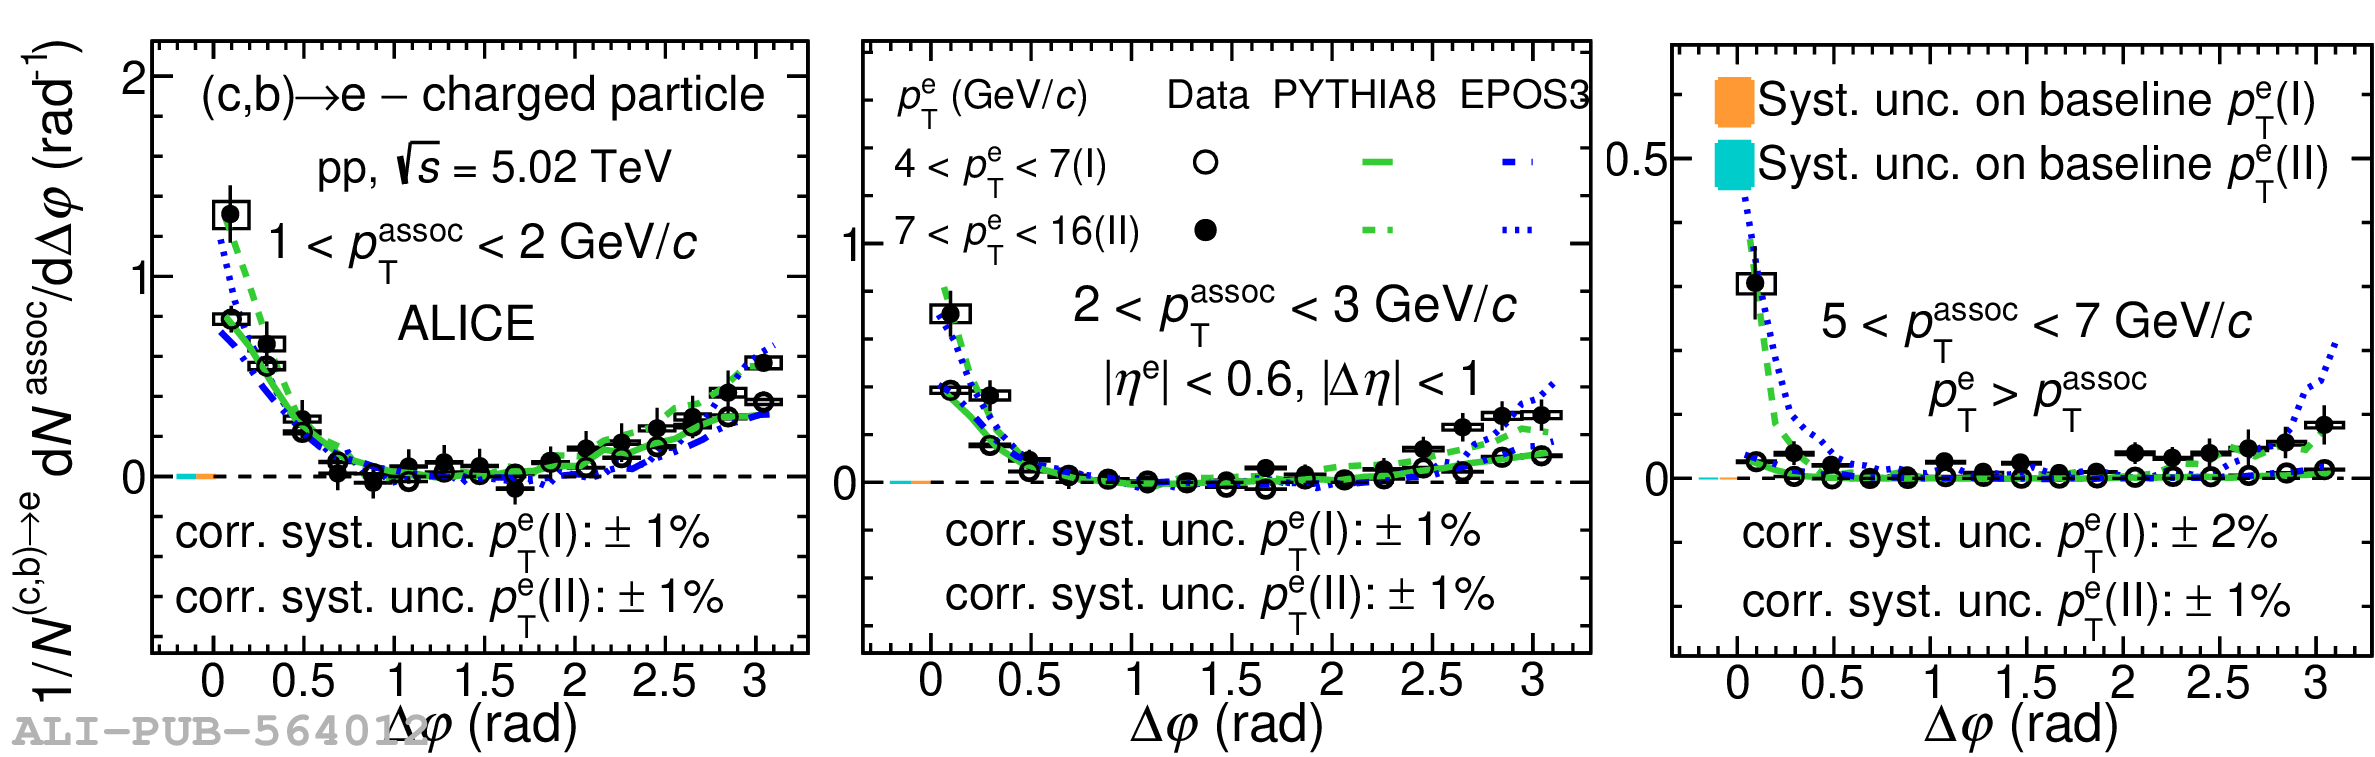 |
Figure A.3
Azimuthal-correlation distributions after baseline subtraction for two $p_{\rm T}^{\rm e}$ intervals, $4 < p_{\rm T}^{\rm e} < 7$ GeV/$c$ and $7 < p_{\rm T}^{\rm e} < 16$ GeV/$c$, and for different associated $\pt$ ranges within $1 < p_{\rm T}^{\rm{assoc}} < 7$ GeV/$c$ compared with predictions from PYTHIA8 Angantyr and EPOS3 in p-Pb collisions at $\sqrt{s_{\rm{NN}}} =$ 5.02 TeV. The statistical (systematic) uncertainties are shown as vertical lines (empty boxes). The uncertainties of the baseline are shown as solid boxes at $\Delta \varphi \sim 0$ rad. |  |
Figure B.1
Azimuthal-correlation distributions after baseline subtraction for $4 < p_{\rm T}^{\rm e} < 12$ GeV/$c$ and for different associated $\pt$ ranges in pp collisions at $\sqrt{s} = 5.02$ TeV and p-Pb collisions at $\sqrt{s_{\rm{NN}}} = 5.02$ TeV. The statistical (systematic) uncertainties are shown as vertical lines (empty boxes). The uncertainties of the baseline are shown as solid boxes at $\Delta\varphi \sim$ -2 rad. | 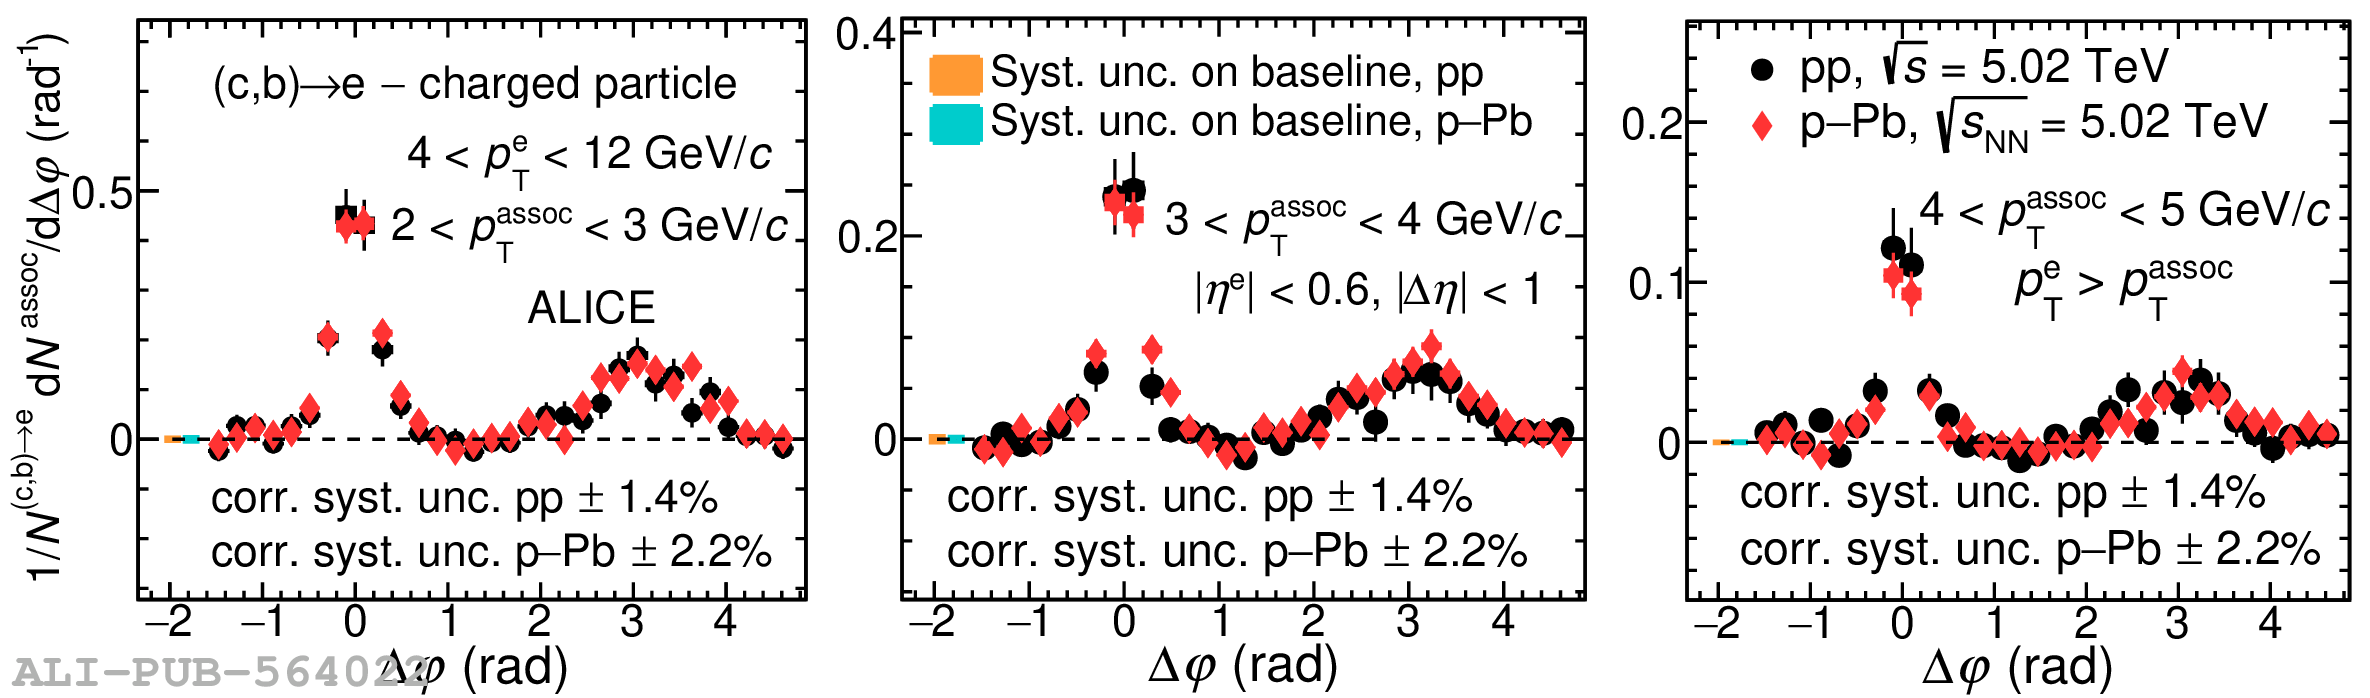 |
Figure B.2
Azimuthal-correlation distributions after baseline subtraction for $4 < p_{\rm T}^{\rm e} < 12$ GeV/$c$ in different $p_{\rm T}^{\rm{assoc}}$ ranges compared with predictions from PYTHIA8 Monash and EPOS3 in pp collisions at $\sqrt{s} =$ 5.02 TeV. The statistical (systematic) uncertainties are shown as vertical lines (empty boxes). The uncertainties of the baseline are shown as solid boxes at $\Delta \varphi \sim 0$ rad. | 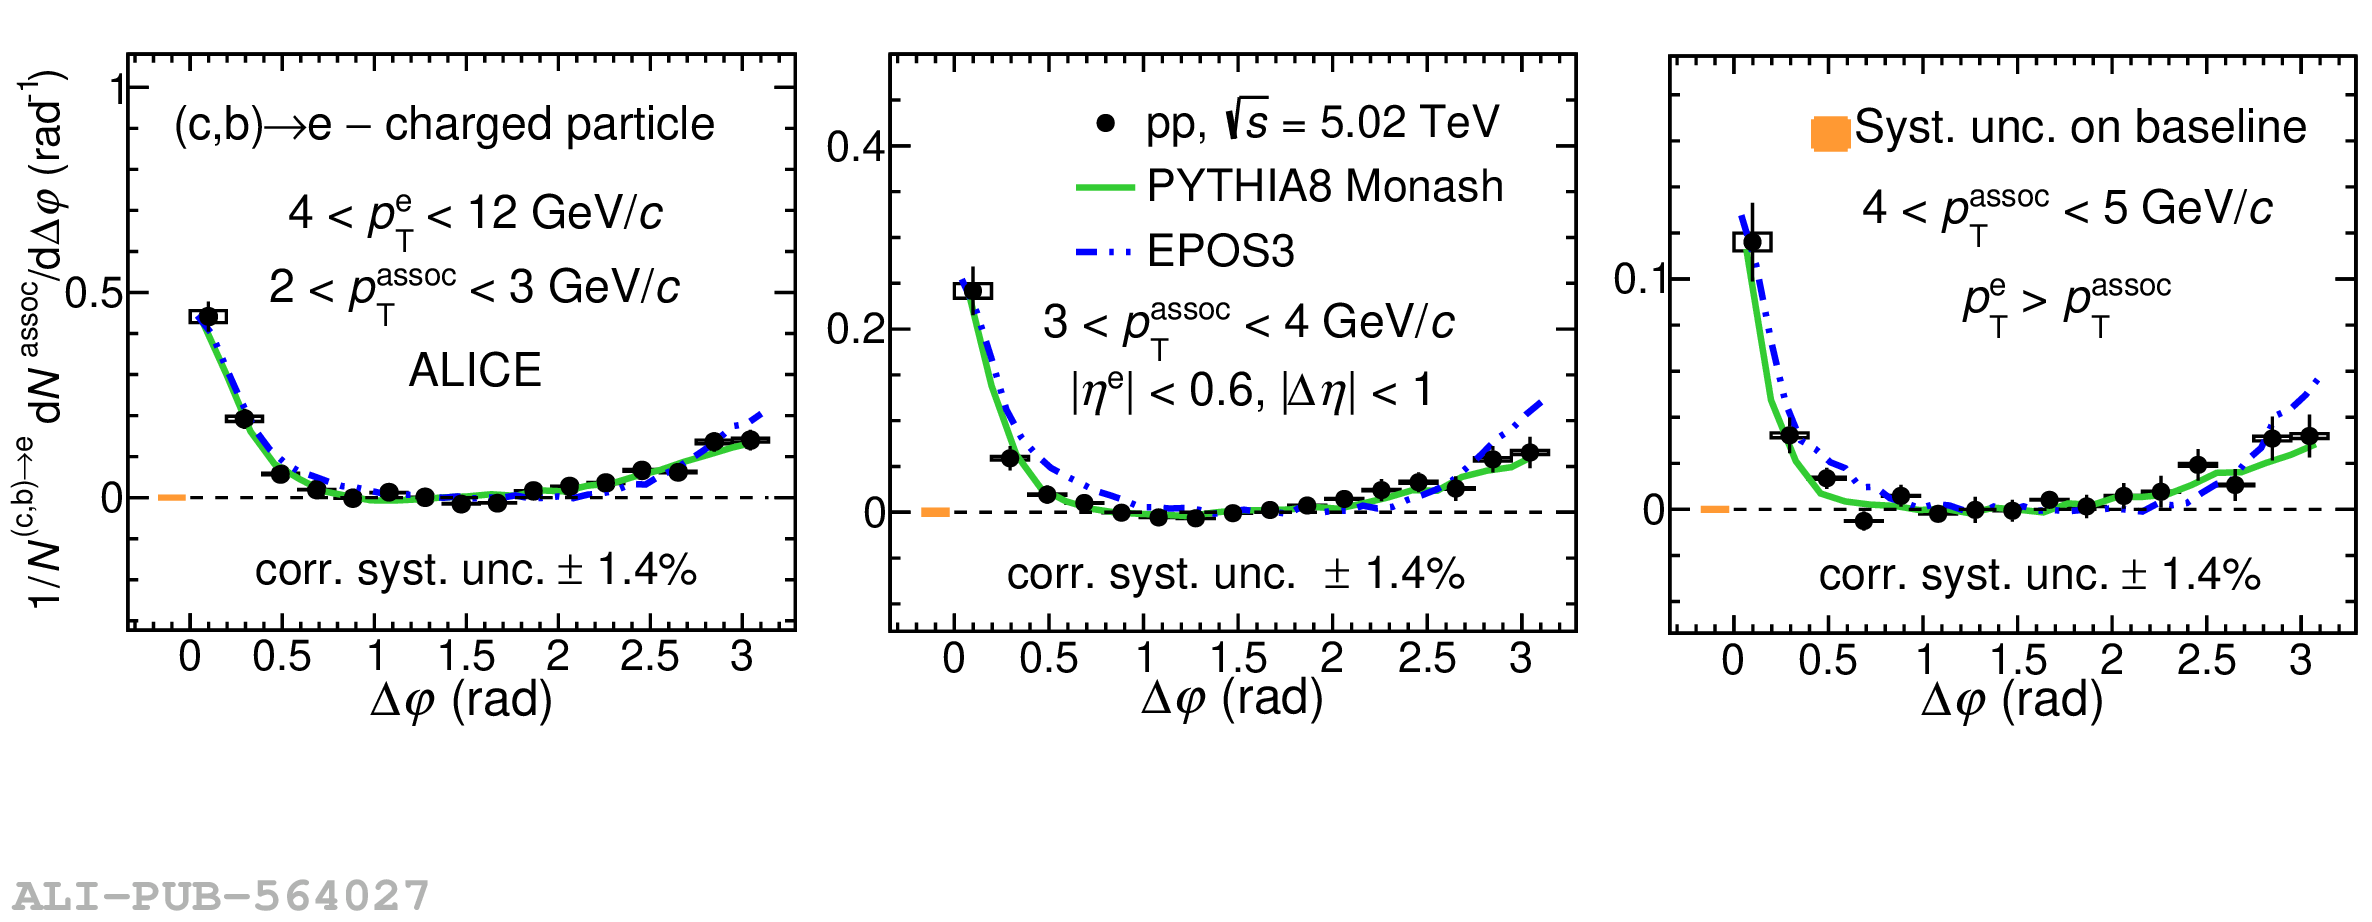 |
Figure B.3
Azimuthal-correlation distributions after baseline subtraction for $4 < p_{\rm T}^{\rm e} < 12$ GeV/$c$ in different $p_{\rm T}^{\rm{assoc}}$ ranges compared with predictions from PYTHIA8 Angantyr and EPOS3 in p-Pb collisions at $\sqrt{s_{\rm{NN}}} =$ 5.02 TeV. The statistical (systematic) uncertainties are shown as vertical lines (empty boxes). The uncertainties of the baseline are shown as solid boxes at $\Delta \varphi \sim 0$ rad. | 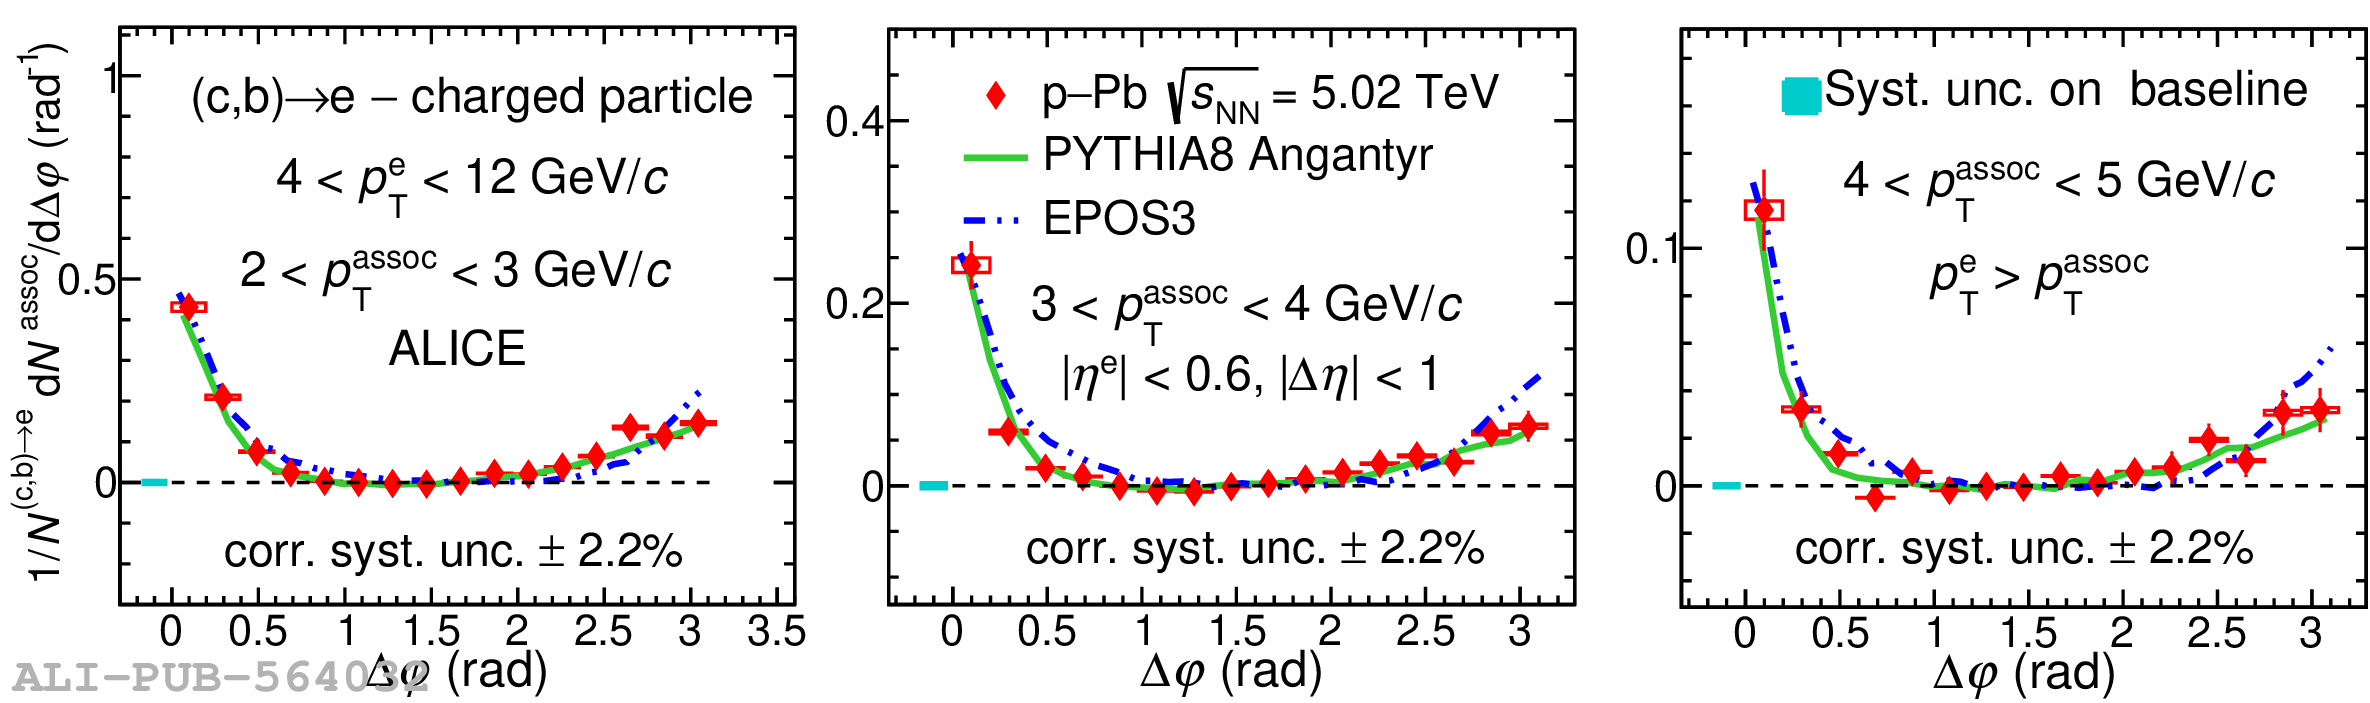 |
Figure B.4
Azimuthal-correlation distributions after baseline subtraction for two $p_{T}^{\rm e}$ intervals, $4 < p_{\rm T}^{\rm e} < 7$ GeV/$c$ and $7 < p_{\rm T}^{\rm e} < 16$ GeV/$c$, and for different associated \pt ranges compared with predictions from PYTHIA8 Monash and EPOS3 in pp collisions at $\sqrt{s} =$ 5.02 TeV. The statistical (systematic) uncertainties are shown as vertical lines (empty boxes). The uncertainties of the baseline are shown as solid boxes at $\Delta\varphi \sim 0$ rad. | 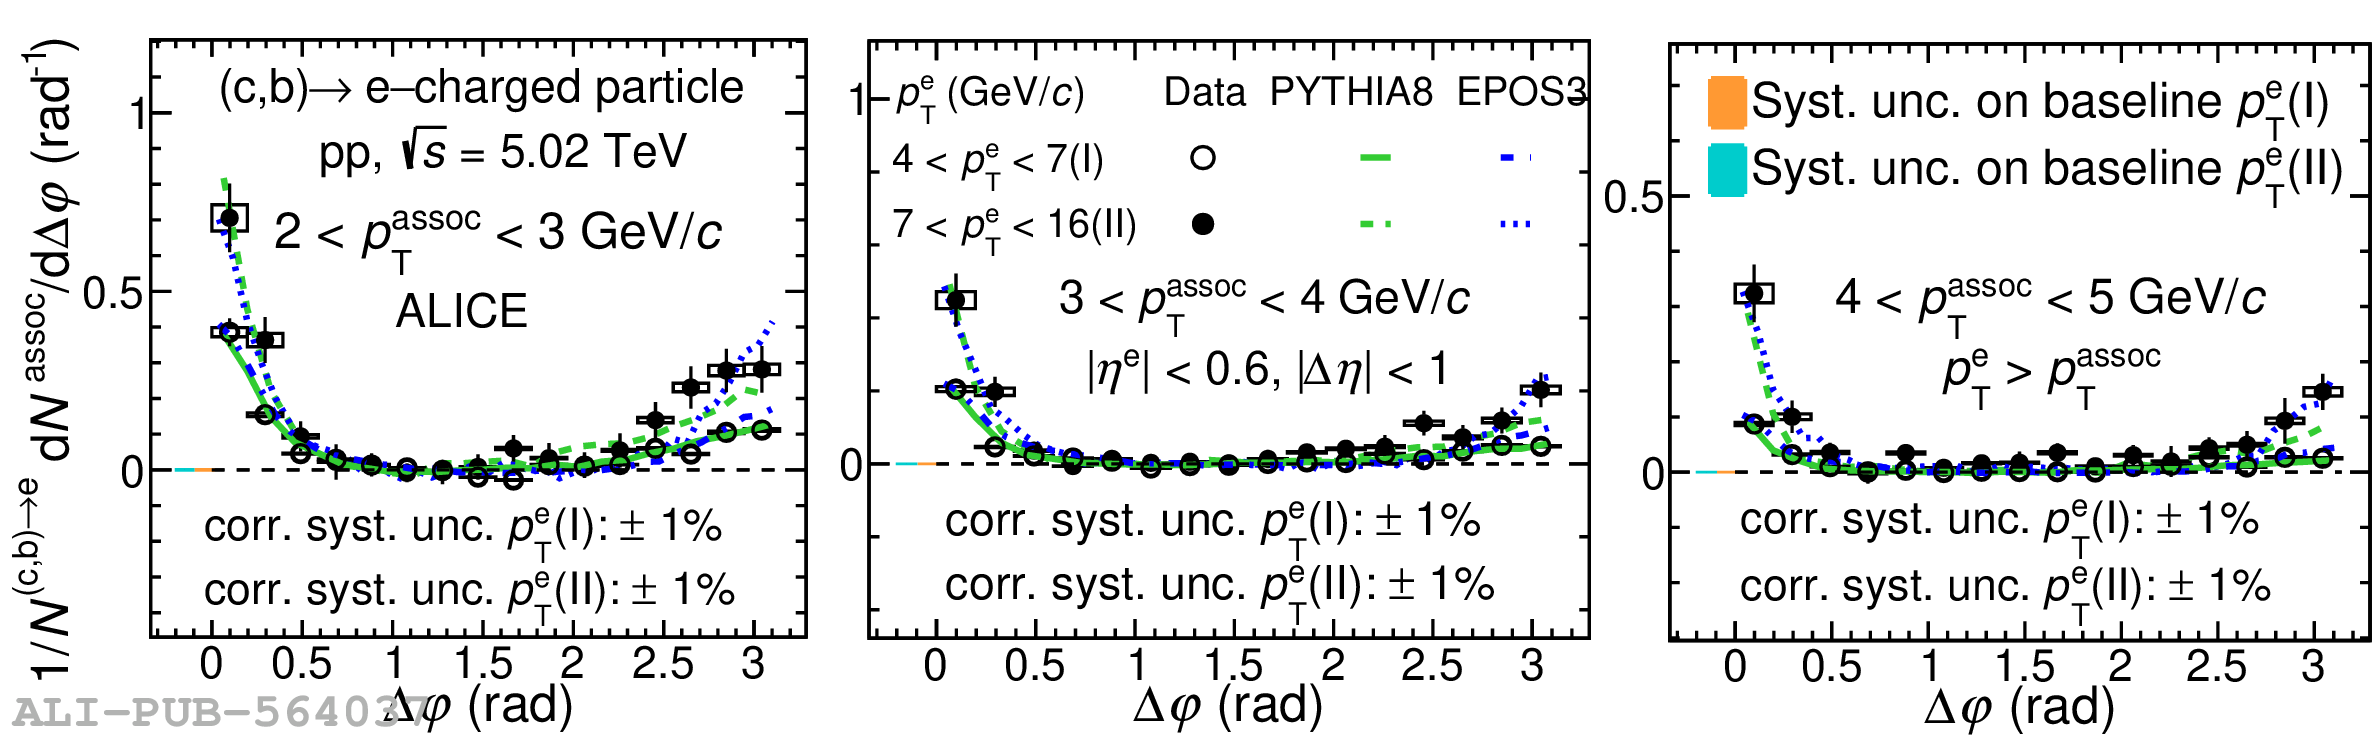 |
Figure B.5
Azimuthal-correlation distributions after baseline subtraction for two $p_{T}^{\rm e}$ intervals, $4 < p_{\rm T}^{\rm e} < 7$ GeV/$c$ and $7 < p_{\rm T}^{\rm e} < 16$ GeV/$c$, and for different associated $\pt$ ranges compared with predictions from PYTHIA8 Angantyr and EPOS3 in p-Pb collisions at $\sqrt{s_{\rm{NN}}} =$ 5.02 TeV. The statistical (systematic) uncertainties are shown as vertical lines (empty boxes). The uncertainties of the baseline are shown as solid boxes at $\Delta\varphi \sim 0$ rad. | 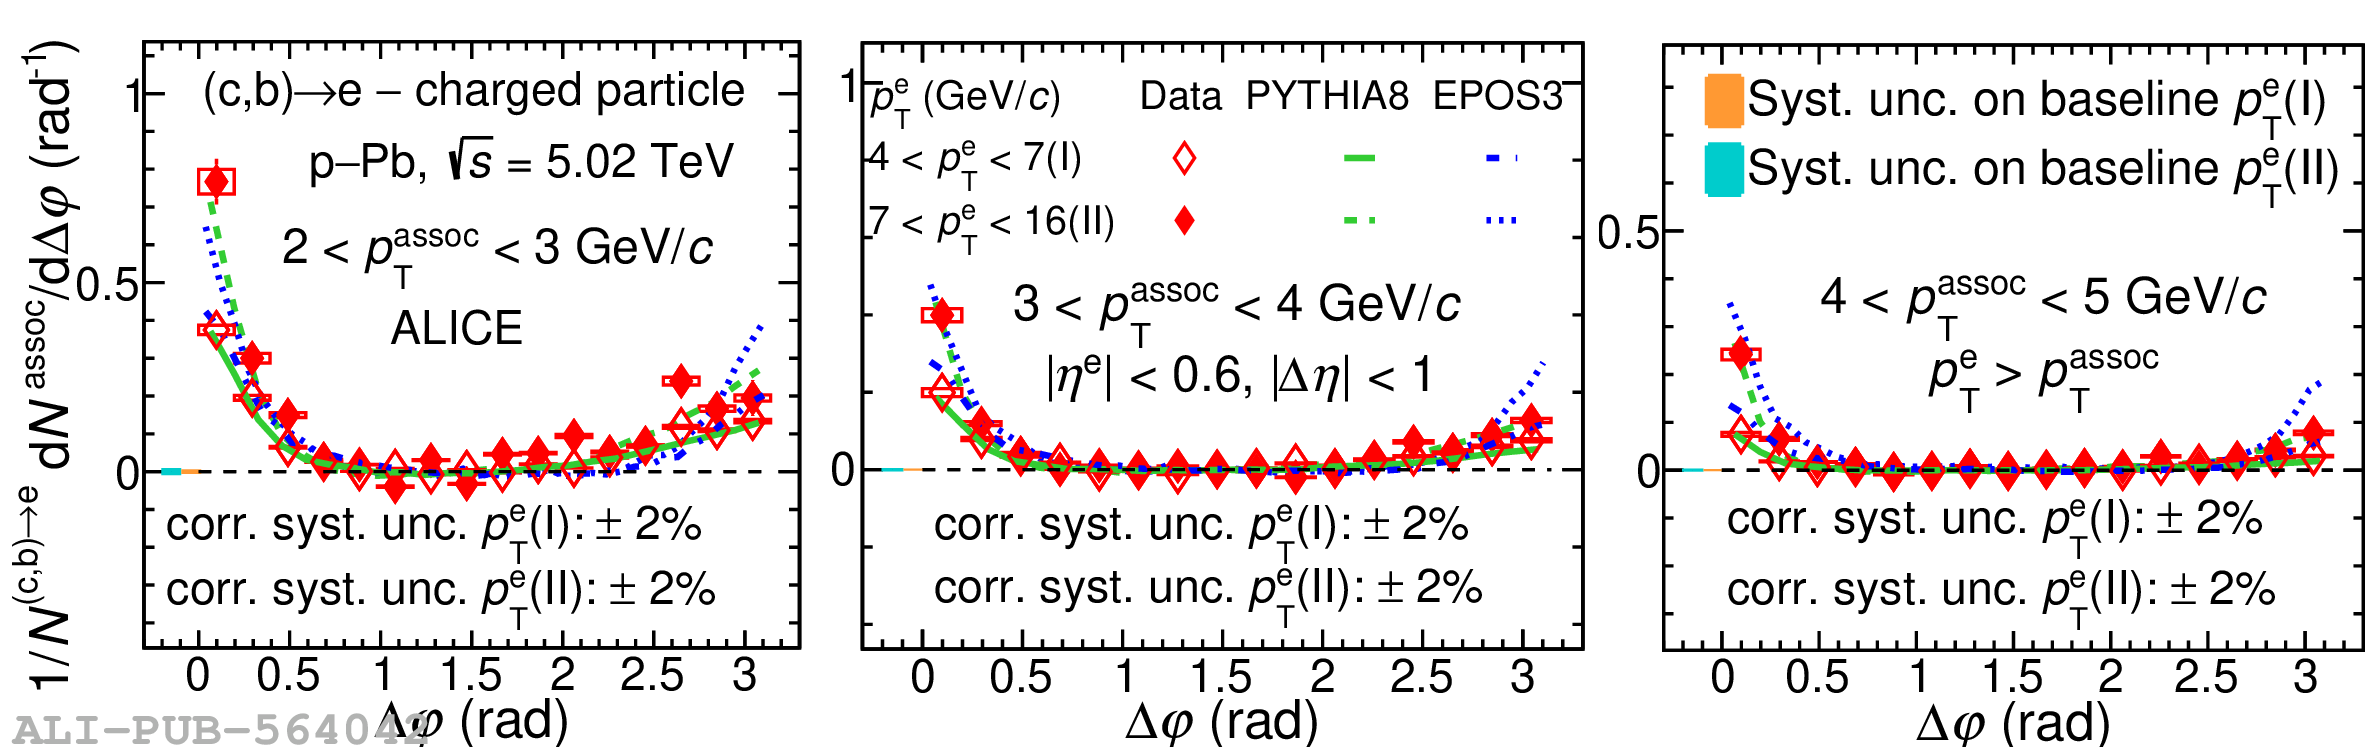 |