Near- and away-side per-trigger yields (first row) and widths (third row) as a function of $\pt^{\rm{assoc}}$ for $4 < \pt^{\rm e} < 12$ \GeVc compared with predictions from PYTHIA8 Angantyr and EPOS3 in p--Pb collisions at $\sqrt{s_{\rm{NN}}} = 5.02$ TeV. The ratios between model predictions and data are shown in the second and fourth row for the yields and widths, respectively. The statistical (systematic) uncertainties are shown as vertical lines (empty boxes). | 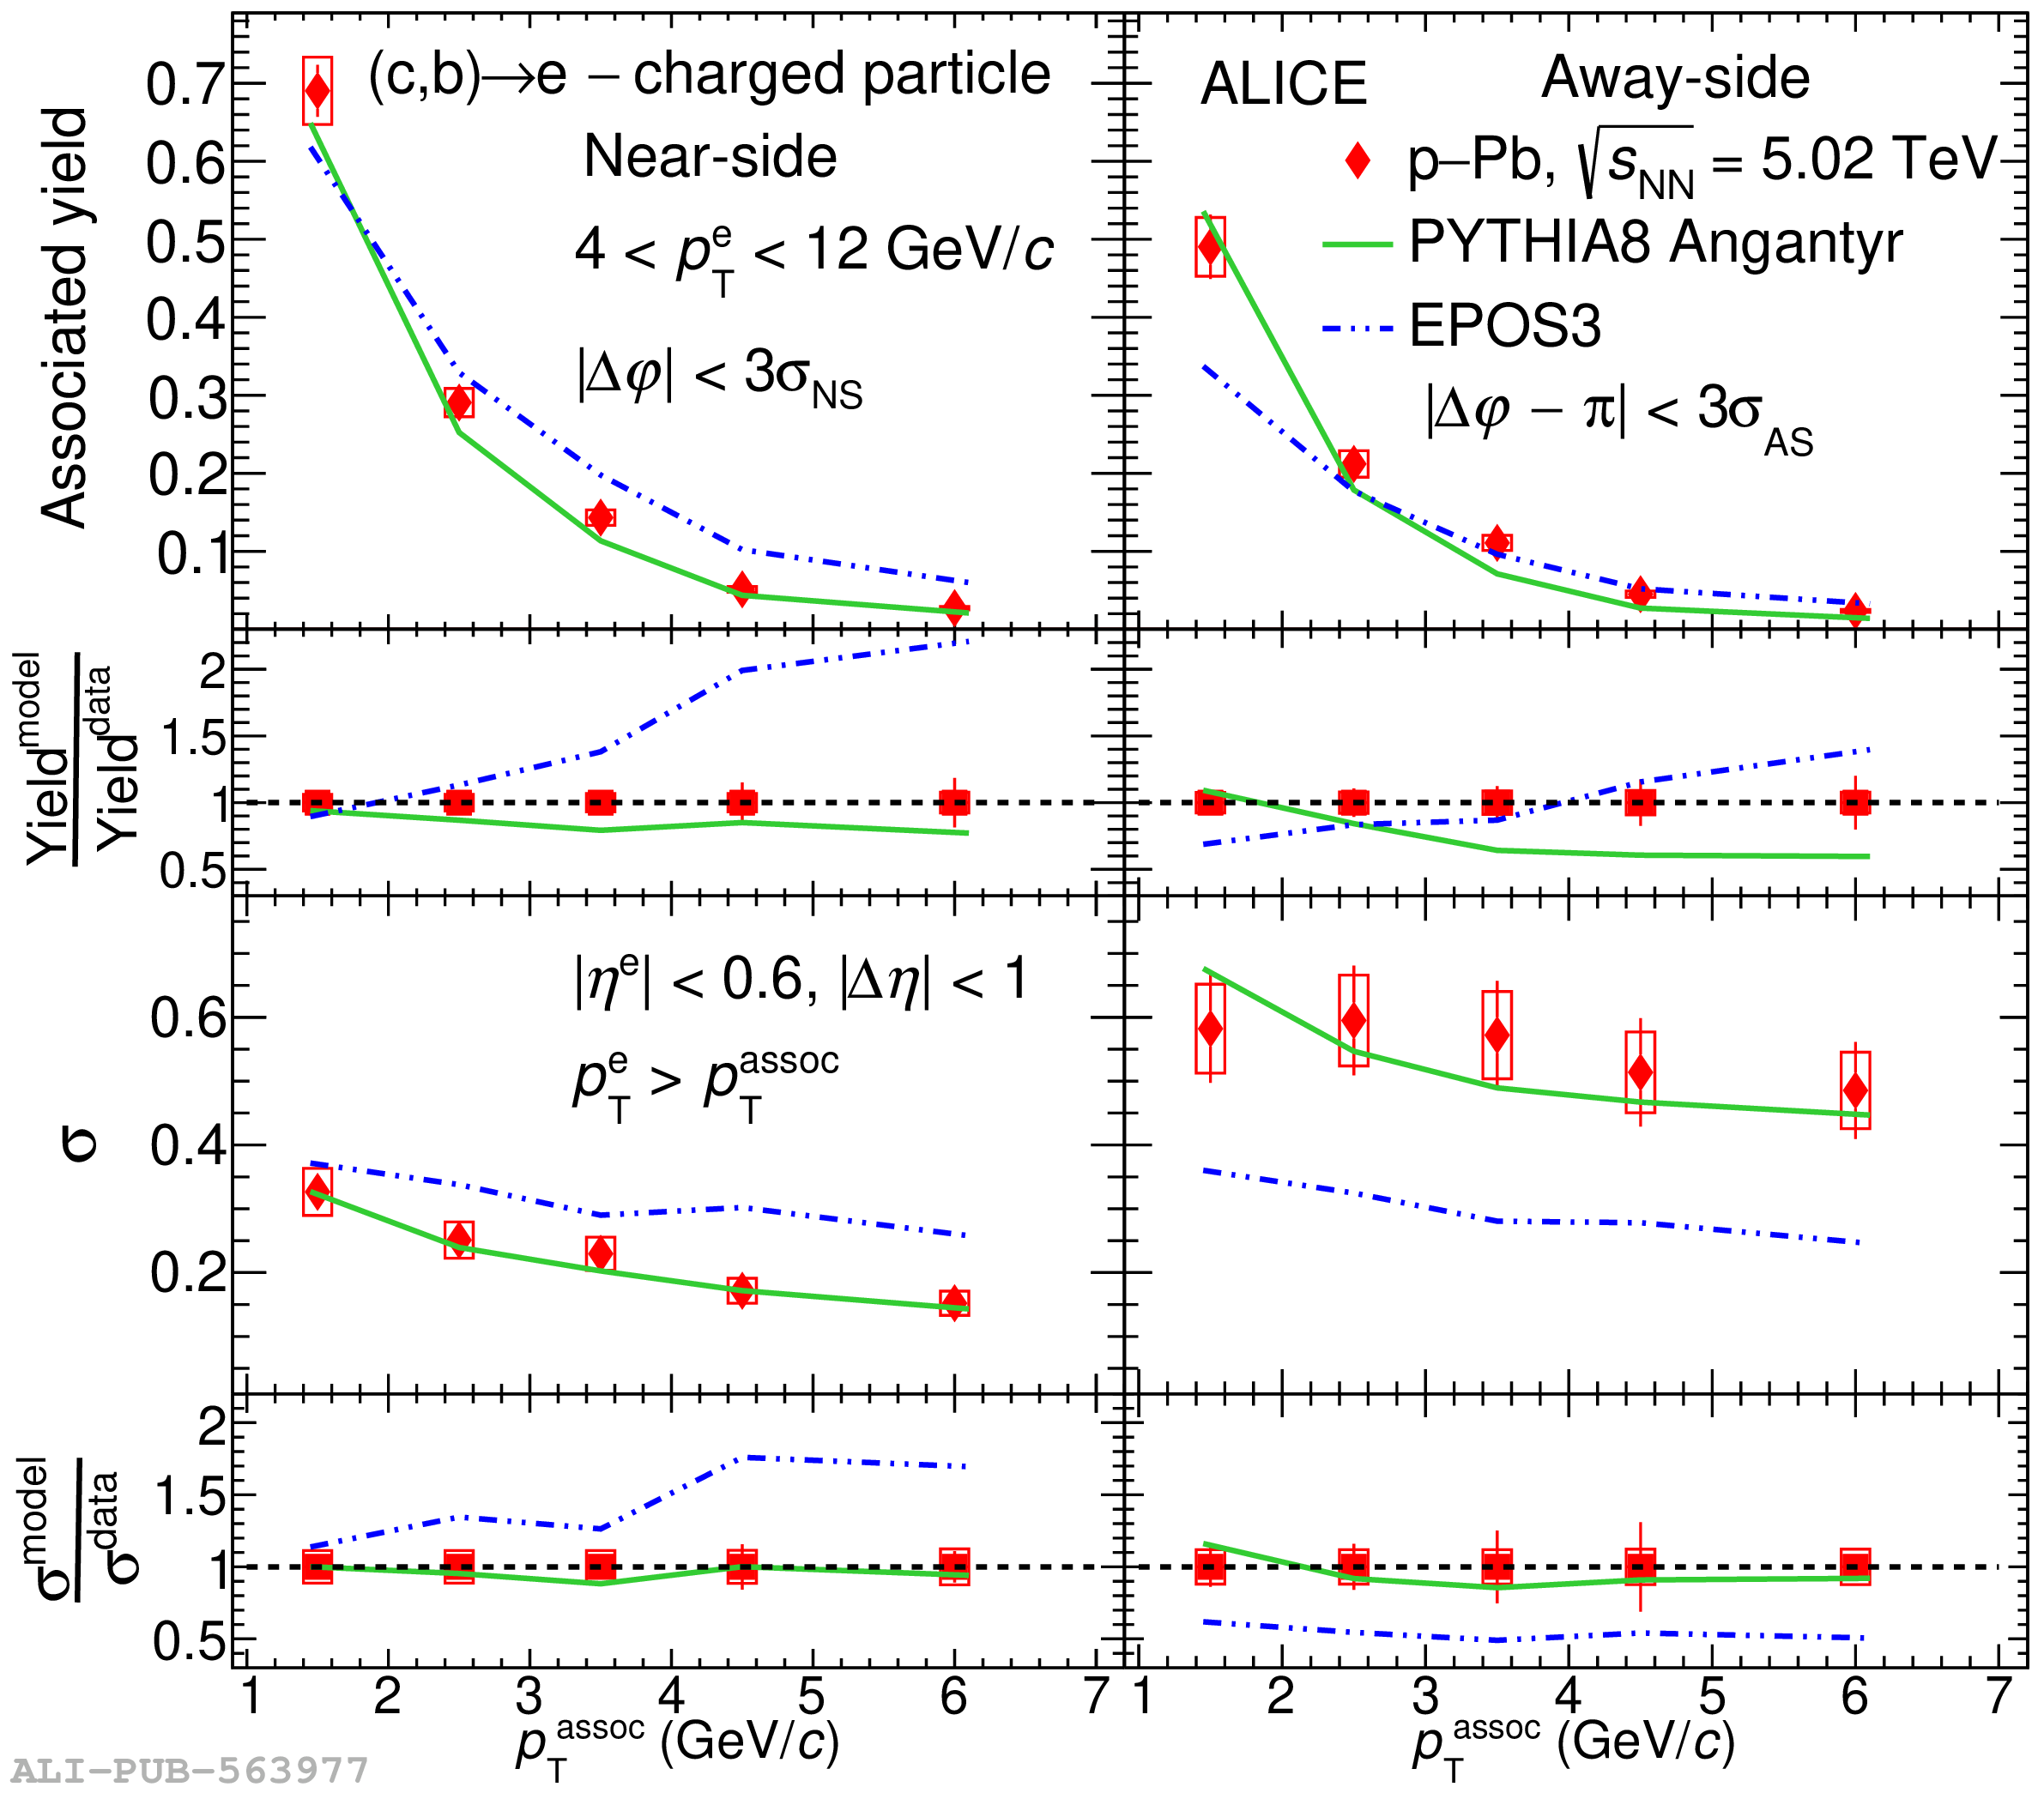 |