The azimuthal-correlation distribution for $4 < \pt^{\rm e} < 12$ \GeVc fitted with a constant function for the baseline (green line) and von Mises functions for AS and NS peaks (grey curves) for different associated \pt ranges in pp collisions at $\sqrt{s}= 5.02$ TeV (top panels) and p--Pb collisions at $\sqrt{s_{\rm NN}}= 5.02$ TeV (bottom panels). The statistical (uncorrelated systematic) uncertainties are shown as vertical lines (empty boxes). The uncertainties of the baseline estimation are shown as solid boxes at $\dph \sim -2$ rad. | 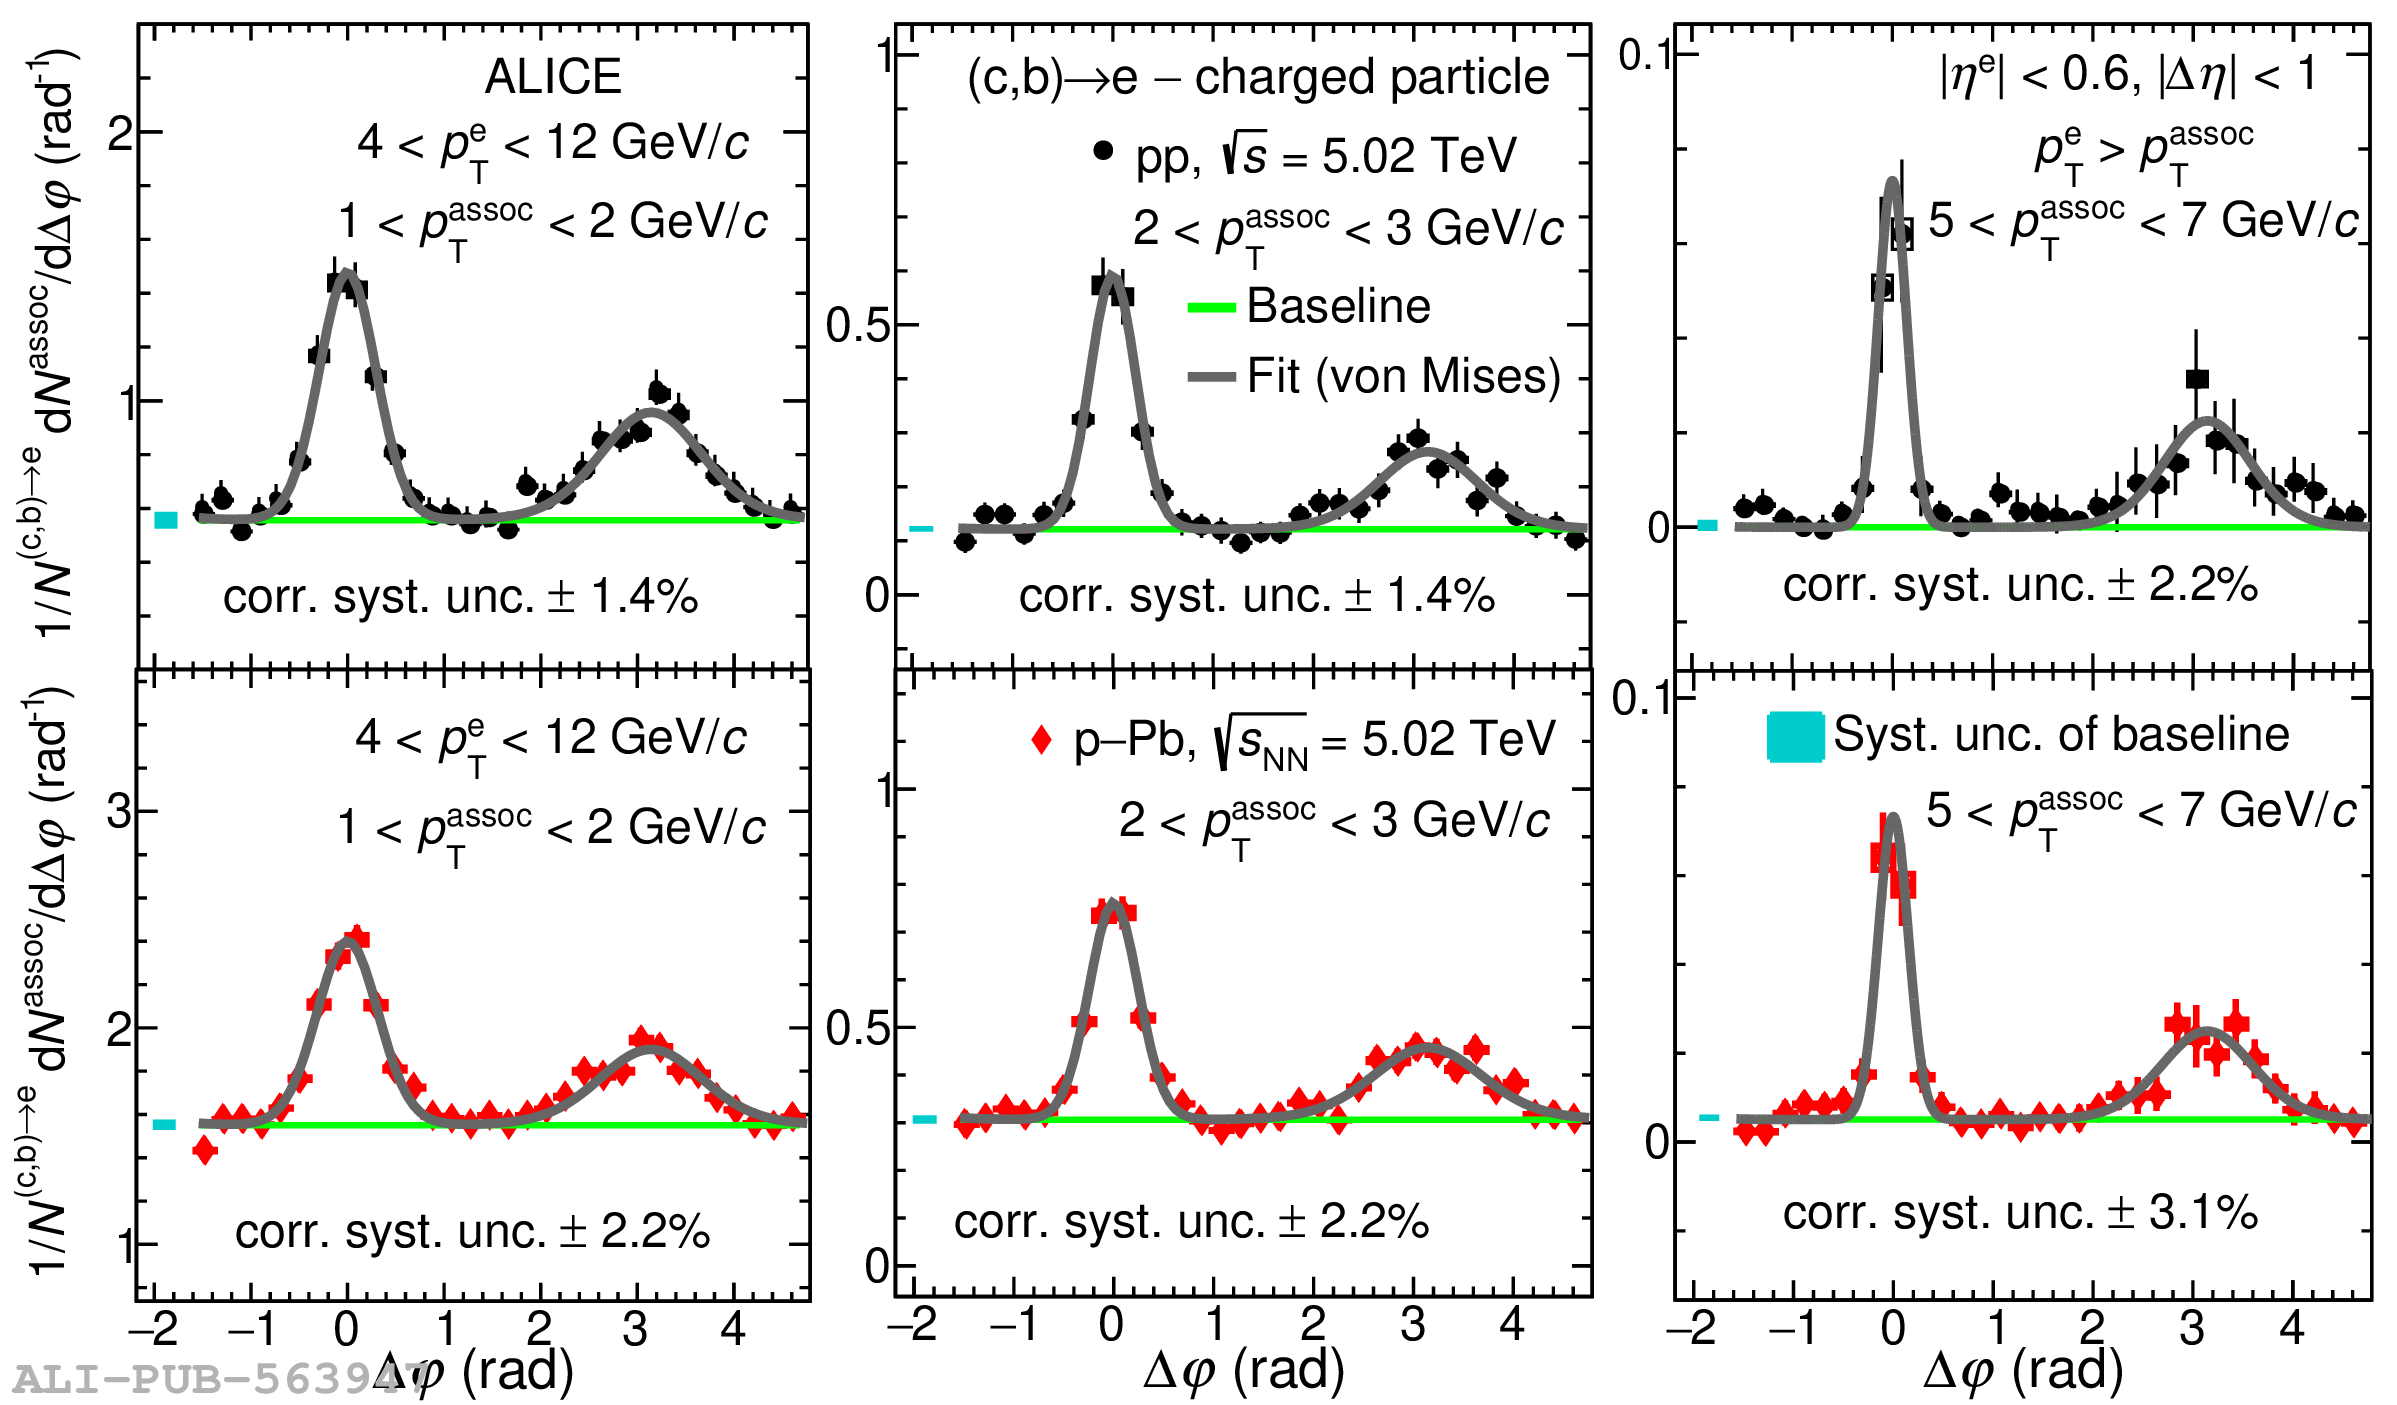 |