Ratios of $v_2/\varepsilon_2$ as a function of $(1/S){\rm d}N_{\rm ch}/{\rm d}\eta$ in Xe-Xe (top panel) and Pb-Pb (middle panel) collisions. The Linear fit functions to $v_2/\varepsilon_2$ in the top and middle panels are shown by lines. The bands show the uncertainty of the fit. (bottom panel) The ratio of $v_2/\varepsilon_2$ to the linear Pb-Pb fits shown in the middle panel. The data points of $v_2\left\{2,|\Delta\eta|>1\right\}$, $v_2\left\{4\right\}$ are shifted by $-0.1$ and $+0.1$ along $(1/S){\rm d}N_{\rm ch}/{\rm d}\eta$ for better visibility. The error bars (open boxes) indicate statistical (systematic) uncertainties. The ZDC scale uncertainty, due to residual correlations in the determination of the denominators in Eq. 11, and the bin-to-bin uncorrelated one are combined for $v_2\left\{\Psi_{\rm SP}\right\}$ (top and middle panels). For the ratio of $v_2\left\{\Psi_{\rm SP}\right\}$ to the Pb-Pb fit (bottom panel), the ZDC scale uncertainty is separated and is shown by the solid boxes on the left side of the bottom panel. The grey box at unity in the bottom panel on the left side shows the variation depending on the TRENTo configuration. The blue horizontal band (bottom panel) represents the relative uncertainties of the individual linear fits to the Pb-Pb data from the middle panel. The red horizontal line (bottom panel) shows a combined fit of a constant function to the Xe-Xe data and its uncertainty. | 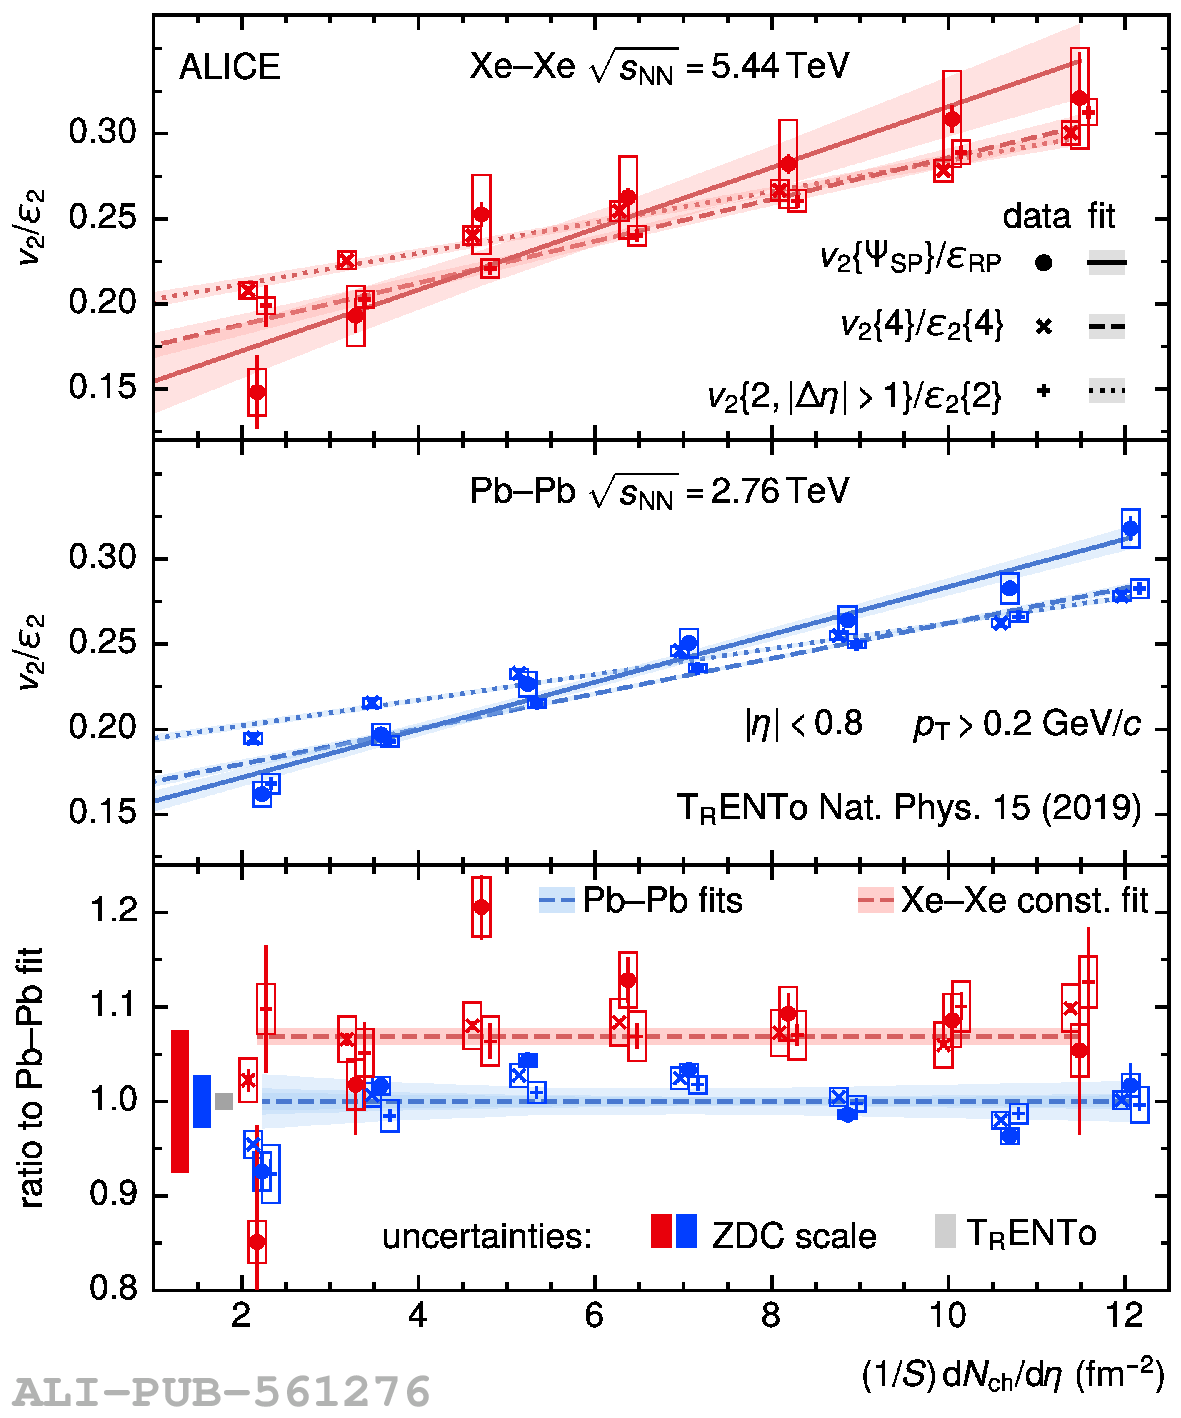 |