Elliptic flow of charged particles at midrapidity relative to the spectator plane in Pb-Pb and Xe-Xe collisions

Measurements of the elliptic flow coefficient relative to the collision plane defined by the spectator neutrons $v_2${$\Psi_{\rm SP}$} in collisions of Pb ions at center-of-mass energy per nucleon-nucleon pair $\sqrt{s_{\rm NN}}$=2.76 TeV and Xe ions at $\sqrt{s_{\rm NN}}$=5.44 TeV are reported. The results are presented for charged particles produced at midrapidity as a function of centrality and transverse momentum. The ratio between $v_2${$\Psi_{\rm SP}$} and the elliptic flow coefficient relative to the participant plane $v_2${4}, estimated using four-particle correlations, deviates by up to 20% from unity depending on centrality. This observation differs strongly from the magnitude of the corresponding eccentricity ratios predicted by the TRENTo and the elliptic power models of initial state fluctuations that are tuned to describe the participant plane anisotropies. The differences can be interpreted as a decorrelation of the neutron spectator plane and the reaction plane because of fragmentation of the remnants from the colliding nuclei, which points to an incompleteness of current models of initial state fluctuations. A significant transverse momentum dependence of the ratio $v_2${$\Psi_{\rm SP}$}/$v_2${4} is observed in all but the most central collisions, which may help to understand whether momentum anisotropies at low and intermediate transverse momentum have a common origin in initial state fluctuations. The ratios of $v_2${$\Psi_{\rm SP}$} and $v_2${4} to the corresponding initial state eccentricities for Xe-Xe and Pb-Pb collisions at similar initial entropy density show a difference of $(7.0 \pm 0.9)$% with an additional variation of +1.8% when including RHIC data in the TRENTo parameter extraction. These observations provide new experimental constraints for viscous effects in the hydrodynamic modeling of the expanding quark-gluon plasma.


Phys. Lett. B 846 (2023) 137453
HEP Data
e-Print: arXiv:2204.10240 | PDF | inSPIRE
CERN-EP-2022-061
Figure group

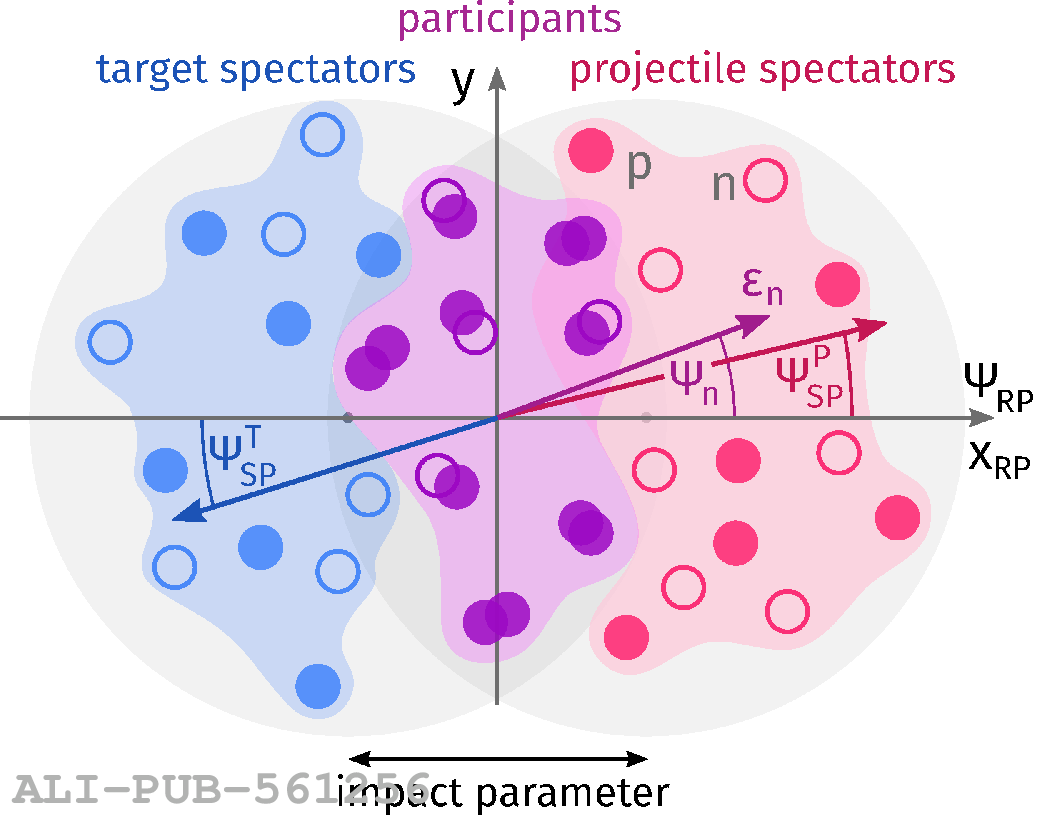
Figure 1

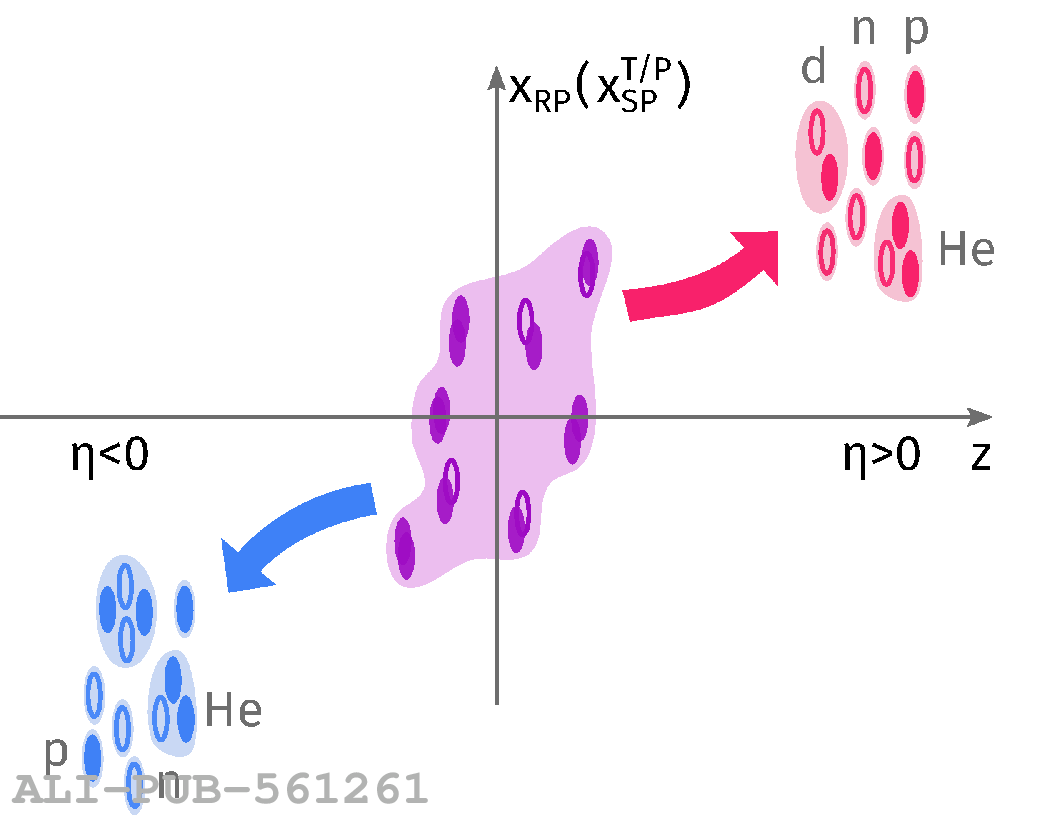
(a) transverse view. (b) longitudinal view. A sketch of the geometry of a non-central heavy-ion collision in the (a) transverse $(x_{\mathrm{RP}},y)$ and (b) reaction $(x_{\mathrm{RP}},z)$ planes The $x_{\mathrm{RP}}$ axis points along the direction of the impact parameter given by the distance between the centers of the colliding nuclei, while the $z$ axis is oriented along the direction of the colliding nuclei. The full (open) circles represent the protons (neutrons) from projectile (red) and target (blue) nuclei The participant nucleons are shown in purple. In panel (a), the arrows indicate the eccentricity vectors ($\epsilon_n$ is shown as example) and corresponding reaction (\PsiRP), projectile/target spectator ($\Psi_\mathrm{SP}^{\rm P,T}$), and participant (multiple $\Psi_n$, $n\ge1$) plane angles. Panel (b) shows the outward deflection, indicated by curved arrows, of the spectators and fragmentation products of the projectile ($\eta>0$) and target ($\eta<0$) recoil nuclei, such as protons ($p$), neutrons ($n$), and nuclei (deuteron, helium, etc).

Figure 2

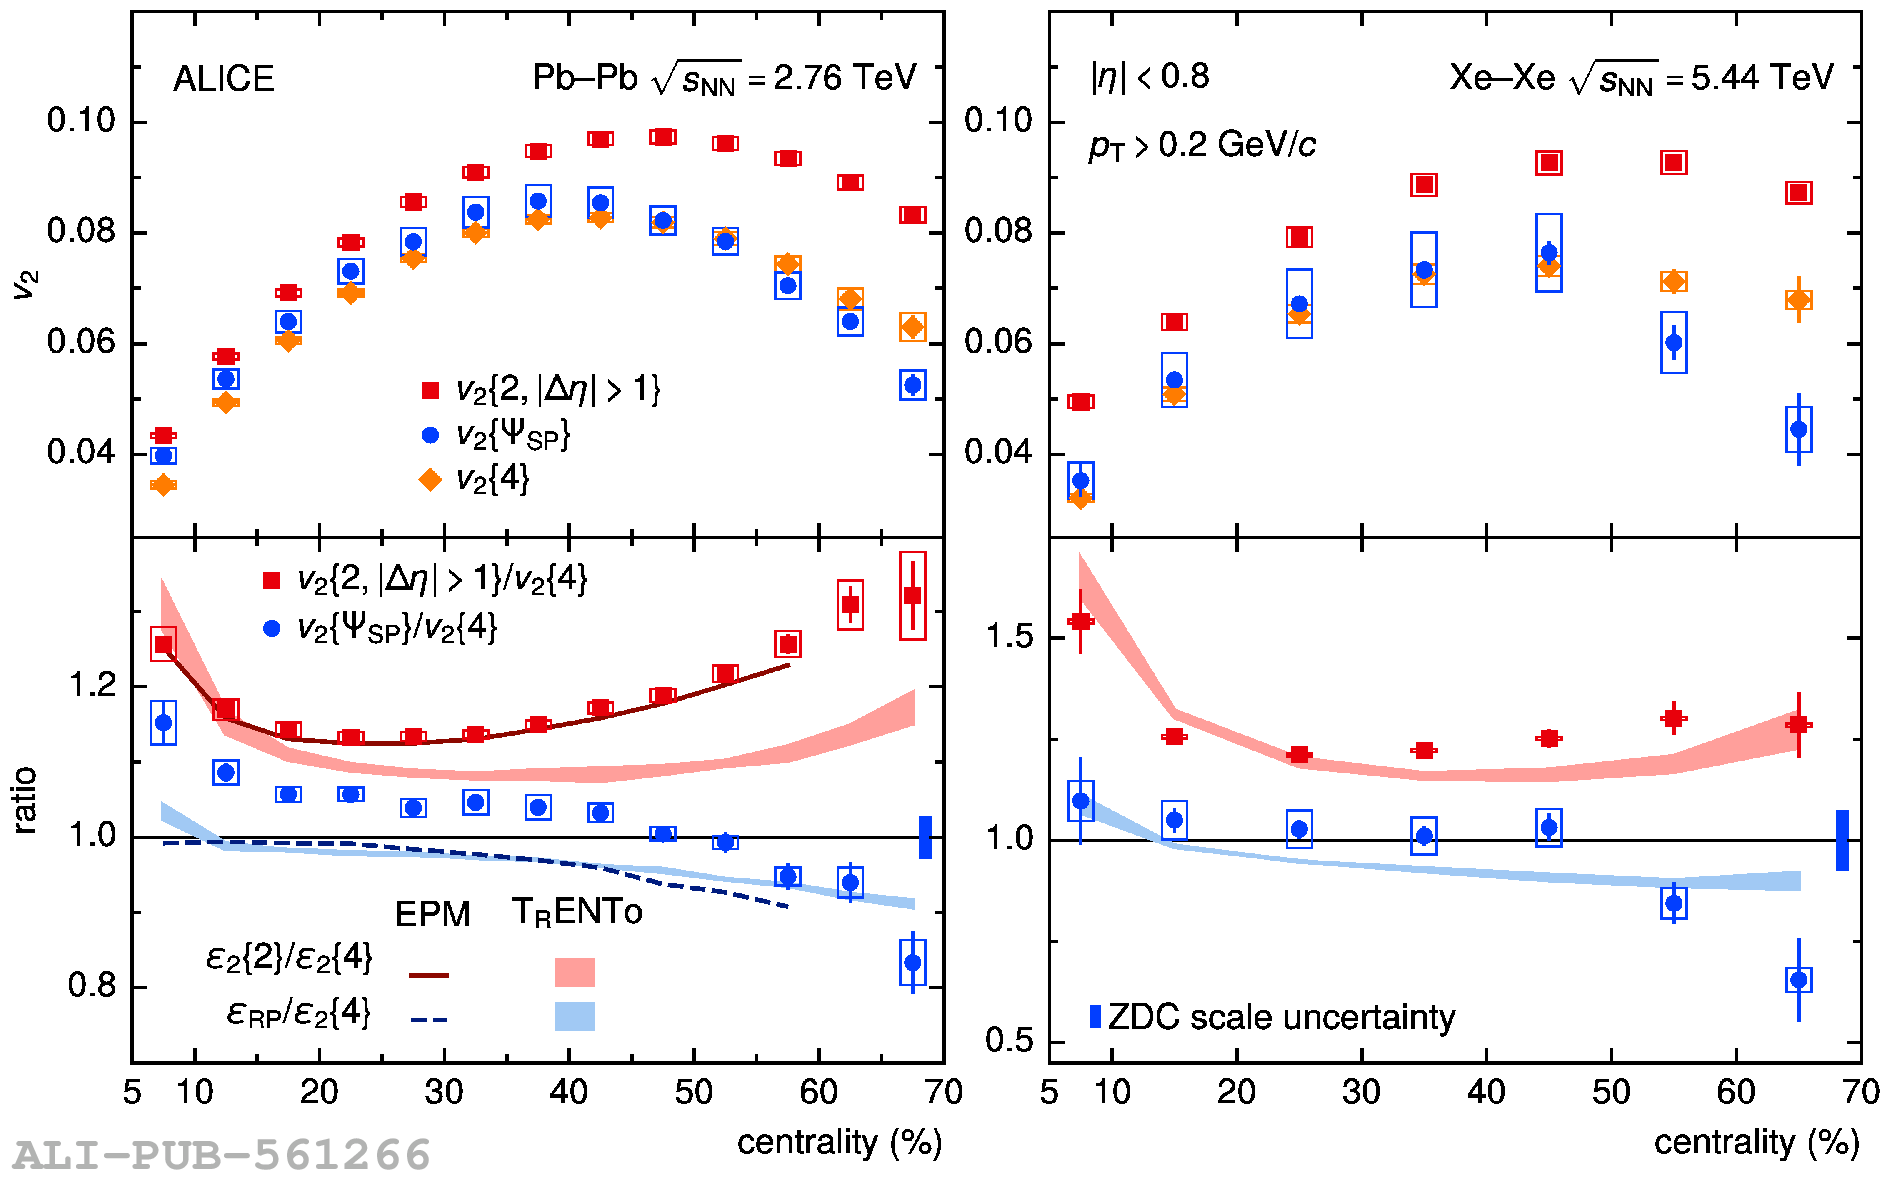
(upper panels) Elliptic flow relative to the spectator plane, $v_2\left\{\Psi_{\rm SP}\right\}$, and to the participant plane, $v_2\left\{2,|\Delta\eta|>1\right\}$ and $v_2\left\{4\right\}$, as a function of centrality in Pb-Pb (left) and Xe-Xe (right) collisions. (bottom panels) Ratios of the elliptic flow $v_2\left\{\Psi_{\rm SP}\right\}$ and $v_2\left\{2,|\Delta\eta|>1\right\}$ to $v_2\left\{4\right\}$. The dashed (solid) lines show the eccentricity ratios of $\varepsilon_{\rm RP}$ ($\varepsilon_2\left\{2\right\}$) to $\varepsilon_2\left\{4\right\}$ from the elliptic power model. The corresponding eccentricity ratios for TRENTo are shown as solid bands The error bars (open boxes) indicate statistical (systematic) uncertainties The bin-to-bin uncorrelated uncertainties and the correlated ones are combined for $v_2\left\{\Psi_{\rm SP}\right\}$ results. For the ratio $v_2\left\{\Psi_{\rm SP}\right\}/v_2\left\{4\right\}$, the ZDC scale uncertainties are shown separately as solid boxes centered at unity on the right side of the lower panels.

Figure 3

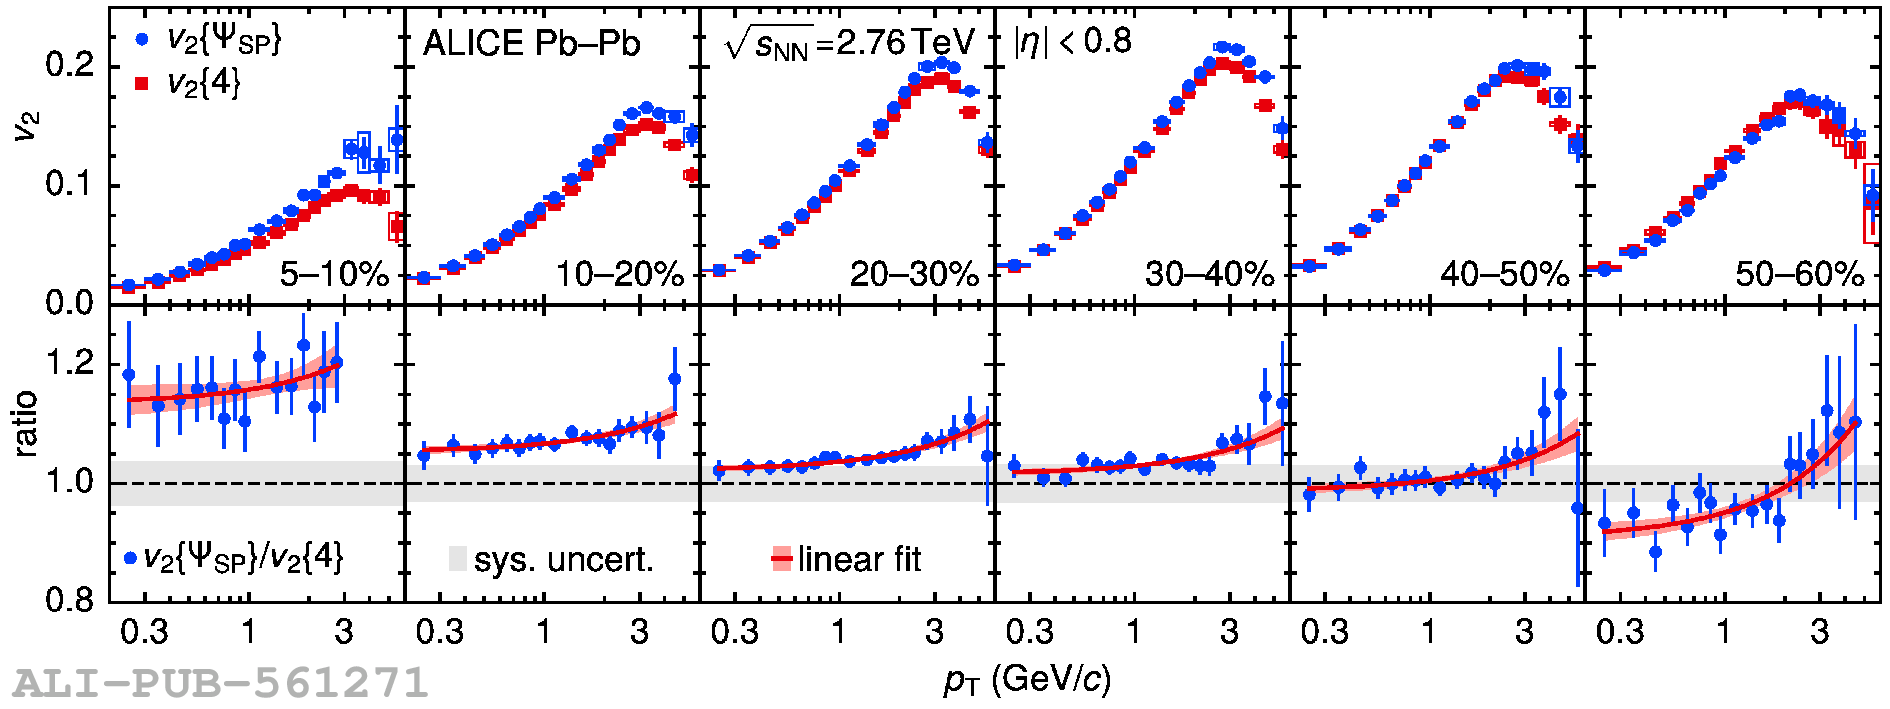
(upper panels) Elliptic flow relative to the spectator plane, $v_2\left\{\Psi_{\rm SP}\right\}$, and to the participant plane, $v_2\left\{4\right\}$, as a function of transverse momentum in different centrality classes for Pb-Pb collisions. The linear fits to the ratio $v_2\left\{\Psi_{\rm SP}\right\}/v_2\left\{4\right\}$ are shown as red lines for the individual centrality classes. The error bars (open boxes) indicate statistical (systematic) uncertainties. The correlated uncertainties, related to the ZDC, and bin-to-bin uncorrelated ones are combined for $v_2\left\{\Psi_{\rm SP}\right\}$ (upper panels). For the ratio $v_2\left\{\Psi_{\rm SP}\right\}/v_2\left\{4\right\}$ (lower panels), the correlated uncertainty is shown by the grey band at unity.

Figure 4

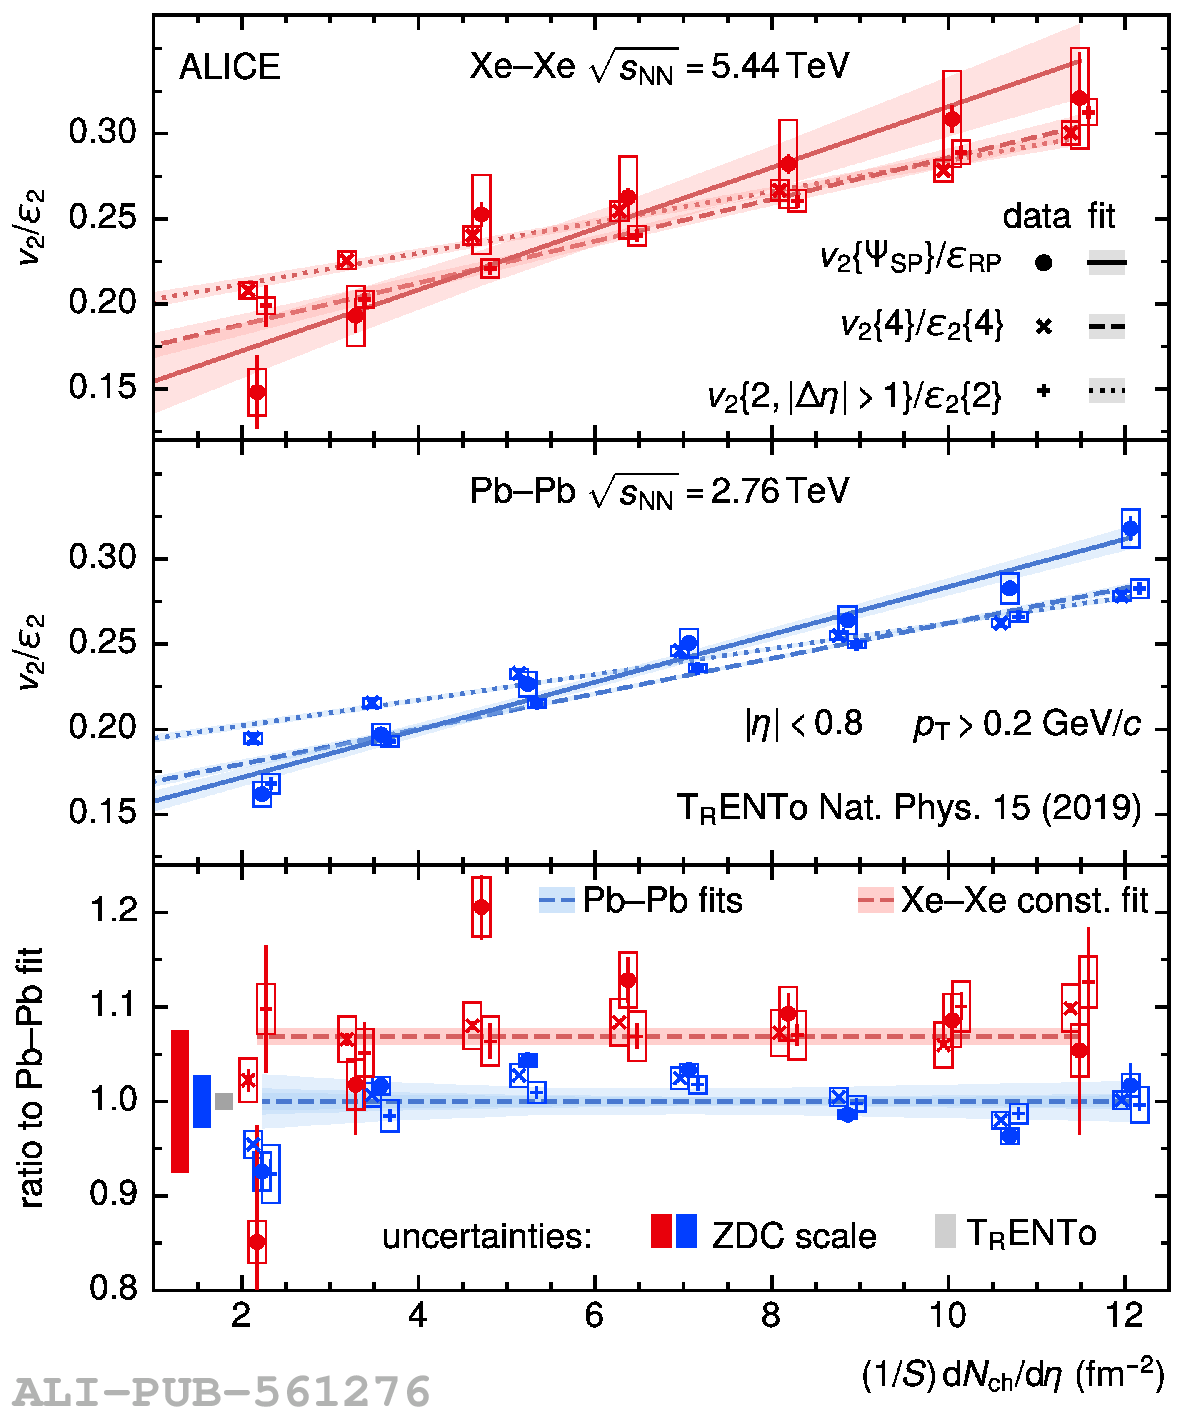
Ratios of $v_2/\varepsilon_2$ as a function of $(1/S){\rm d}N_{\rm ch}/{\rm d}\eta$ in Xe-Xe (top panel) and Pb-Pb (middle panel) collisions. The Linear fit functions to $v_2/\varepsilon_2$ in the top and middle panels are shown by lines. The bands show the uncertainty of the fit. (bottom panel) The ratio of $v_2/\varepsilon_2$ to the linear Pb-Pb fits shown in the middle panel. The data points of $v_2\left\{2,|\Delta\eta|>1\right\}$, $v_2\left\{4\right\}$ are shifted by $-0.1$ and $+0.1$ along $(1/S){\rm d}N_{\rm ch}/{\rm d}\eta$ for better visibility. The error bars (open boxes) indicate statistical (systematic) uncertainties. The ZDC scale uncertainty, due to residual correlations in the determination of the denominators in Eq. 11, and the bin-to-bin uncorrelated one are combined for $v_2\left\{\Psi_{\rm SP}\right\}$ (top and middle panels). For the ratio of $v_2\left\{\Psi_{\rm SP}\right\}$ to the Pb-Pb fit (bottom panel), the ZDC scale uncertainty is separated and is shown by the solid boxes on the left side of the bottom panel. The grey box at unity in the bottom panel on the left side shows the variation depending on the TRENTo configuration. The blue horizontal band (bottom panel) represents the relative uncertainties of the individual linear fits to the Pb-Pb data from the middle panel. The red horizontal line (bottom panel) shows a combined fit of a constant function to the Xe-Xe data and its uncertainty.