Comparison of the measured the $I_{X}^{\rm t}$ (left) and $I_{X}^{\rm a}$ (right) in 4 $< p_{\rm T} < $ 6 GeV/$c$ with model predictions. The results are shown as a function of $\langle N_{\rm ch}^{\rm T} \rangle$ for different multiplicity classes in pp (top panel), p$-$Pb (middle panel) and Pb$-$Pb (bottom panel) collisions at $\sqrt{s_{\rm NN}}$ = 5.02 TeV. The red and magenta lines show the PYTHIA 8 (Monash) and PYTHIA 8/Angantyr predictions, respectively. The blue lines show the EPOS-LHC results. The statistical and systematic uncertainties are shown by bars and boxes, respectively. | 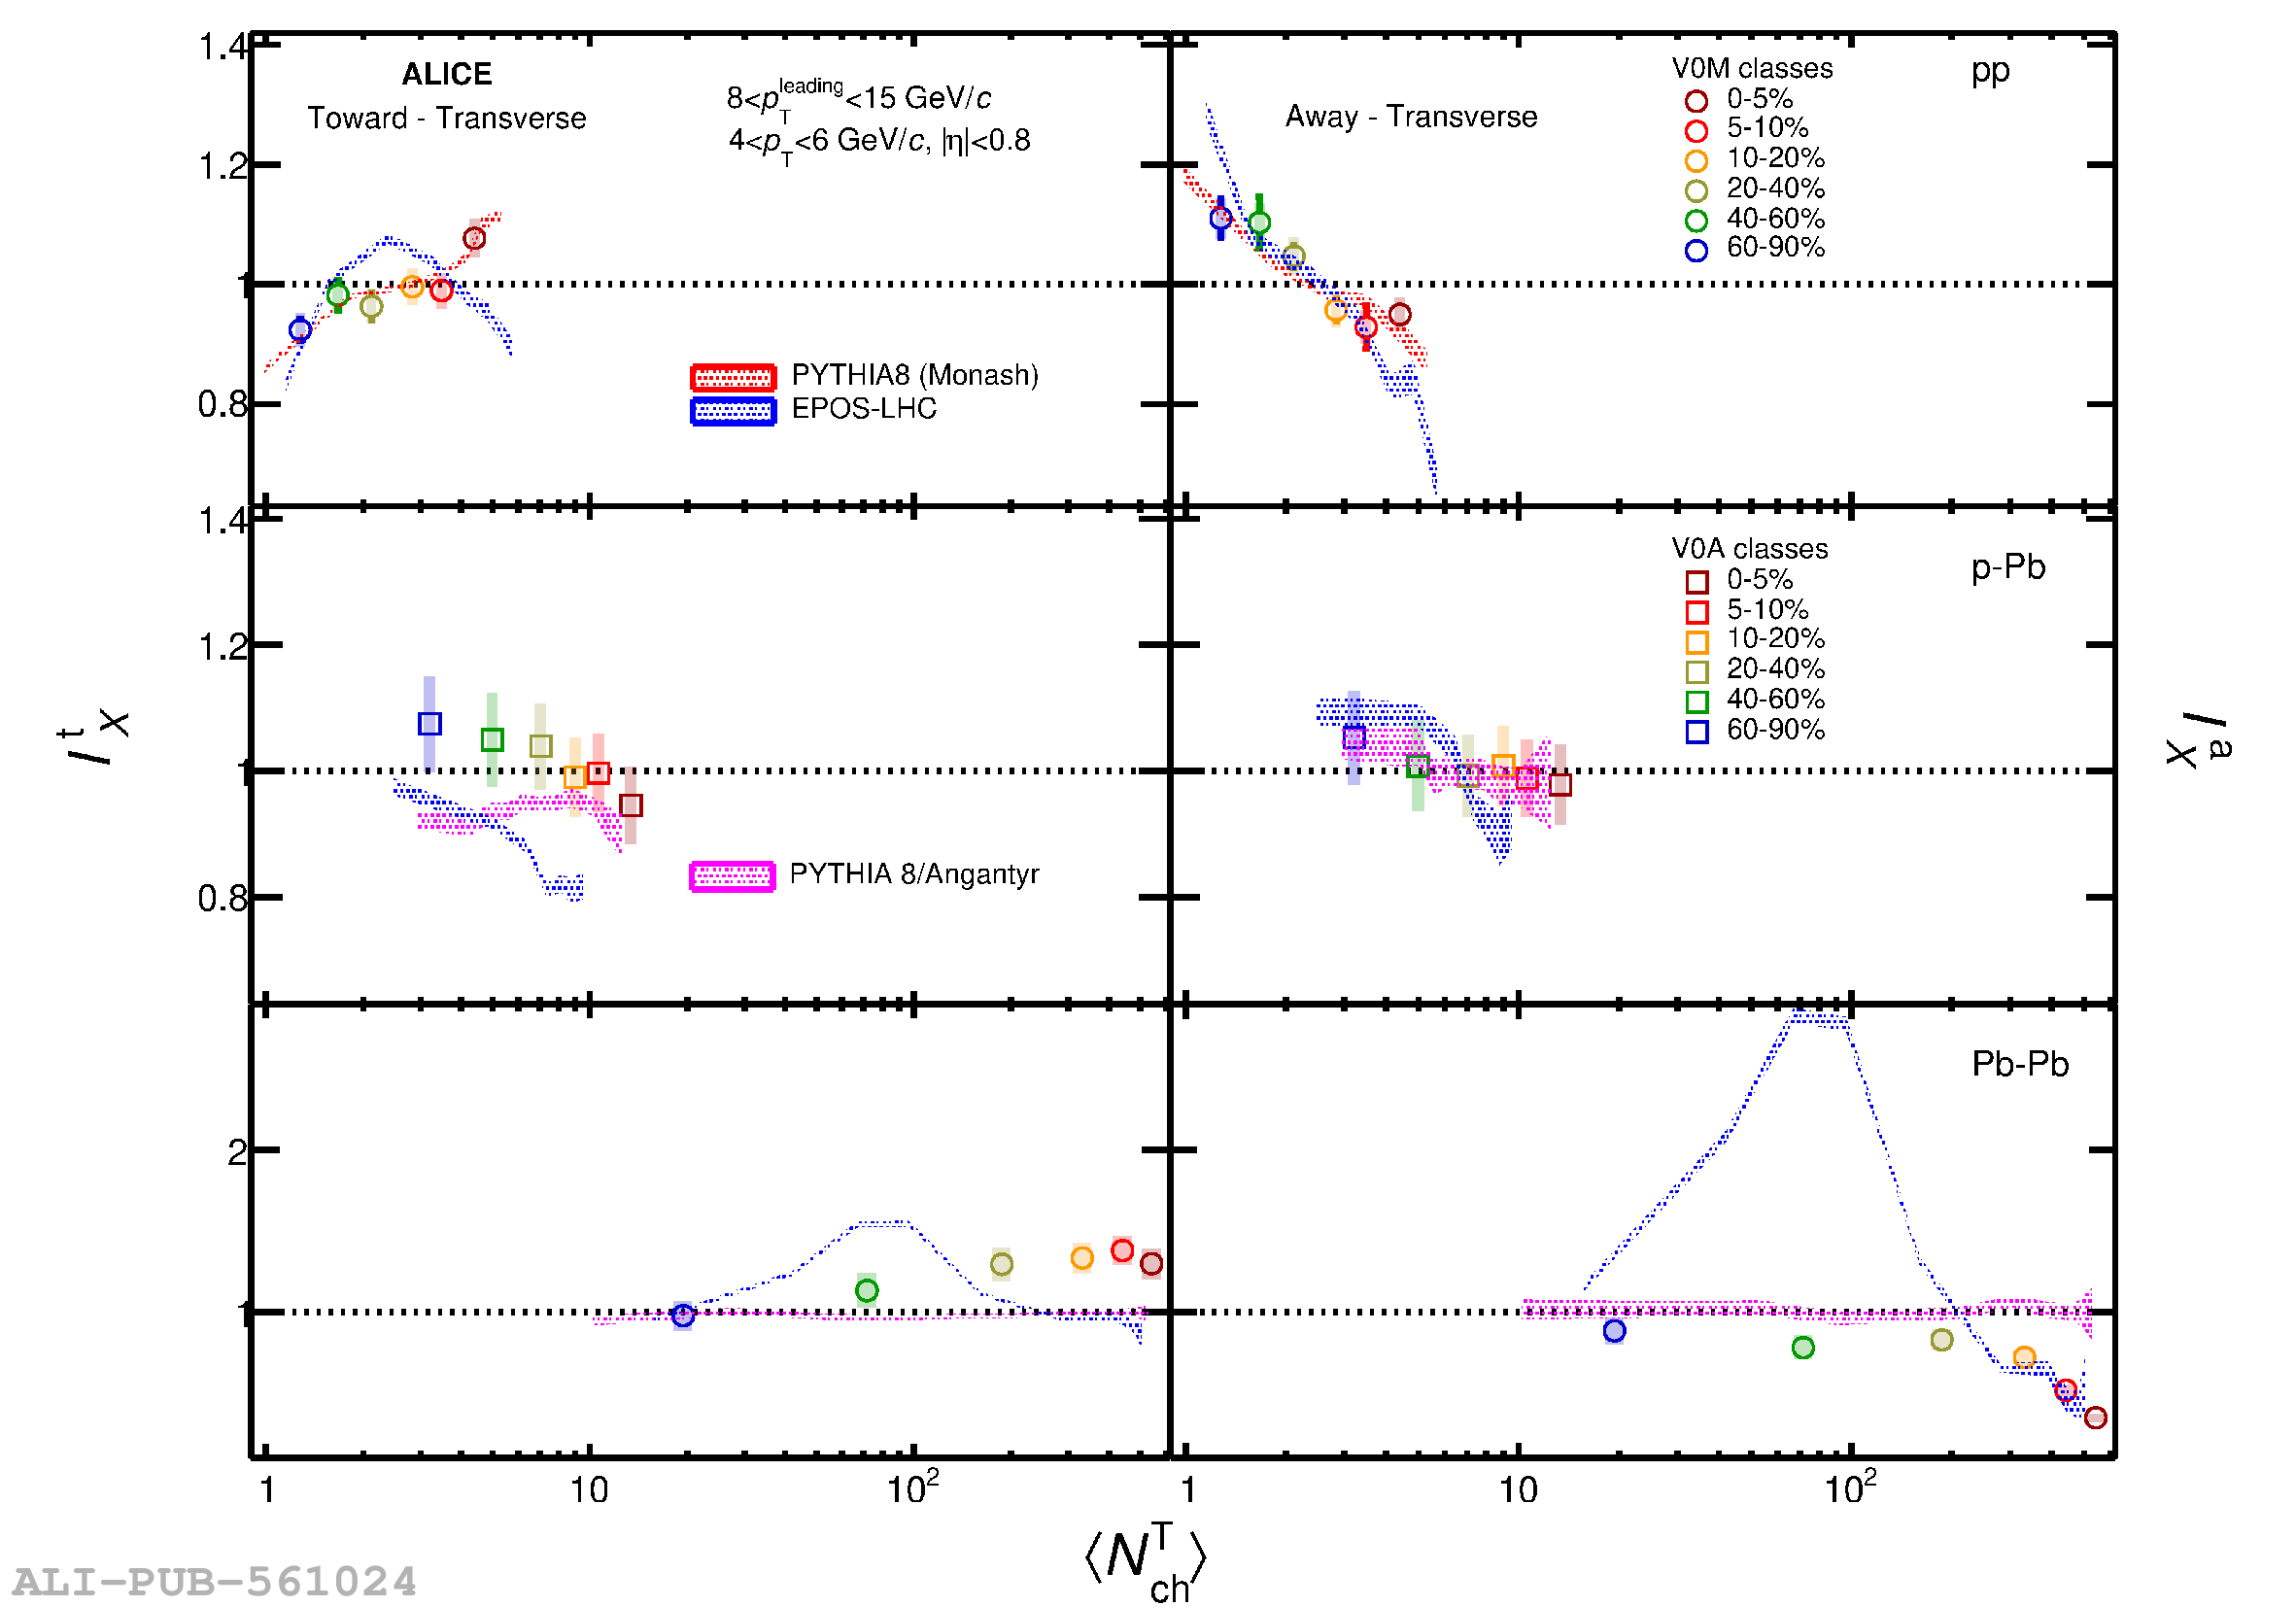 |