This letter reports measurements which characterize the underlying event associated with hard scatterings at mid-pseudorapidity ($|\eta|<~0.8$) in pp, p$-$Pb and Pb$-$Pb collisions at centre-of-mass energy per nucleon pair, $\sqrt{s_{\rm NN}}=5.02$ TeV. The measurements are performed with ALICE at the LHC. Different multiplicity classes are defined based on the event activity measured at forward rapidities. The hard scatterings are identified by the leading particle defined as the charged particle with the largest transverse momentum ($p_{\rm T}$) in the collision and having $8 <~ p_{\rm T} <~ 15$ GeV/$c$. The $p_{\rm T}$ spectra of associated particles ($0.5 \leq p_{\rm T}<~6$ GeV/$c$) are measured in different azimuthal regions defined with respect to the leading particle direction: toward, transverse, and away. The associated charged particle yields in the transverse region are subtracted from those of the away and toward regions. The remaining jet-like yields are reported as a function of the multiplicity measured in the transverse region. The measurements show a suppression of the jet-like yield in the away region and an enhancement of high-$p_{\rm T}$ associated particles in the toward region in central Pb$-$Pb collisions, as compared to minimum-bias pp collisions. These observations are consistent with previous measurements that used two-particle correlations, and with an interpretation in terms of parton energy loss in a high-density quark gluon plasma. These yield modifications vanish in peripheral Pb$-$Pb collisions and are not observed in either high-multiplicity pp or p$-$Pb collisions.
Phys. Lett. B 843 (2022) 137649
HEP Data
e-Print: arXiv:2204.10157 | PDF | inSPIRE
CERN-EP-2022-059
Figure group
Figure 1
Illustration of toward, away and transverse regions with respect to the leading particle in a collision. | 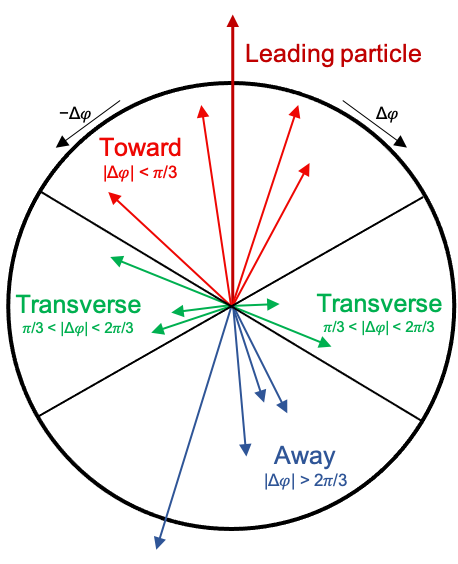 |
Figure 2
Top panels: transverse momentum spectra of charged particles in the transverse region for different multiplicity classes in pp (left), p$-$Pb (middle) and Pb$-$Pb (right) collisions at $\sqrt{s_{\rm NN}}=5.02$ TeV. The $p_{\rm T}$ spectra are measured at mid pseudorapidity ($|\eta|<0.8$). Lower panels: Ratio of $p_{\rm T}$ spectra in different multiplicity classes to the $p_{\rm T}$ spectrum in the 0$-$100% multiplicity class for the corresponding collision systems. The statistical and systematic uncertainties are shown by bars and boxes, respectively. |
![[png]](https://alice-publications.web.cern.ch/sites/default/files/papers/7843/Figure1_transverse_3.png)
Figure 3
Transverse momentum spectra of charged particles in Toward-Transverse, ${\rm{d}}N_{\rm{ch}}^{\rm{st}}/{\rm{d}}p_{\rm T}$ (top plot) and Away-Transverse, ${\rm{d}}N_{\rm{ch}}^{\rm{sa}}/{\rm{d}}p_{\rm T}$ (bottom plot) regions for different multiplicity classes in pp (left), p$-$Pb (middle) and Pb$-$Pb (right) collisions at $\sqrt{s_{\rm NN}}=5.02$ TeV. The $p_{\rm T}$ spectra are measured at mid pseudorapidity ($|\eta|<0.8$). The lower panels of both plots show the ratio to minimum bias pp collisions. The statistical and systematic uncertainties are shown by bars and boxes, respectively. | 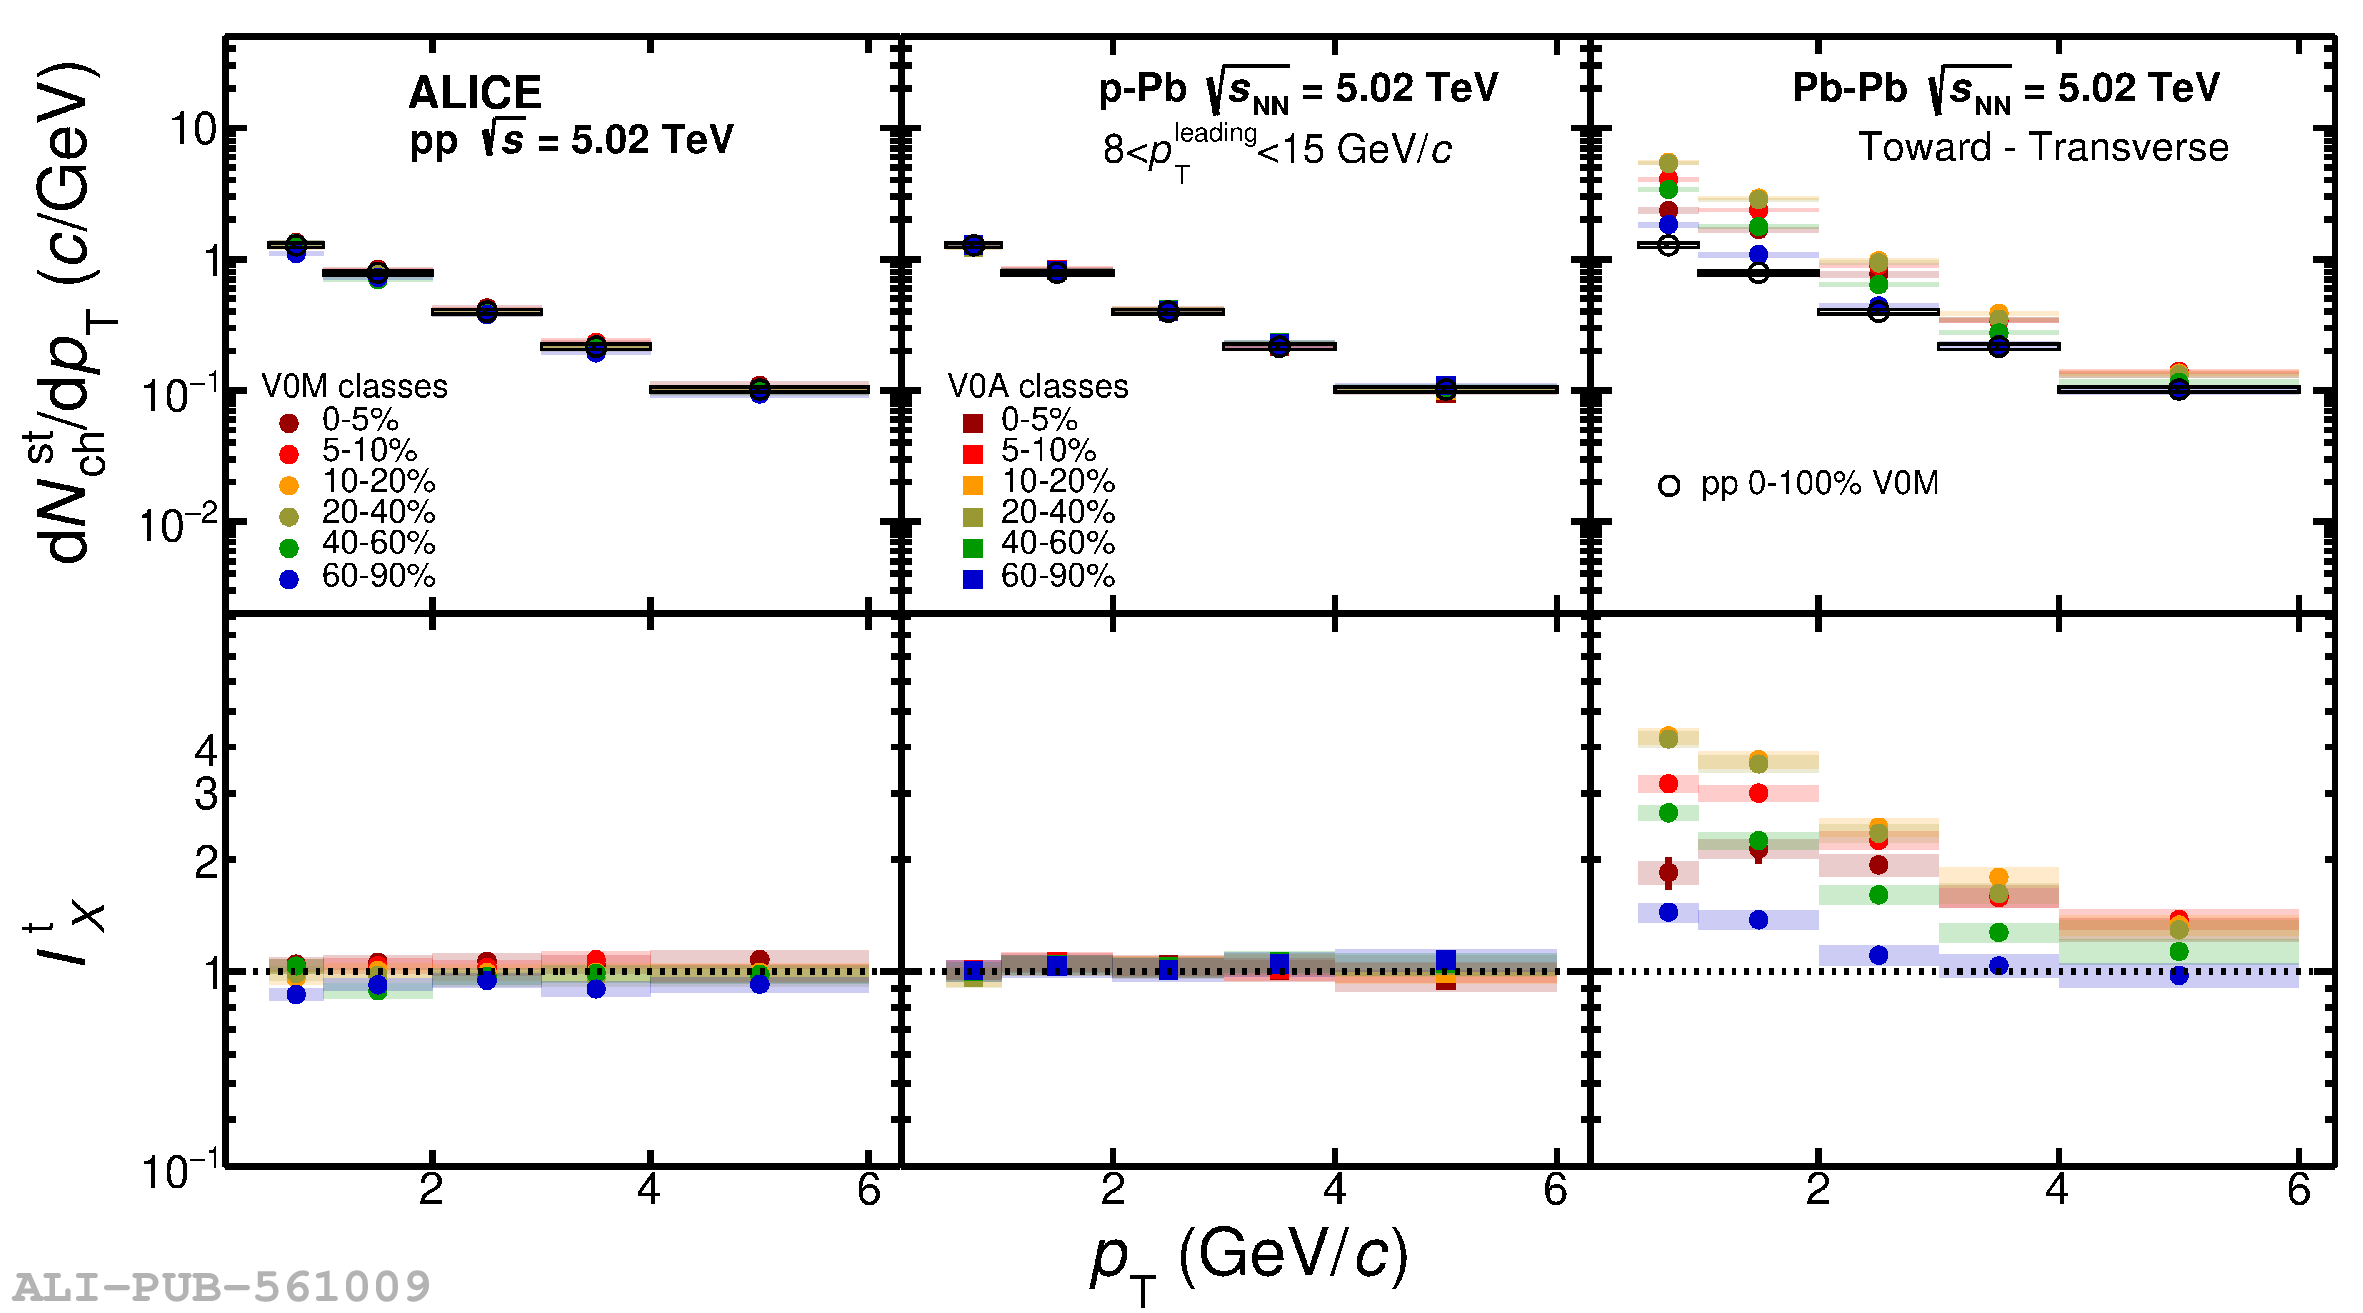 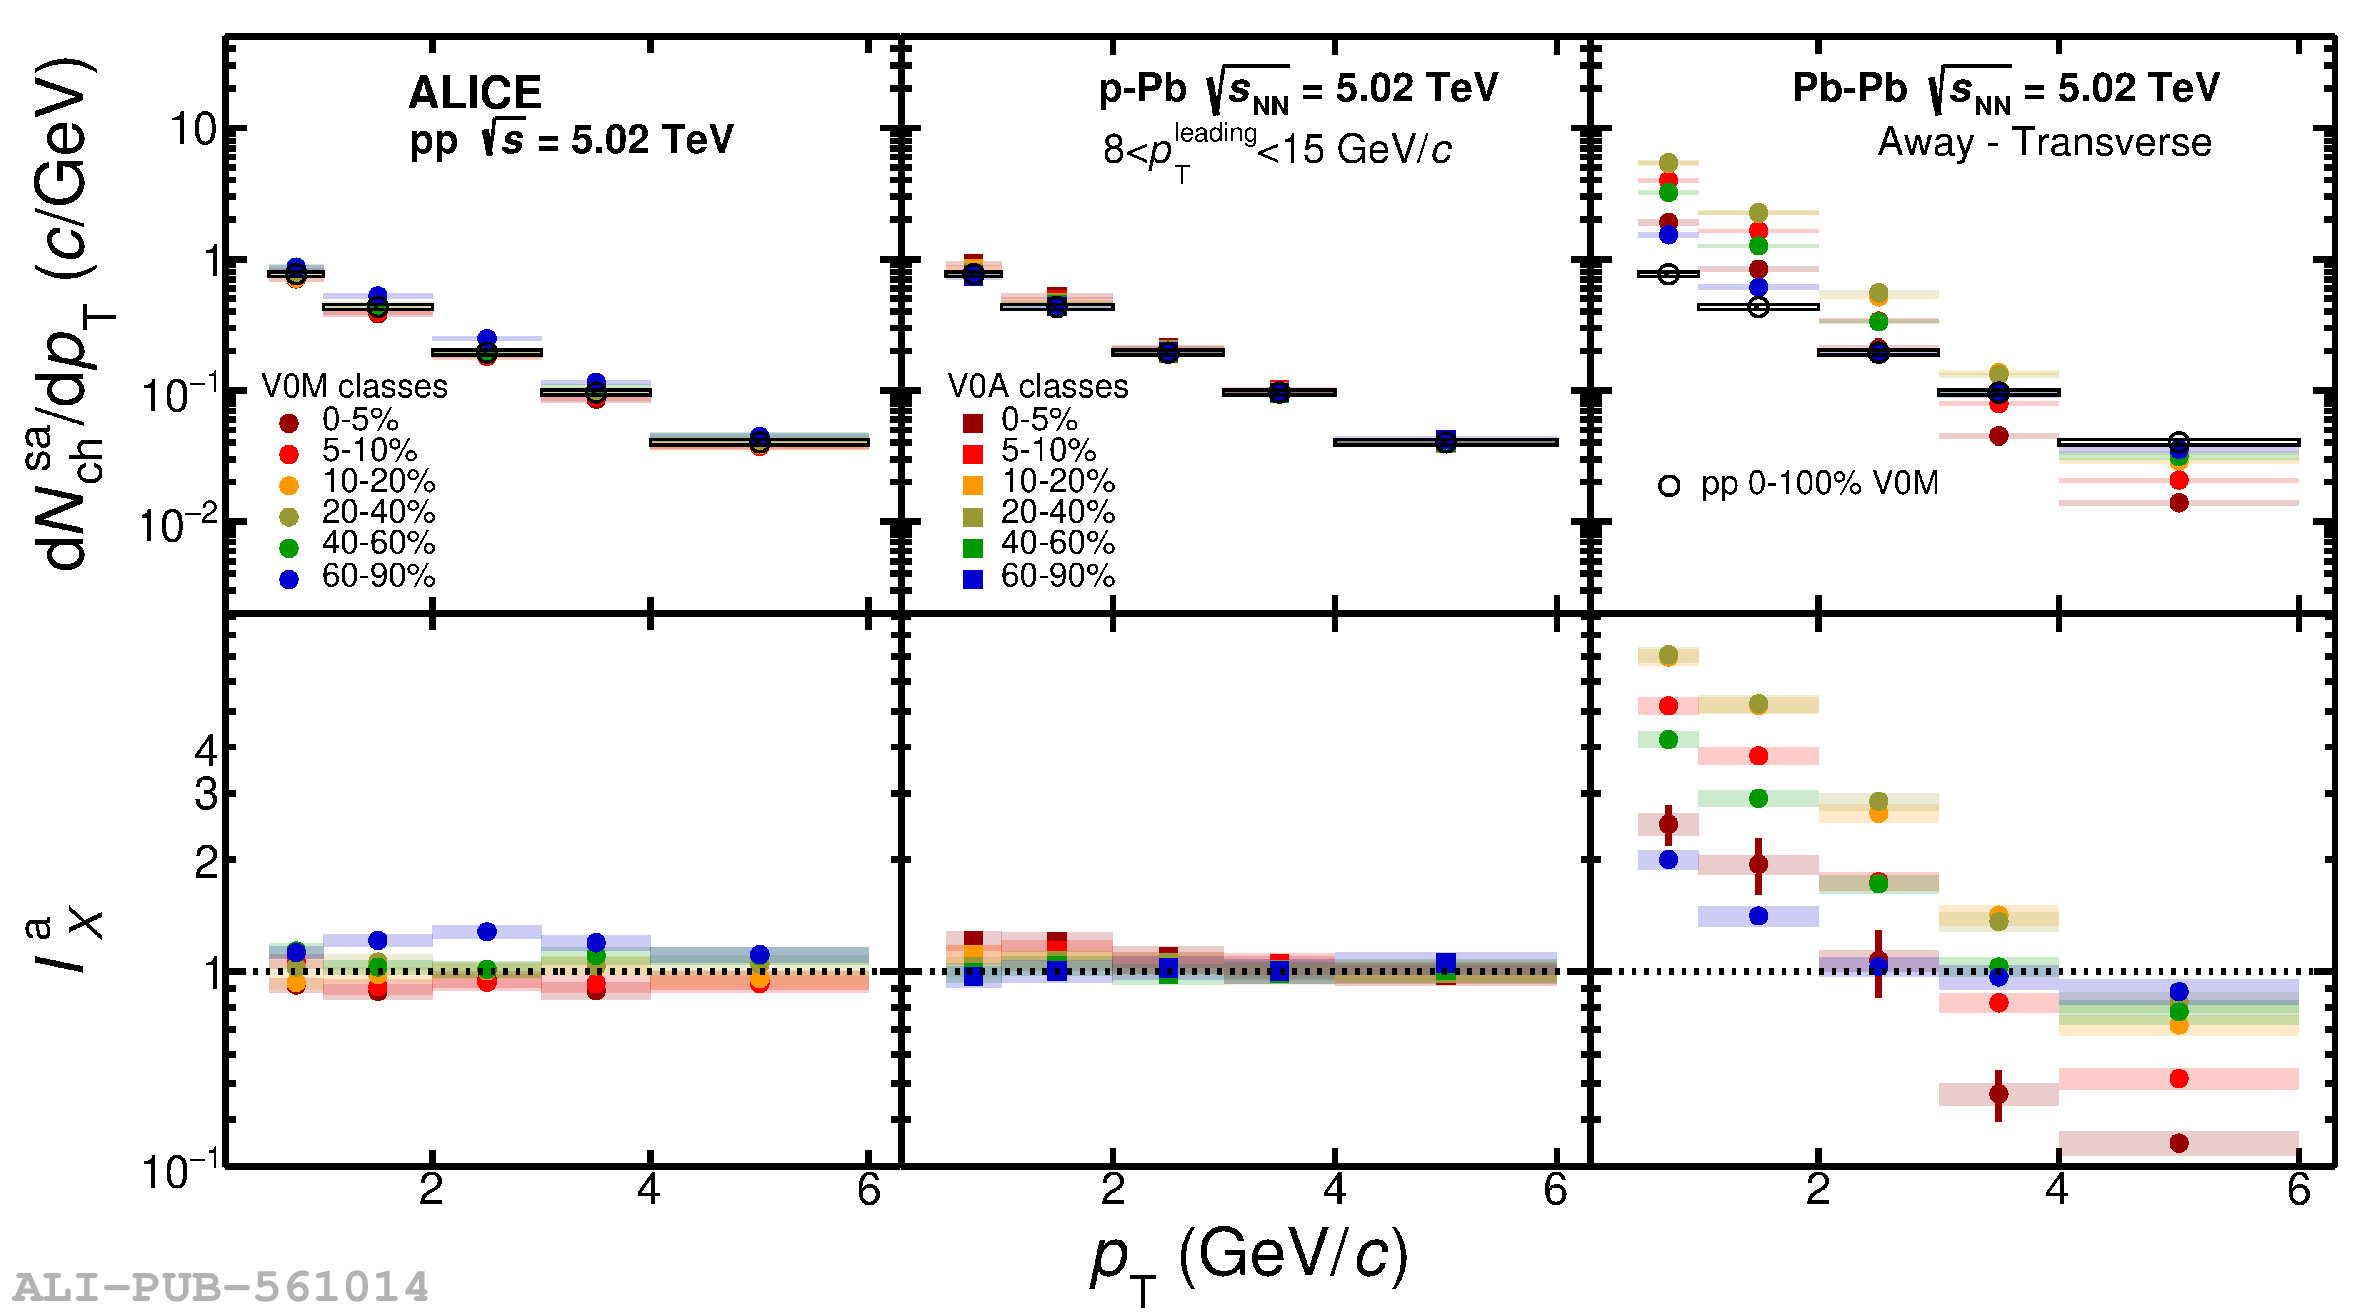 |
Figure 4
The $I_{X}^{\rm t}$ (left) and $I_{X}^{\rm a}$ (right) as a function of $\langle N_{\rm ch}^{\rm T} \rangle$ in 4 $< p_{\rm T} < $ 6 GeV/$c$ for different multiplicity classes in pp, p$-$Pb and Pb$-$Pb collisions at $\sqrt{s_{\rm NN}}$ = 5.02 TeV. Pb$-$Pb results are shown assuming a flat background (filled markers), and assuming a $v_{2}$-modulated background (empty markers). The statistical and systematic uncertainties are shown by bars and boxes, respectively. | 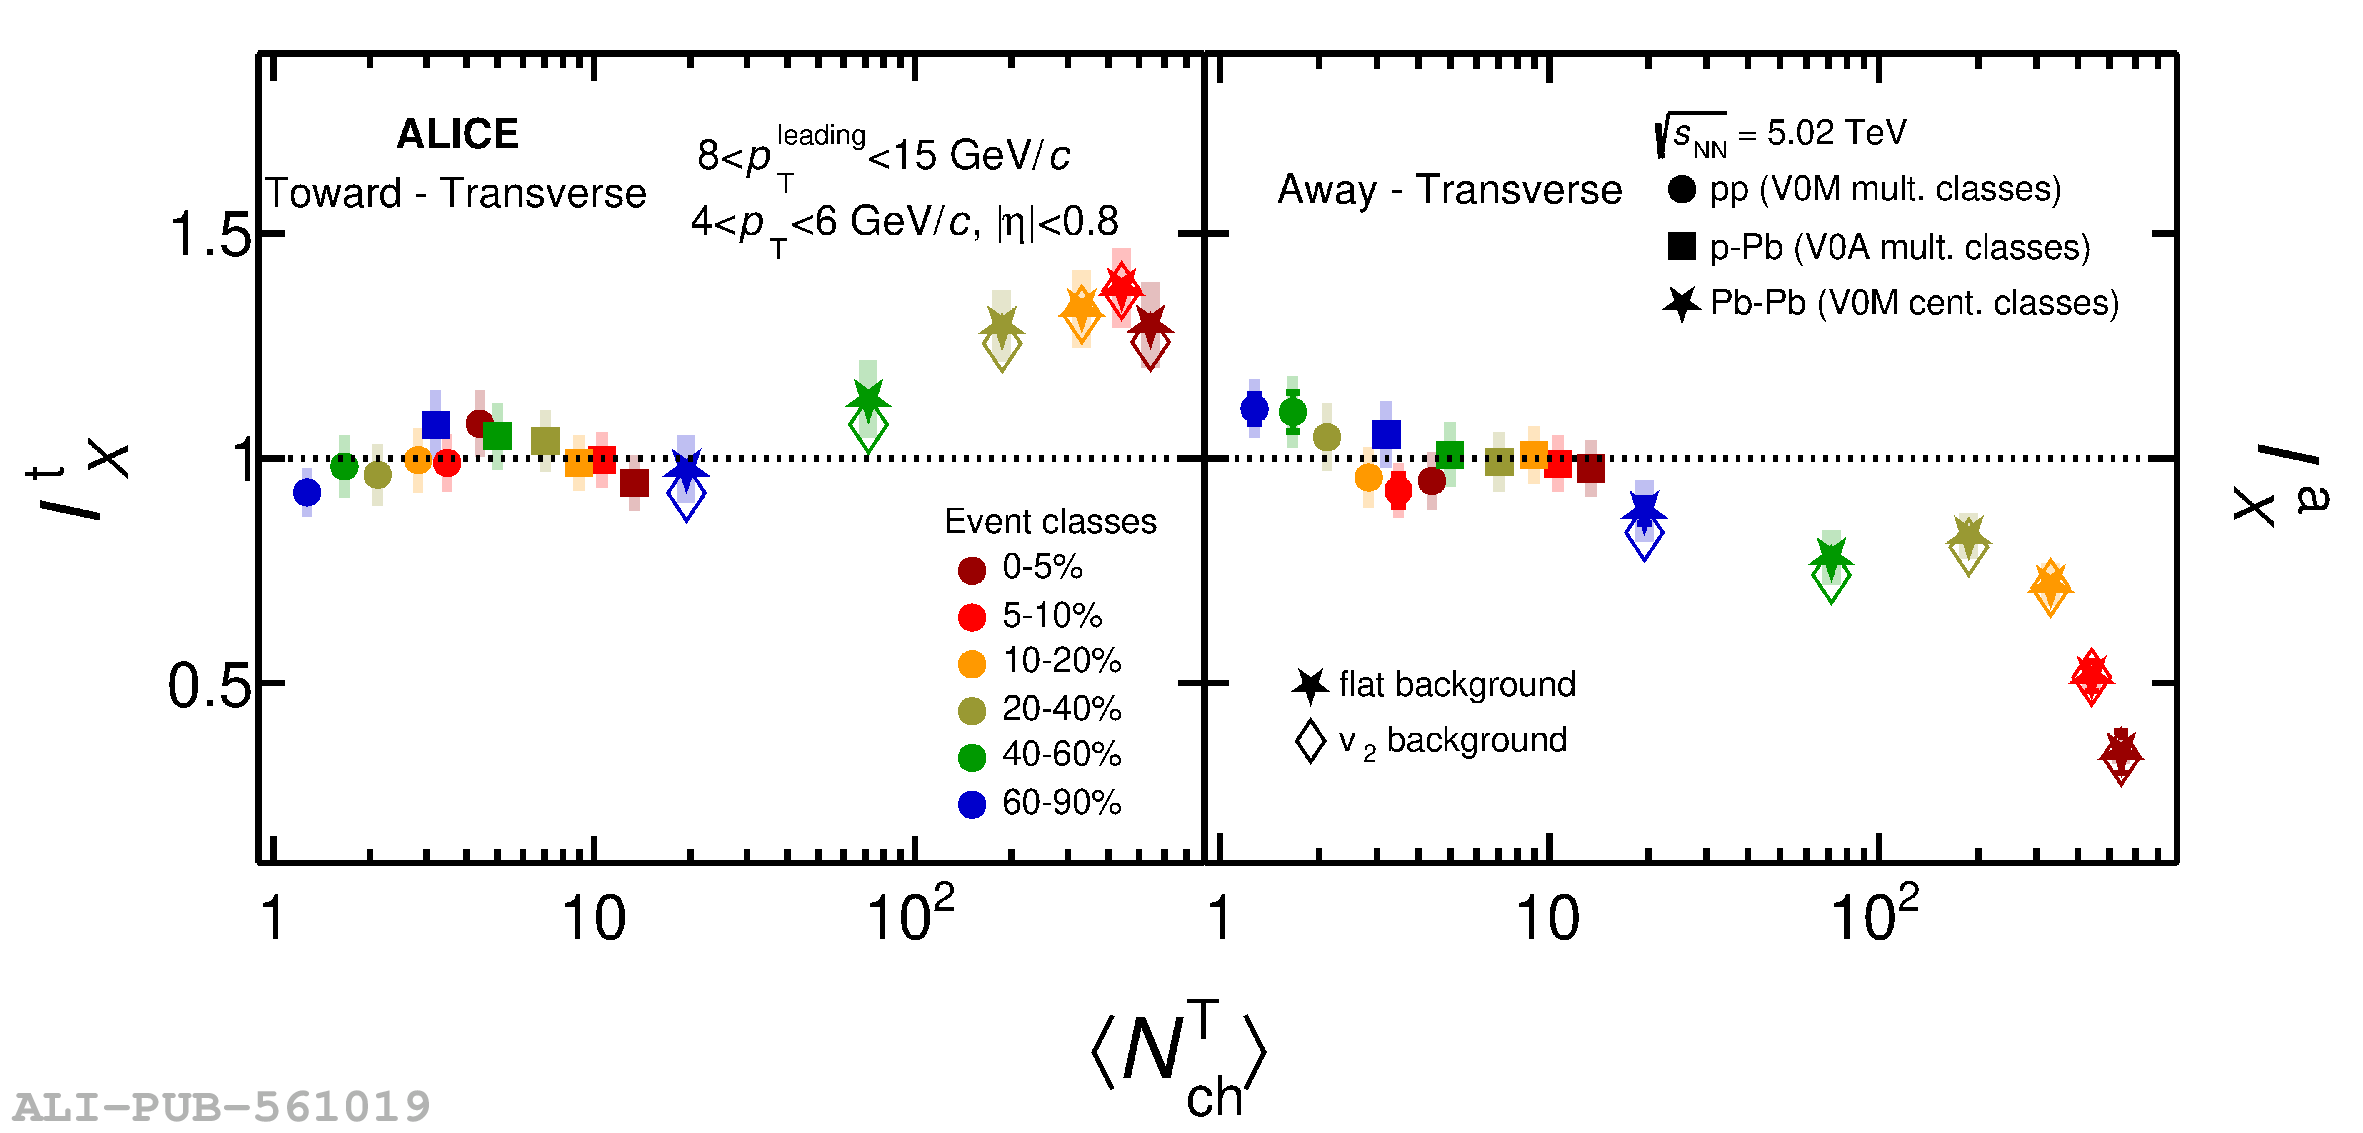 |
Figure 5
Comparison of the measured the $I_{X}^{\rm t}$ (left) and $I_{X}^{\rm a}$ (right) in 4 $< p_{\rm T} < $ 6 GeV/$c$ with model predictions. The results are shown as a function of $\langle N_{\rm ch}^{\rm T} \rangle$ for different multiplicity classes in pp (top panel), p$-$Pb (middle panel) and Pb$-$Pb (bottom panel) collisions at $\sqrt{s_{\rm NN}}$ = 5.02 TeV. The red and magenta lines show the PYTHIA 8 (Monash) and PYTHIA 8/Angantyr predictions, respectively. The blue lines show the EPOS-LHC results. The statistical and systematic uncertainties are shown by bars and boxes, respectively. | 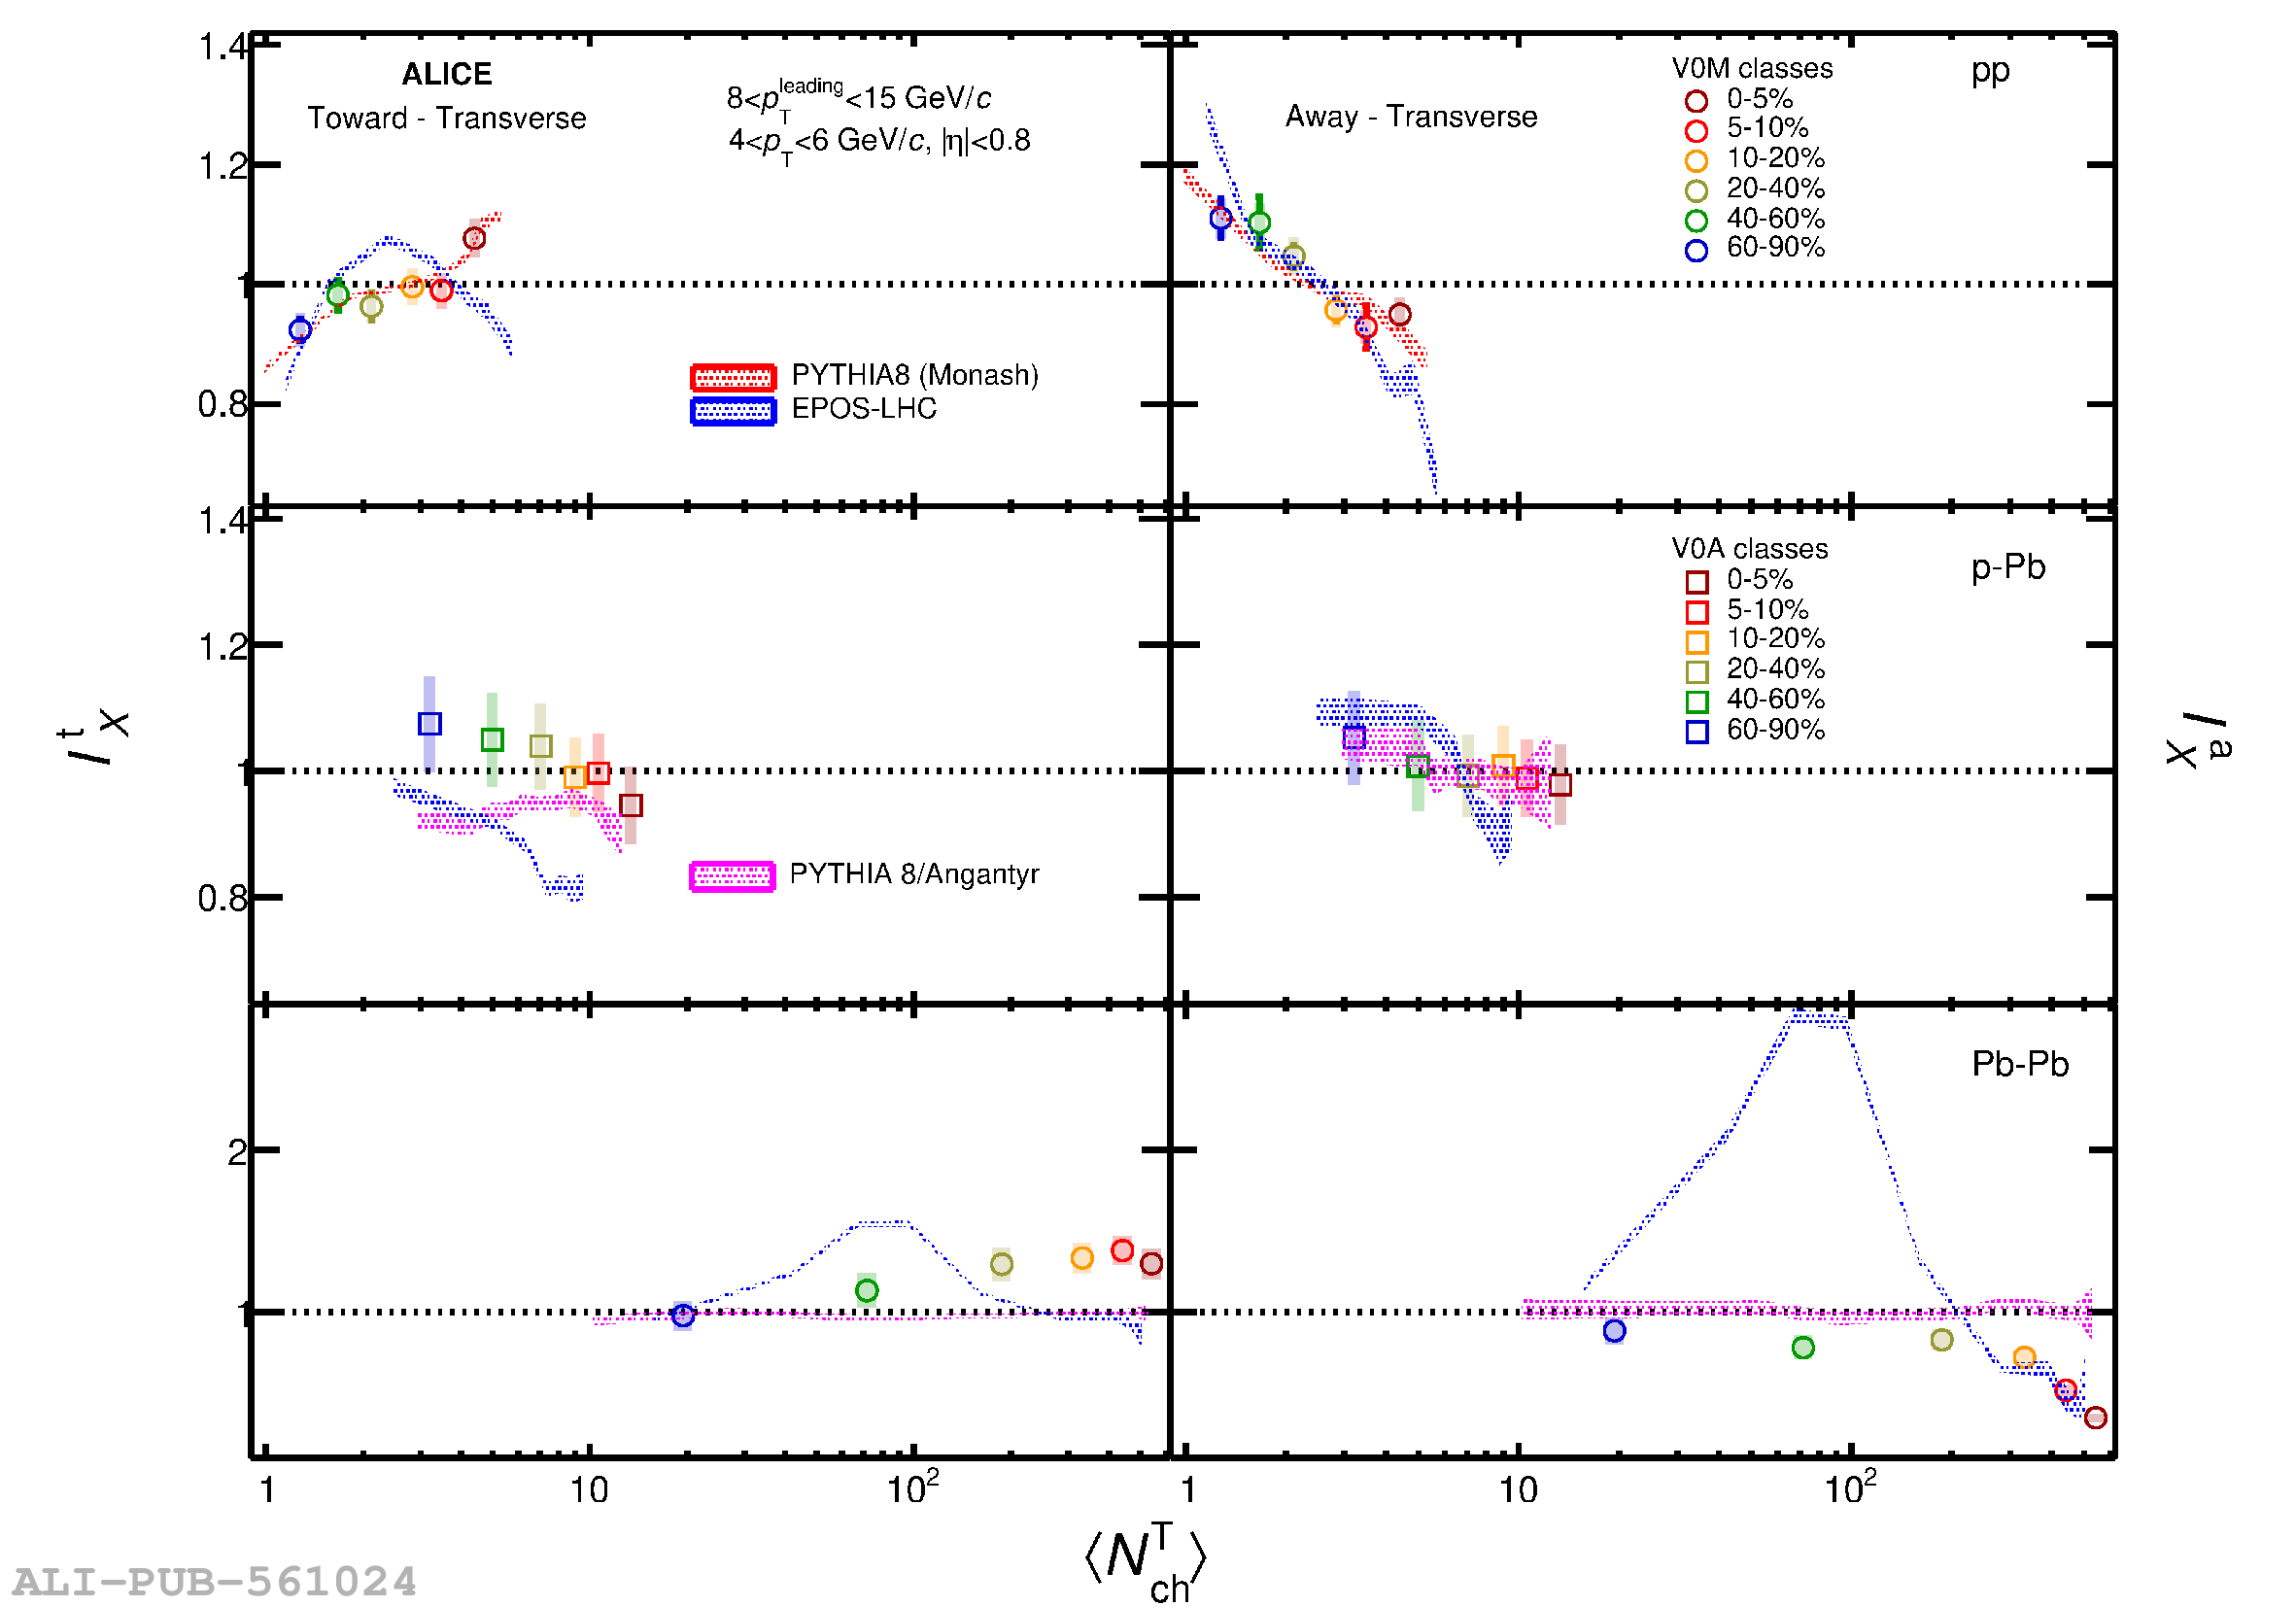 |